Articles
Till geochemical signatures associated with the Sisson W-Mo deposit, New Brunswick, Canada
ABSTRACT
A till composition study was carried out around the Sisson W-Mo deposit, New Brunswick, Canada, one of the largest W deposits in the world, to test modern analytical methods for W in till and document glacial dispersal from a significant W source. The <0.063 mm fraction of till defines glacial dispersal down ice of the deposit and use of this fraction is recommended for W-Mo exploration in the region. Metal-rich till overlying the deposit contains up to 816 ppm W and 63 ppm Mo. One km down ice, till contains 75 ppm W and 8 ppm Mo, and till in background areas contains a maximum of 7 ppm W, and 2 ppm Mo. Indicator elements for the deposit include W and Mo, and pathfinder elements include Ag, As, Bi, Cd, Cu, In, Pb, Te, and Zn. This list of elements is more extensive than previously identified for the Sisson deposit or identified in other published till geochemical studies because of the polymetallic nature of the Sisson deposit and the broad suite of elements that can now be determined using modern analytical techniques. Lithium meta/tetraborate fusion inductively coupled plasma-mass spectrometry was used to determine the total concentration of W in till and is a fast and cost effective method as compared to those reported in the older literature. Glacial dispersal of W and Mo from the Sisson deposit is detectable at a regional scale at least 14 km down ice (southeast) using surface till sampling. A 2 km till sample spacing should be sufficient to detect glacial dispersal from a W-Mo deposit of this size.
RÉSUMÉ
Une étude de composition du till a été réalisée autour du dépôt de Sisson, composé de tungstène et de molybdène et situé au Nouveau-Brunswick, au Canada. Il s’agit de l’un des plus importants dépôts de tungstène au monde. L’étude a été réalisée pour mettre à l’essai les méthodes modernes d’analyse du tungstène contenu dans le till et pour obtenir des données sur la dispersion glaciaire d’une importante source de tungstène. La fraction inférieure à 0,063 mm du till définit la dispersion glaciaire du dépôt sous la glace et on recommande l’utilisation de cette fraction pour l’exploration du tungstène-molybdène dans la région. Le till riche en métal sus-jacent au dépôt contient jusqu’à 816 ppm de tungstène et 63 ppm de molybdène. À un kilomètre sous la glace, le till contient 75 ppm de tungstène et 8 ppm de molybdène, tandis que la partie inférieure du till contient tout au plus 7 ppm de tungstène et 2 ppm de molybdène. Parmi les éléments indicateurs du dépôt, on trouve du tungstène et du molybdène, et les indicateurs géochimiques comprennent notamment l’argent, l’arsenic, le bismuth, le cadmium, le cuivre, l’indium, le plomb, le tellure et le zinc. Puisque le dépôt de Sisson est de nature polymétallique et qu’il est maintenant possible de définir une vaste gamme d’éléments grâce aux techniques modernes d’analyse, la liste d’éléments est plus longue que celle précédemment établie pour le dépôt de Sisson ou que ce qui a été publié dans d’autres études géochimiques du till. Pour déterminer la concentration totale de tungstène dans le till, on a eu recours à la spectrométrie de masse avec plasma à couplage inductif avec fusion au méta/tétraborate de lithium, qui constitue une méthode plus rapide et économique que celles signalées dans la documentation précédente. Il est possible de détecter la dispersion glaciaire du tungstène et du molybdène du dépôt de Sisson à l’échelle régionale à au moins 14 km sous la glace (sud-est) au moyen de l’échantillonnage de surface du till. Un intervalle de prélèvement du till de 2 km devrait suffire pour détecter la dispersion glaciaire d’un dépôt de tungstène-molybdène de cette taille.
[Traduit par la redaction]
INTRODUCTION
1 Tungsten is a dense hard metal with a high melting point and resistance to corrosion that make it optimal for a wide range of applications including hard metals, high density applications, lighting, electronics, and tungsten chemical compounds (Stewart et al. 2011). China produces most of the W that is consumed globally and now restricts its W exports to meet its own domestic demands. As a result, there is an increasing need for exploration and development of new W resources elsewhere in the world (United States Geological Survey 2014).
2 The use of till geochemistry for W exploration in glaciated terrain is well documented (e.g., Brundin and Bergstrom 1977; Toverud 1984; Salminen and Hartikainen 1986; Snow and Coker 1987; Coker et al. 1988; Rogers et al. 1990); however, most published reports date back to till sampling surveys or programs carried out the 1970s and 1980s. Analytical methods for W have improved significantly since that time and consequently, the determination of the W content in till is now routine and inexpensive, and many more elements on the periodic table may now also be determined. In the past 20 years, however, no case studies have been published that describe till geochemical signatures around W mineralization using these modern analytical methods. The Sisson W-Mo deposit in eastern Canada provides an ideal site to test the ability of modern analytical methods to determine W content in till as well as identify pathfinder elements using the broad range of elements that can now be determined, document the multi-element geochemical signature of a significant W-Mo deposit at varying distances down ice, and develop specific recommendations to improve the application of till geochemistry to W-Mo exploration in glaciated terrain.
3 The deposit was chosen as a test site because: (1) mineralized rocks subcrop below till and were exposed to glacial erosion; (2) it is till covered and thus material is available for sampling; and (3) it has a previously identified till geochemical dispersal train down ice and thus, metal-rich till is available for targeted sampling. The study described here was carried out as part of the Geological Survey of Canada’s (GSC) Targeted Geoscience Initiative 4 (TGI-4), a collaborative federal geoscience program with a mandate to provide industry with the next generation of geoscience knowledge and innovative techniques that will result in more effective targeting of buried mineral deposits. The study was a collaborative effort between the GSC, the New Brunswick Department of Energy and Mines (NBDEM), Northcliff Resources Ltd., and Hunter Dickinson Inc.
Location and Access
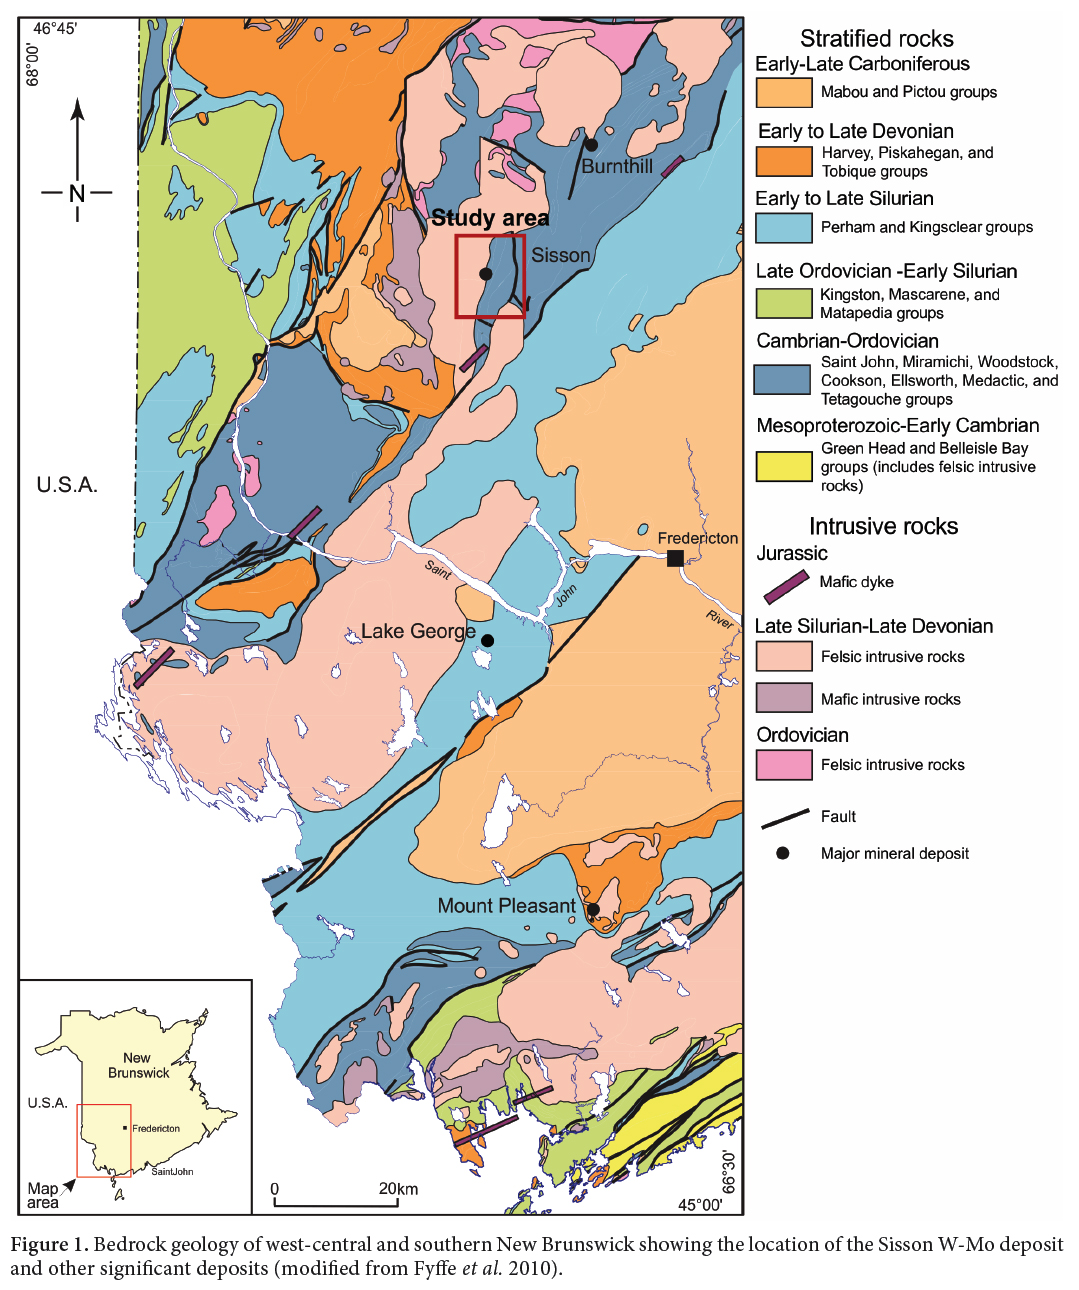
4 The Sisson W-Mo deposit is in the west-central part of the province of New Brunswick (Fig. 1) in eastern Canada, at latitude 46°22’10” N and longitude 67°03’00” W in the Coldstream NTS map area (NTS 21 J/06). It is located 60 km northwest of Fredericton and is easily accessed by truck along logging roads.
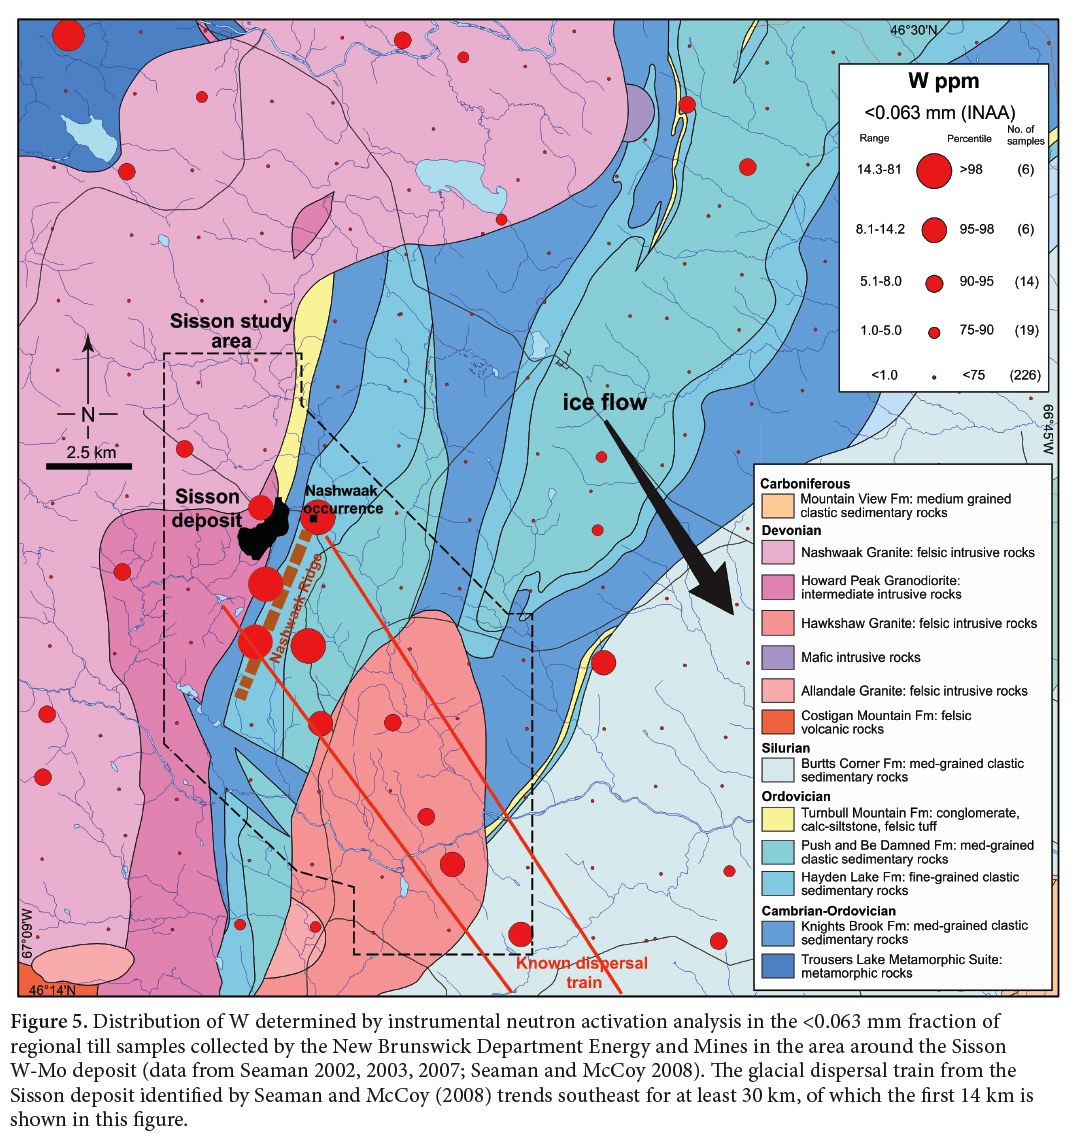
 Display large image of Figure 1
GEOLOGY
Local Bedrock Geology
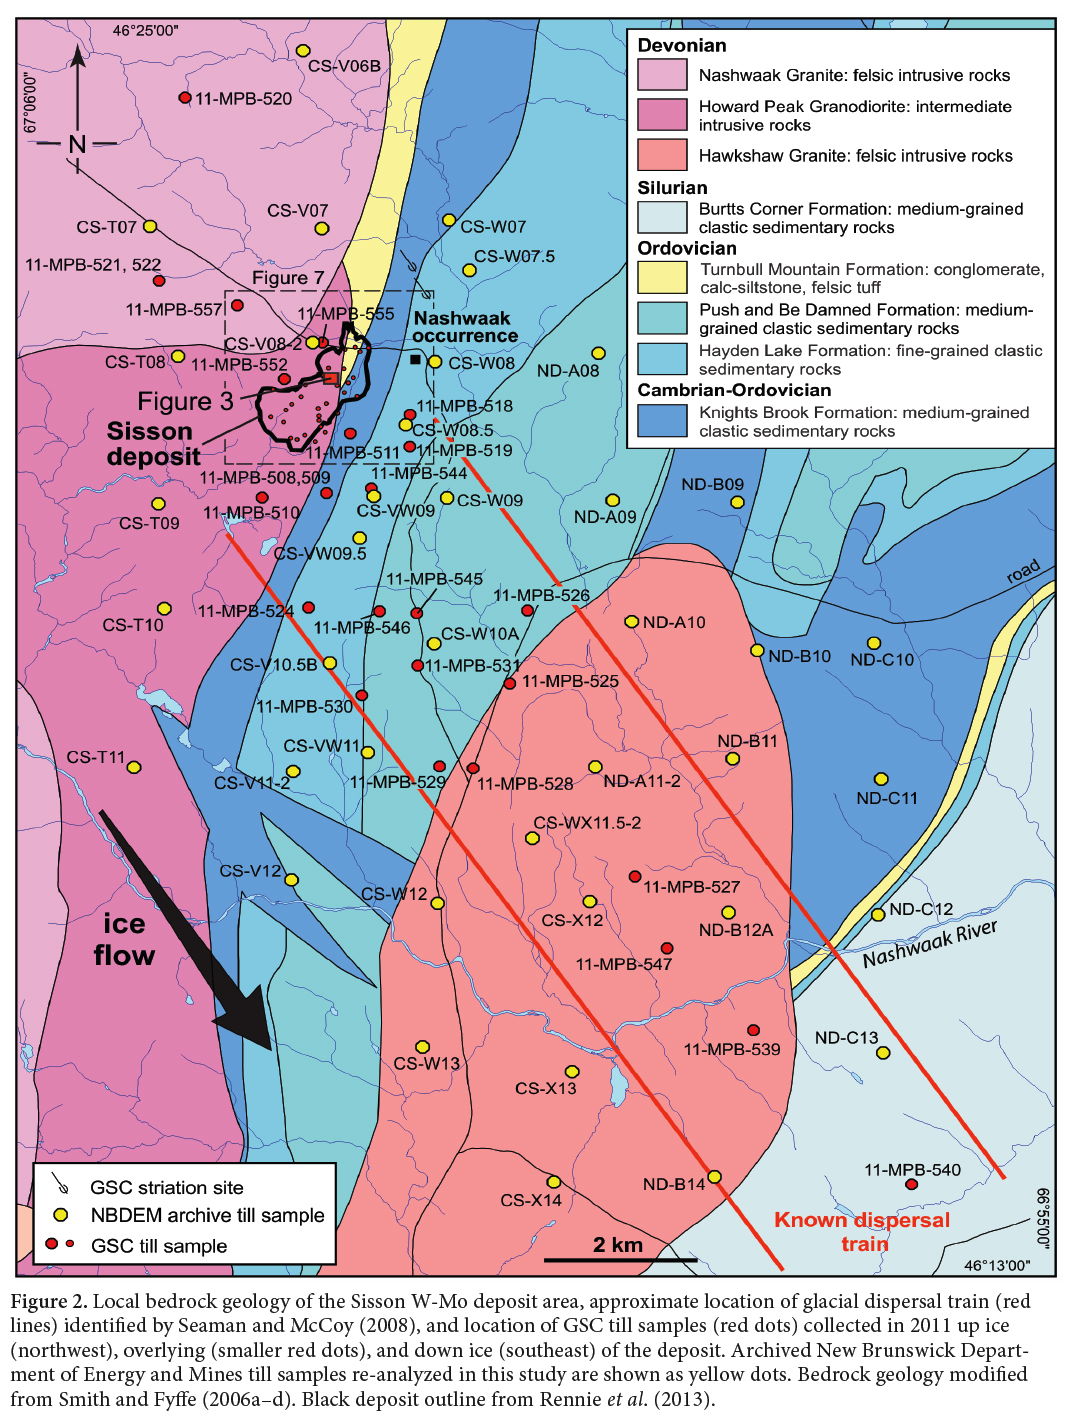
5 The Sisson deposit is a bulk tonnage W-Mo intrusion-related deposit that has been explored by various companies over the past 50 years. The geology of the deposit area is summarized below from Nast and Williams-Jones (1991), Marr (2009), Fyffe et al. (2008, 2010), and Rennie et al. (2013). The deposit occurs at the eastern contact of the Nashwaak Granite and Howard Peak Granodiorite plutons (Fig. 2). The Howard Peak Granodiorite grades eastward into and becomes intermixed with gabbro. Both the gabbro and granodiorite are transected by granite dykes that are likely offshoots of the Nashwaak pluton. All of these plutons are part of a group of Late Silurian to Early Devonian plutonic rocks that form a northeast-trending belt underlying the Miramichi Highlands in central New Brunswick. The intrusive belt also hosts the Lake George Sb deposit 60 km south of the Sisson deposit, the Burnthill W, Sn, and Mo showings 30 km to the northeast, and the Mount Pleasant deposit 100 km to the south (Fig. 1).
6 East of the Howard Peak Granodiorite are Ordovician tuffaceous volcanic and sedimentary rocks of the Turnbull Mountain Formation (Fig. 2) of the Tetagouche Group, a belt of strongly deformed Ordovician rocks that extends from the Bathurst area to the northeast, through the Sisson area, and into the southwestern corner of New Bruns- wick. East of these Turnbull Mountain Formation rocks are quartzite and shale of the Cambrian–Ordovician Miramichi Group (Knights Brook Formation). This package is overlain to the east by additional Tetagouche Group rocks including pyritiferous black shale intercalated with felsic volcanic rocks and mafic volcanic rocks of the Hayden Lake Formation as well as wacke and shale of the Push and Be Damned Formation (Fig. 2).
7 The Ordovician volcanic and sedimentary rocks (Tetagouche Group), which underlie the east part of the Sisson area, are a continuation of the belt of rocks that host volcanogenic massive sulphide (VMS) deposits of the Bathurst Mining Camp in northeastern New Brunswick. For this reason, the Sisson area was the focus of major exploration programs from the 1950s into the 1990s. These activities led to the discovery in 1960 of the small but high-grade Nashwaak Pb-Zn-Ag-Sb occurrence (Fig. 2) subcropping under thin till cover, only ~900 m east of the Sisson deposit. This occurrence is a stratabound pod and was originally interpreted as a syngenetic VMS showing (e.g., Snow and Coker 1987). More recently, the Pb-Zn-Ag-Sb mineralization has been interpreted to be a vein-type showing related to the Sisson mineralizing system (Marr 2009; Rennie et al. 2013; New Brunswick Department of Energy and Mines 2013).
 Display large image of Figure 2
Deposit Geology
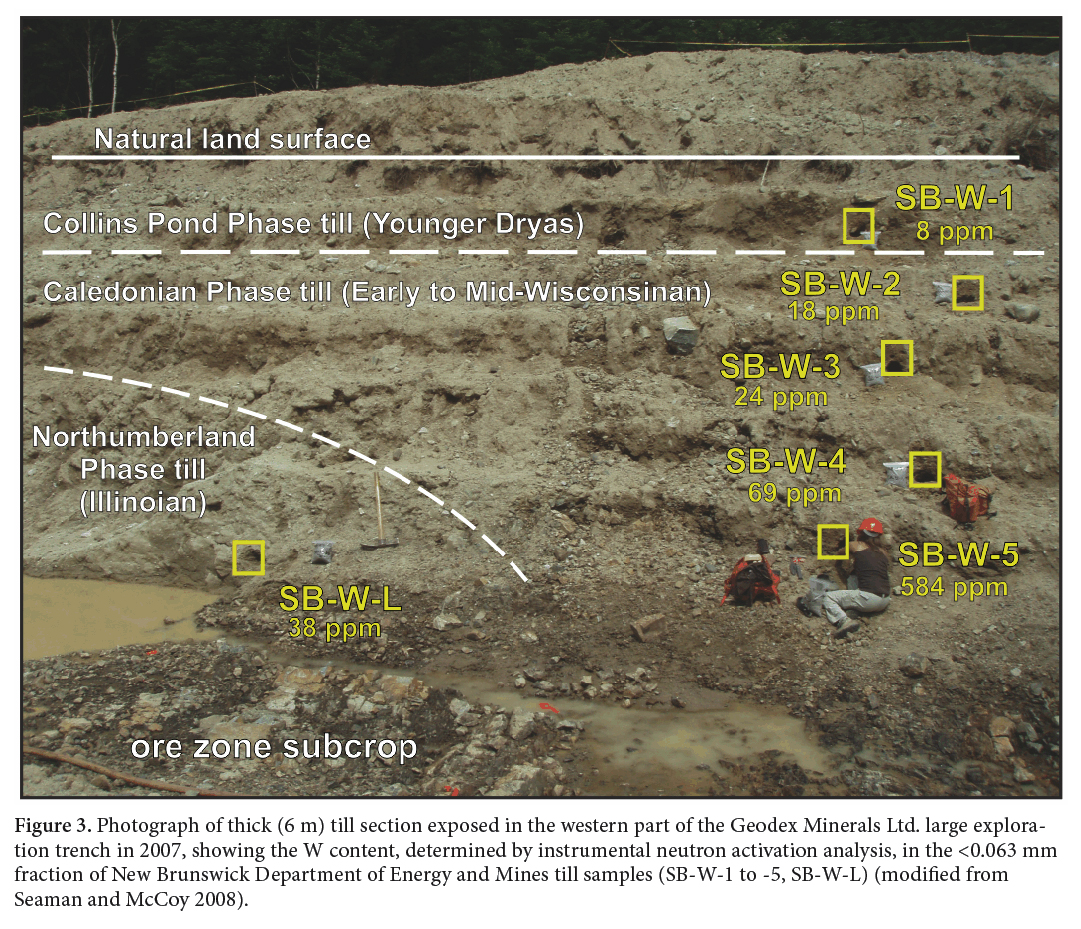
8 The Sisson deposit is a large, structurally controlled, intrusion-related W-Mo deposit consisting of four wide and steeply dipping zones of vein- and fracture-controlled W and Mo mineralization that straddle the strongly sheared contact of the Howard Peak Granodiorite (Fig. 2). The geology of the local area and deposit are summarized below from Nast and Williams-Jones (1991), Marr (2009), and Rennie et al. (2013). Zone III (scheelite/molybdenite) and the adjacent Zones I and II (chalcopyrite, wolframite) of the Sisson deposit were discovered by Texasgulf Sulphur/Kidd Creek Mines Ltd. between 1978 and 1982 through geophysical surveys, trenching, soil sampling, and drilling (Snow and Coker 1987; Marr 2009; Rennie et al. 2013). The property was further explored by various operators between 1997 and 2004. In 2007, a large exploration trench was excavated to expose the bedrock surface of Zone III (Fig. 3) and in 2008 the Ellipse Zone was discovered (Fig. 4).
 Display large image of Figure 3
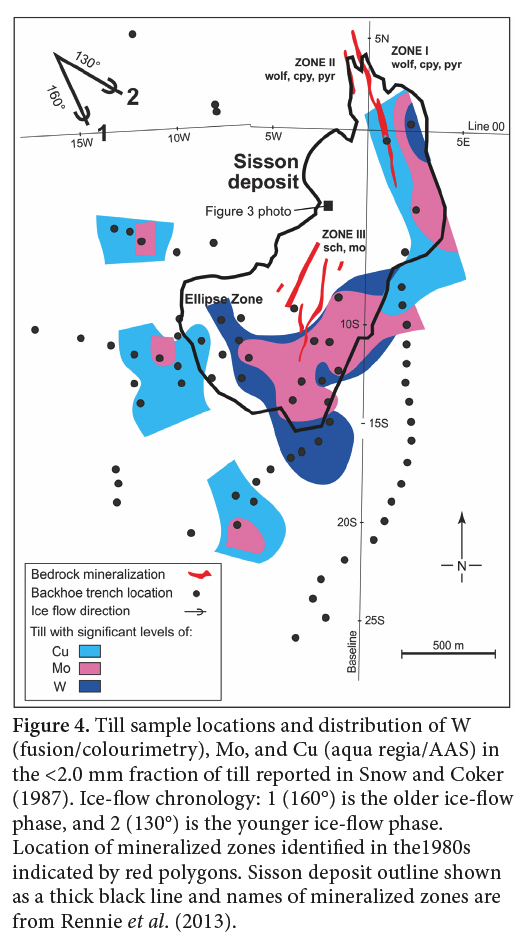 Display large image of Figure 4
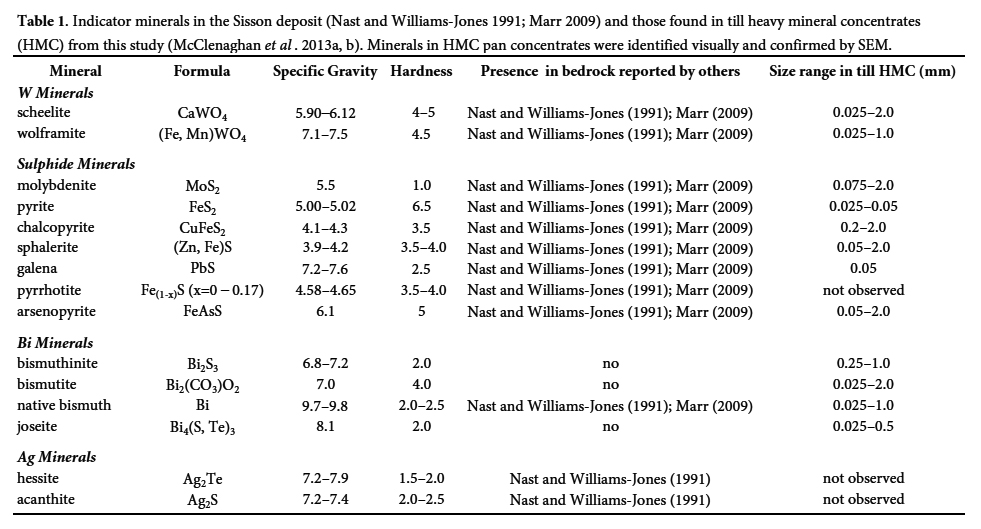
9 Mineralization is likely related to the presence of a buried granitic stock at depth, which was the heat source for a hydrothermal system and metals. Zones I, II, and III strike roughly north-south and the Ellipse Zone strikes northwest-southeast (Fig. 4). The zones merge at depth and are part of a much larger hydrothermal mineralizing system with an area of at least 9 km2. Mineralization in all four zones subcrops at the till-bedrock interface and is open at depth. Zone III and the Ellipse Zone are the largest and best explored parts of the deposit and contain molybdenite and scheelite in sheeted quartz veins and stockworks. The deposit has elevated concentrations of Cu, Zn, Pb, Bi, and As that are directly related to late quartz-scheelite and sulphide-rich veins and their sericite-sulphide envelopes. Rennie et al. (2013) reported resource estimates for the deposit of 383 Mt at 0.069% WO3 and 0.023% Mo (proven) and 178 Mt at 0.065 WO3 and 0.020% Mo (probable), making it one of the largest tungsten deposits in the world. Ore minerals in the deposit consist of scheelite, minor wolframite, and molybdenite. Other sulphide, oxide and telluride minerals present are listed in Table 1.
 Display large image of Table 1
Surficial Geology
10 Bedrock outcrops on the Sisson property and in the surrounding area are rare due to the locally thick and continuous cover of till. Till thickness varies from <2 m to 20 m over the deposit, and is on average ~8 m thick over Zone III (Marr 2009). The deposit area is overlain by one to three till units which have been described in detail by Seaman and McCoy (2008) and Fyffe et al. (2010), largely from a section exposed in the large exploration trench (Fig.3, location shown in Fig. 4). The stratigraphic interpretation of the tills overlying the deposit was subsequently revised by Seaman (2009), Seaman et al. (2011), and Stea et al. (2011). The lowermost and oldest till is exposed at the base of a section in the western end of the large exploration trench excavated in 2007. It is an Illinoian clay-rich (25% clay in matrix) basal lodgement till (Fig. 3) deposited during the Northumberland Phase by an east-southeast-flowing ice sheet. Elsewhere in the trench, the bedrock surface and/or the oldest till are overlain by a younger sandier Early Wisconsinan lodgement till (Fig. 3) likely deposited by southeast glacial flow during the Caledonia Phase, and possibly reworked by south-southwest glacial flow during the Middle to Late Wisconsinan (Escuminac Phase). This Early Wisconsinan till is blanketed discontinuously by 0.2 to 2.5 m of Younger Dryas (Collins Pond Phase) till (Fig. 3), formed during a brief cold period at the very end of the Late Wisconsinan that saw the reactivation or regrowth of glaciers. This Younger Dryas till was deposited discontinuously over the area by westward-flowing ice and has a loose, sandy matrix (57–80% sand) that is texturally similar to the underlying Caledonia Phase (Early Wisconsinan) lodgement till. This Younger Dryas till formed, in part, by reworking of Late Wisconsinan glaciofluvial and glaciolacustrine sediments including datable organic material (Seaman and McCoy 2008).
Previous Till Geochemical Surveys in the Sisson Area
11 In 1982–1983, a till geochemical study of the Sisson deposit area was carried out by Kidd Creek Mines Ltd. Snow and Coker (1987) determined that ice flowing southeast and east-southeast crossed the deposit area. They sampled surface till overlying and up to 8 km down ice (southeast) of the deposit and identified W, Mo, Cu, As, and F as the key pathfinder elements (Fig. 4) in the heavy mineral (specific gravity = 3.3) and <2.0 mm whole till fractions. The highest contents for W, Mo, and Cu were reported to be 1400, 2020, and 260 ppm, respectively, for the <2.0 mm whole till fraction. The areas they identified as metal-rich till correspond to the area overlying and immediately down ice (southeast) of what is now defined as the Sisson deposit by Rennie et al. (2013) (Fig. 4).
12 As part of a regional till geochemical survey of central New Brunswick, Lamothe (1992) collected till samples in the vicinity of the Sisson and Burnt Hill W deposits. He reported a 10 km-long glacial dispersal train trending southeast from the Sisson deposit in the <0.002 mm fraction of till that was best defined by W, but also by Cu, Pb, Zn, and Mo.
13 More recently, surface till (Early Wisconsin sandy till) sampling at one sample per 2 km2 has been carried out in the region by the NBDEM (Seaman 2001, 2002, 2007) (Fig. 5). In addition, Seaman (2003) and Seaman and McCoy (2008) collected till samples at a more detailed scale in the area immediately surrounding the Sisson deposit and from the large exploration trench excavated to expose the bedrock surface of the deposit in 2007 (Fig. 3). They identified elevated concentrations of W, As, Bi, Cd, Cs, Cu, In, Mo, Sn, and Zn in the <0.063 mm fraction of till overlying the deposit (i.e., Fig. 3) and in a long glacial dispersal train trending SE (135°) (Fig. 5). For the first few kilometres, the dispersal train trends southward, which was interpreted to be caused by the presence of the 100 m-high south-south- west-trending Nashwaak Ridge (Fig. 5). The glacial dispersal train, best defined by Bi content in till, is 2 to 4 km wide, and extends at least 43 km southeast of the Sisson deposit. The train is discontinuous in places due to local reworking during subsequent Late Wisconsinan glacial phases.
 Display large image of Figure 5
METHODS
Till Sampling
14 Because previous NBDEM till surveys had identified a multi-element SE-trending dispersal train from the Sisson deposit, till sampling for this study was focused immediately up ice, overlying, and up to 14 km down ice (southeast) of the deposit (Fig. 2). A total of 75 till samples were collected using established GSC till sampling protocols (Spirito et al. 2011; McClenaghan et al. 2013a–d). In addition to the new samples collected, 39 archived samples from the previous NBDEM regional till sampling survey (Fig. 2) were re-analyzed with the new samples to provide some regional context for interpreting data for samples proximal to the deposit. The new till sampling involved the collection of surface till samples at key distances down ice for indicator mineral and till geochemical studies. Till sampled in this study is likely Early Wisconsinan lodgement till deposited by southeastward ice flow during the Caledonia Phase (Seaman 2009). The overlying very thin (≤0.2 m) sandy (60–80% sand) till, which is present at surface in places and suspected as being Younger Dryas till, was not sampled in this study because of its discontinuous nature, low silt content (i.e., a poor candidate for matrix till geochemistry), westward transport direction, and likely ablation derivation. Till samples were collected at an average depth of 1.5 m from freshly dug trenches that had been excavated for sump drainage pits for diamond drill holes, and from road cuts, hand-dug holes, and diamond drill core. Till samples were mostly weakly oxidized C-horizon material. Till sample locations, site descriptions, photographs, and sample depth information are reported in McClenaghan et al. (2013a). At each site, a 3 kg till sample was collected for geochemical analysis of the till matrix, textural determinations, and archiving. A second 200 g till sample was collected in a small disposable plastic lunch bag and was tested in the field while slightly moist. Measurements were taken through the sample bag using a portable bench top Innov-x 5000 XRF to provide preliminary information on the content of W, Sn, Cu, Mo, Bi, and As and to guide till sampling. Three till sites were sampled as duplicates to assess field variability.
Sample Processing and Analysis
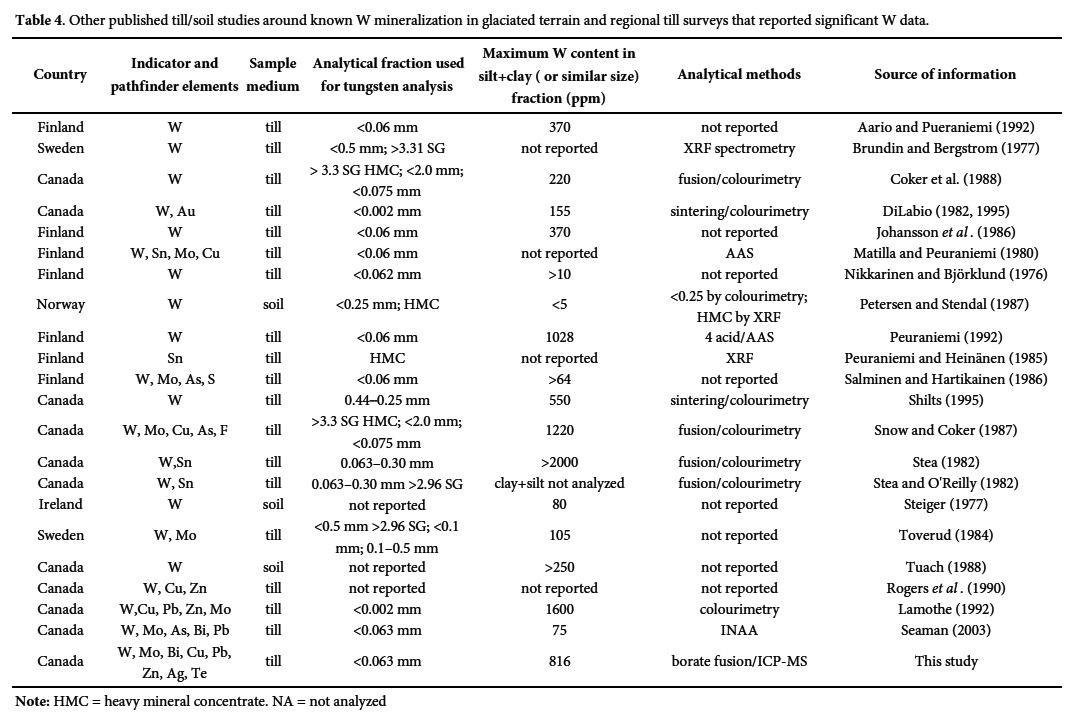
15 Till samples were prepared at GSC Ottawa to recover the <0.063 mm fraction using procedures outlined in Spirito et al. (2011) and McClenaghan et al. (2013b, d). The <0.063 mm fraction was chemically analyzed at a commercial laboratory using 1:1 aqua regia/ICP-MS on 0.5 g, and lithium metaborate/tetraborate fusion followed by nitric acid digestion/ICP-ES, -MS on 0.2 g. Because of the lower and variable recovery of W and Sn by aqua regia digestion (McClenaghan et al. 2013b), only the total W and Sn values determined by lithium meta/tetraborate fusion/ICP-MS are described and plotted here. Three blind duplicates were prepared during sample processing, one from each till field duplicate to monitor analytical precision. CANMET certified reference standards TILL-1, TILL-2, and TILL-4 (Lynch 1996) were inserted into the batch prior to analysis to monitor analytical accuracy. Three silicic acid (silica sand) blanks were sieved at GSC and analyzed as part of the sample batch to monitor cross contamination between metal-rich samples during sample preparation. Geochemical data listings for till samples as well as for blind duplicates, standards, and blanks are reported in McClenaghan et al. (2013b).
16 The <0.063 mm fraction of till was analyzed in this study to evaluate if this commonly used size fraction (e.g., Pronk and Burton 1988; Batterson 1989; Lestinen et al. 1991; Koljonen 1992; Friske et al. 2001; McClenaghan et al. 2011) is suitable for W-Mo exploration in the region. To provide the regional context in which to interpret the new till geochemical data for the Sisson area, the archived <0.063 mm fraction of 39 till samples (Fig. 2), previously analyzed by NBDEM as part of their regional surveys, were sent to GSC Ottawa. These samples were analyzed as part of the GSC analytical batch in 2011 and data are reported in McClenaghan et al. (2013b).
RESULTS
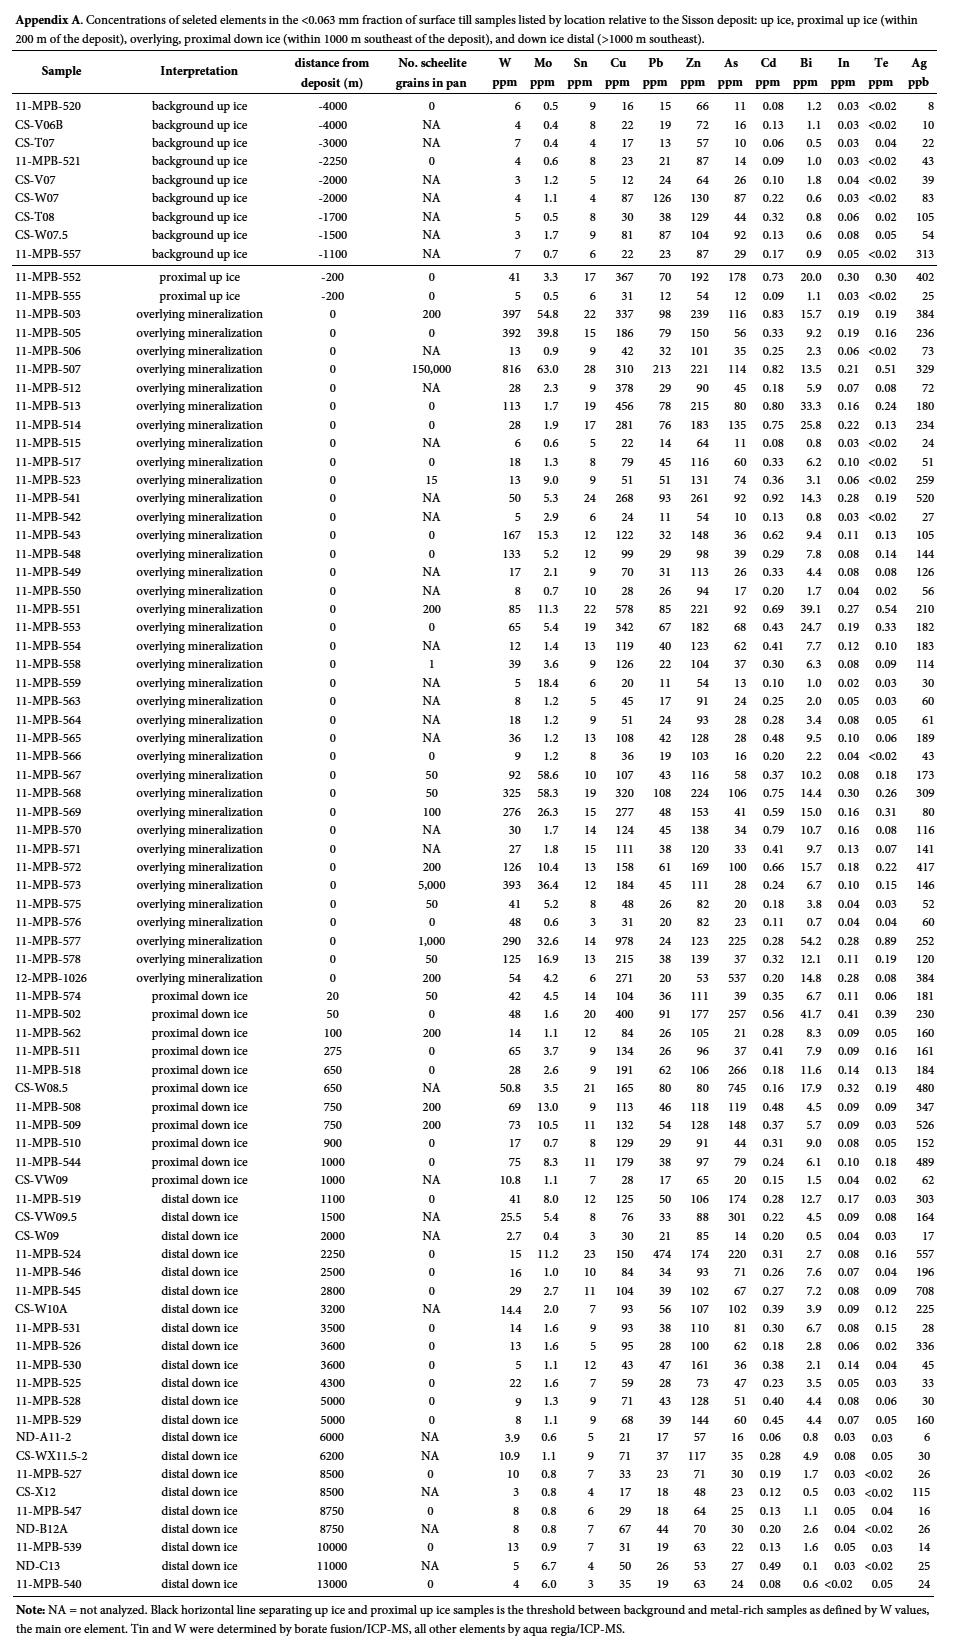
17 Geochemical data for all samples analyzed in this study are reported in McClenaghan et al. (2013b). Appendix A lists a subset of these data that includes only surface till samples within or proximal to the southeast-trending glacial dispersal train defined by Seaman (2003). In this table, data are listed according to location relative to the Sisson deposit: up ice, proximal up ice (within 200 m of the deposit), overlying, proximal down ice (within 1000 m of the deposit), and down ice distal (>1000 m down ice). This table was used to establish the thresholds between background values in till and those in metal-rich till samples overlying and down ice of the deposit. Samples listed above the thick black horizontal line are considered to be background.
Tungsten and tin in the <0.063 mm fraction of till
18 Background W contents in till up ice (Appendix A) range from 3 to 7 ppm. The highest W values (113 to 816 ppm) occur in till overlying the Sisson deposit. Slightly elevated values, between 11 and 41 ppm W, occur consistently in till as far as 5 km down ice (southeast) of the deposit and in one isolated sample 11 km to the southeast, on the south side of the Nashwaak River (Fig. 6). At the deposit scale, W content in till is highest: (1) over the north end of the deposit where mineralized bedrock is closest to surface (<2 to 4 m depth) (133 to 290 ppm), and (2) on the eastern side of the deposit (126 to 816 ppm) just down ice (southeast) of areas where bedrock is close to surface (Fig. 7). Tungsten values display a strong (r>0.8) positive correlation with Bi and moderate (r=0.6–0.8) correlations with Mo, Cu, Zn, Ag, Cd, Te, and In (Table 2).
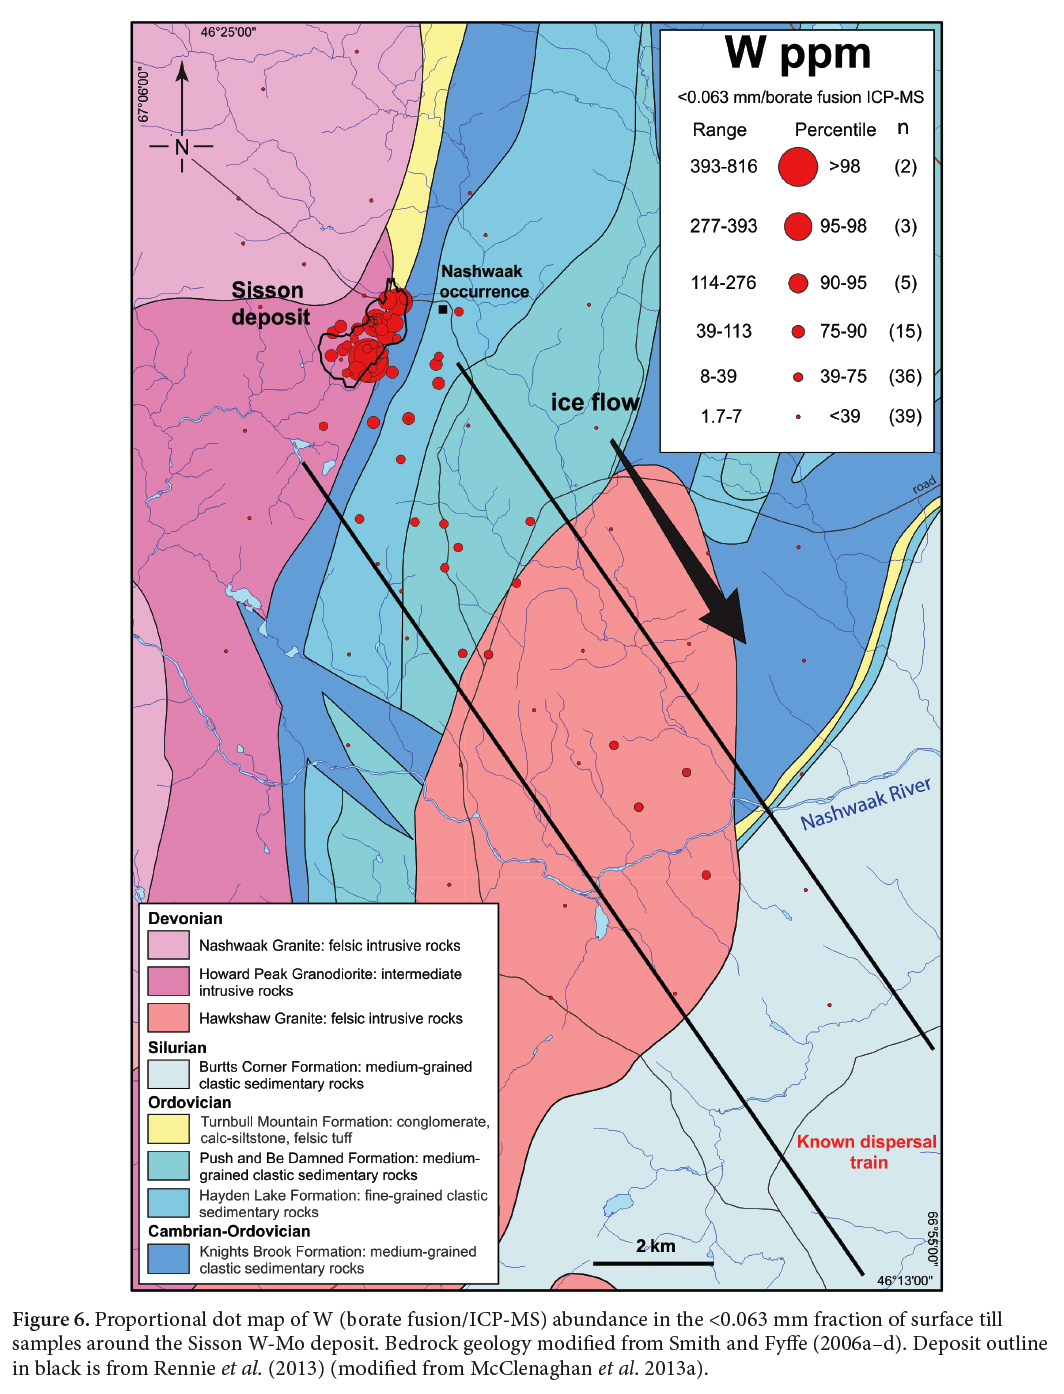 Display large image of Figure 6
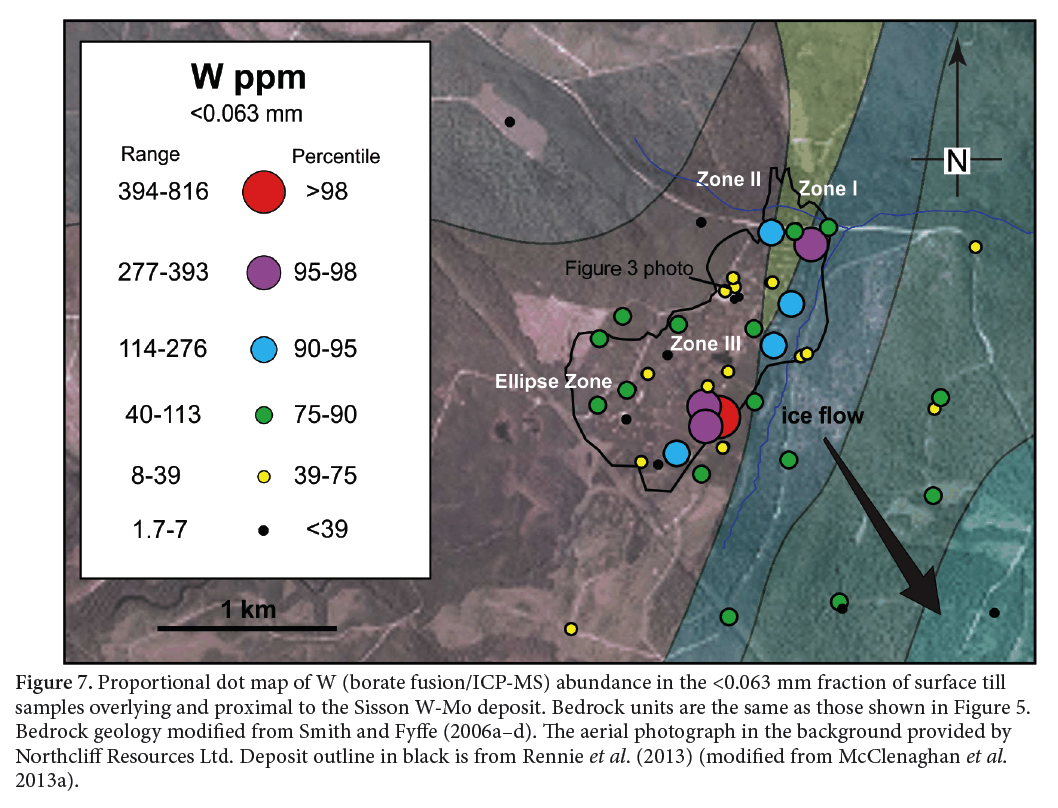 Display large image of Figure 7
19 Tin contents in till in the Sisson area range from 3 to 28 ppm. Background values in till up ice (northwest) range from 4 to 9 ppm Sn (Appendix A). The highest values occur in till overlying and immediately down ice of the deposit. Slightly elevated Sn values of 9 to 21 ppm trend southeast for 6 km from the deposit, suggesting glacial dispersal in this direction. Tin displays strong (r>0.8) positive correlations with Bi and In, and moderate (r=0.6–0.8) correlations with W, Cu, Pb, Zn, Ag, As, Cd, and Te (Table 2).
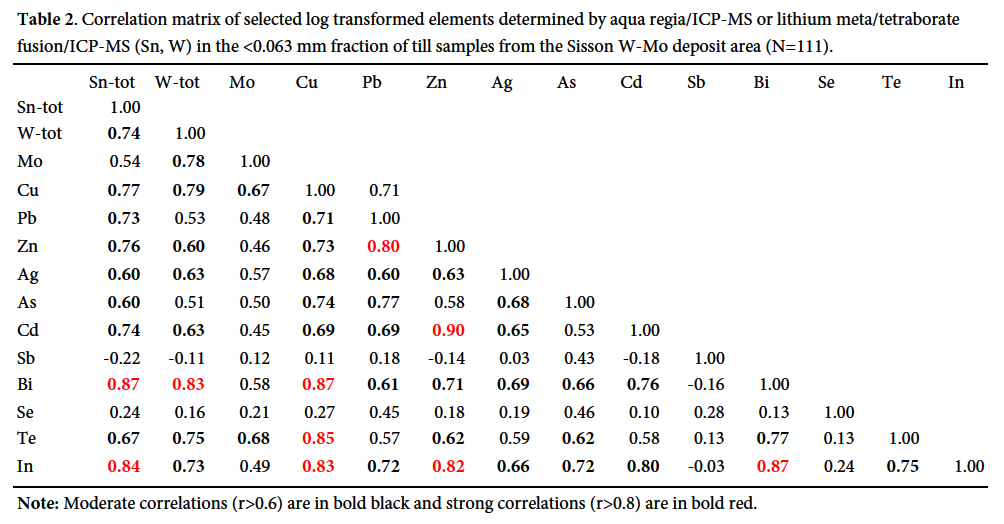 Display large image of Table 2Note: Moderate correlations (r>0.6) are in
bold black and strong correlations (r>0.8) are in bold red.
Display large image of Table 2Note: Moderate correlations (r>0.6) are in
bold black and strong correlations (r>0.8) are in bold red.
Molybdenum, copper, and bismuth in the <0.063 mm fraction of till
20 Molybdenum values in till in the Sisson area range from 0.4 to 63 ppm (Appendix A). The highest values (10 to 63 ppm) occur in till overlying and immediately down ice of the deposit (Fig. 8). Background values up ice range from 0.4 to 1.7 ppm (Appendix A). Slightly elevated values, between 1.7 and 13.3 ppm, occur in till 3 km down ice (southeast) but also were found in till overlying Cambrian-Ordovician and Ordovician metasedimentary rocks of the Tetagouche Group southeast to northeast of the deposit, including in the area of the Nashwaak occurrence. Two elevated values, 6.7 and 6.0 ppm Mo, occur in till 11 and 13 km southeast of the Sisson deposit, on the south side of the Nashwaak River. Molybdenum displays moderate (r=0.6–0.8) correlations with W, Cu, and Te (Table 2).
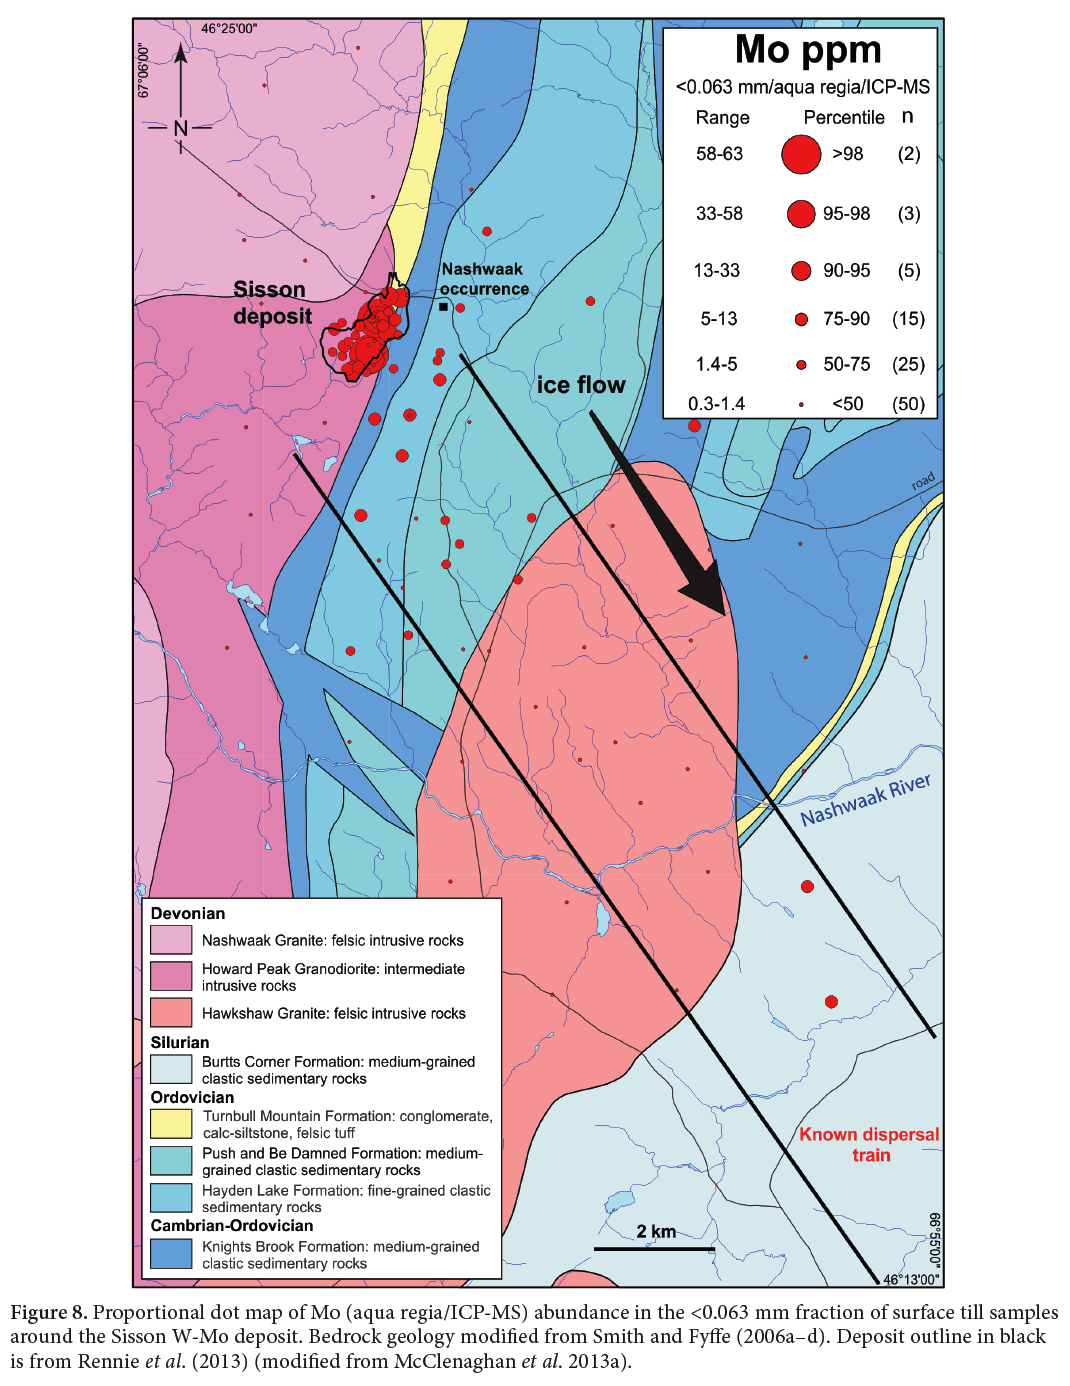 Display large image of Figure 8
21 Copper concentrations in till around the Sisson deposit range between 12 and 978 ppm and background values up ice (northwest) are between 12 and 87 ppm (Appendix A). The highest values in till overlie the deposit (310 to 978 ppm). Slightly elevated values, between 87 and 282 ppm, occur in till trending 4 km southeast from the deposit as well as northeast where it overlies Tetagouche Group rocks. Copper displays strong (r>0.8) positive correlation with Bi, Te, and In, and moderate (r=0.6–0.8) correlations with W, Sn, Mo, Pb, Zn, Ag, As, and Cd (Table 2).
22 Background contents of Bi in till up ice are between 0.5 and 1.2 ppm (Appendix A). The highest values (5.9 to 54.2 ppm) occur in till overlying the deposit. Slightly elevated Bi values, between 2.8 and 7.6 ppm, are found as far as 8 km southeast from the deposit. Bismuth displays strong (r>0.8) positive correlation with W, Sn, Cu and In, and moderate (r=0.6–0.8) correlations with Te, Pb, Zn, Ag, As, and Cd (Table 2).
Arsenic, zinc, and cadmium in the <0.063 mm fraction of till
23 Arsenic concentrations in till in the study area range from 10 to 745 ppm. Background values vary between 10 and 92 ppm (Appendix A). The highest values occur in till that overlies the deposit (225 to 537 ppm) or Tetagouche Group sedimentary rocks one km southeast of the deposit (257 to 745 ppm). Slightly elevated As values up to 119 ppm occur up to 8 km southeast from the deposit, as well as northeast overlying Tetagouche Group rocks. Arsenic displays moderate (r=0.6–0.8) correlations with Sn, Cu, Pb, Te, In, and Bi (Table 2).
24 Zinc concentrations in till range from 48 to 261 ppm. Background values in till up ice vary between 64 and 130 ppm (Appendix A). The highest values occur in till over the deposit (239 to 261 ppm) and 2 km southwest of the deposit (247 ppm, sample CS-T09). Slightly elevated Zn values (98 to 177 ppm) occur in till over Tetagouche Group sedimentary rocks southeast and northeast of the deposit (McClenaghan et al. 2013b). Zinc displays strong (r>0.8) positive correlation with Cd, In, and Pb, and moderate (r=0.6–0.8) correlations with W, Sn, Cu, Ag, Bi, and Te (Table 2).
25 Cadmium concentrations in till range from 0.06 to 1.79 ppm. Background values up ice range between 0.06 and 0.32 ppm (Appendix A). Similar to Zn, till 2 km southwest of the deposit contains the highest contents of Cd (1.79 ppm, sample CS-T09). Other significantly elevated values (0.80 to 0.92 ppm) occur in till over the deposit. Cadmium displays strong (r>0.8) positive correlation with Zn, and moderate (r=0.6–0.8) correlations with W, Sn, Cu, Ag, Pb, Ag, Bi, and In (Table 2).
Silver, lead, indium, and tellurium in the <0.063 mm fraction of till
26 Background Ag contents in till up ice vary between 8 and 313 ppb Ag (Appendix A). The highest Ag contents in till are 2 to 3 km southeast of the deposit (708 ppb; 557 ppb). The Ag content in till overlying the deposit varies between 24 and 520 ppb. Other significantly elevated values (181 to 480 ppb) occur in till over Tetagouche Group sedimentary rocks southeast of the deposit. Silver displays moderate (r=0.6–0.8) correlations with W, Sn, Cu, Pb, Zn, As, Cd, Bi, and In (Table 2).
27 Lead concentrations in till range from 11 to 474 ppm (Fig. 9). Background values up ice range from 23 to 126 ppm (Appendix A). The maximum Pb value of 474 ppm is in till collected 2 km south of the deposit overlying Tetagouche Group rocks. The next highest Pb value is in till over the deposit (213 ppm). Slightly elevated values of Pb in till occur over the deposit as well as over Cambrian and Ordovician sedimentary rocks southeast and northeast of the deposit. Lead displays a strong (r>0.8) positive correlation with Zn and moderate (r=0.6–0.8) correlations with Sn, Cu, Ag, As, Cd, Bi, and In (Table 2).
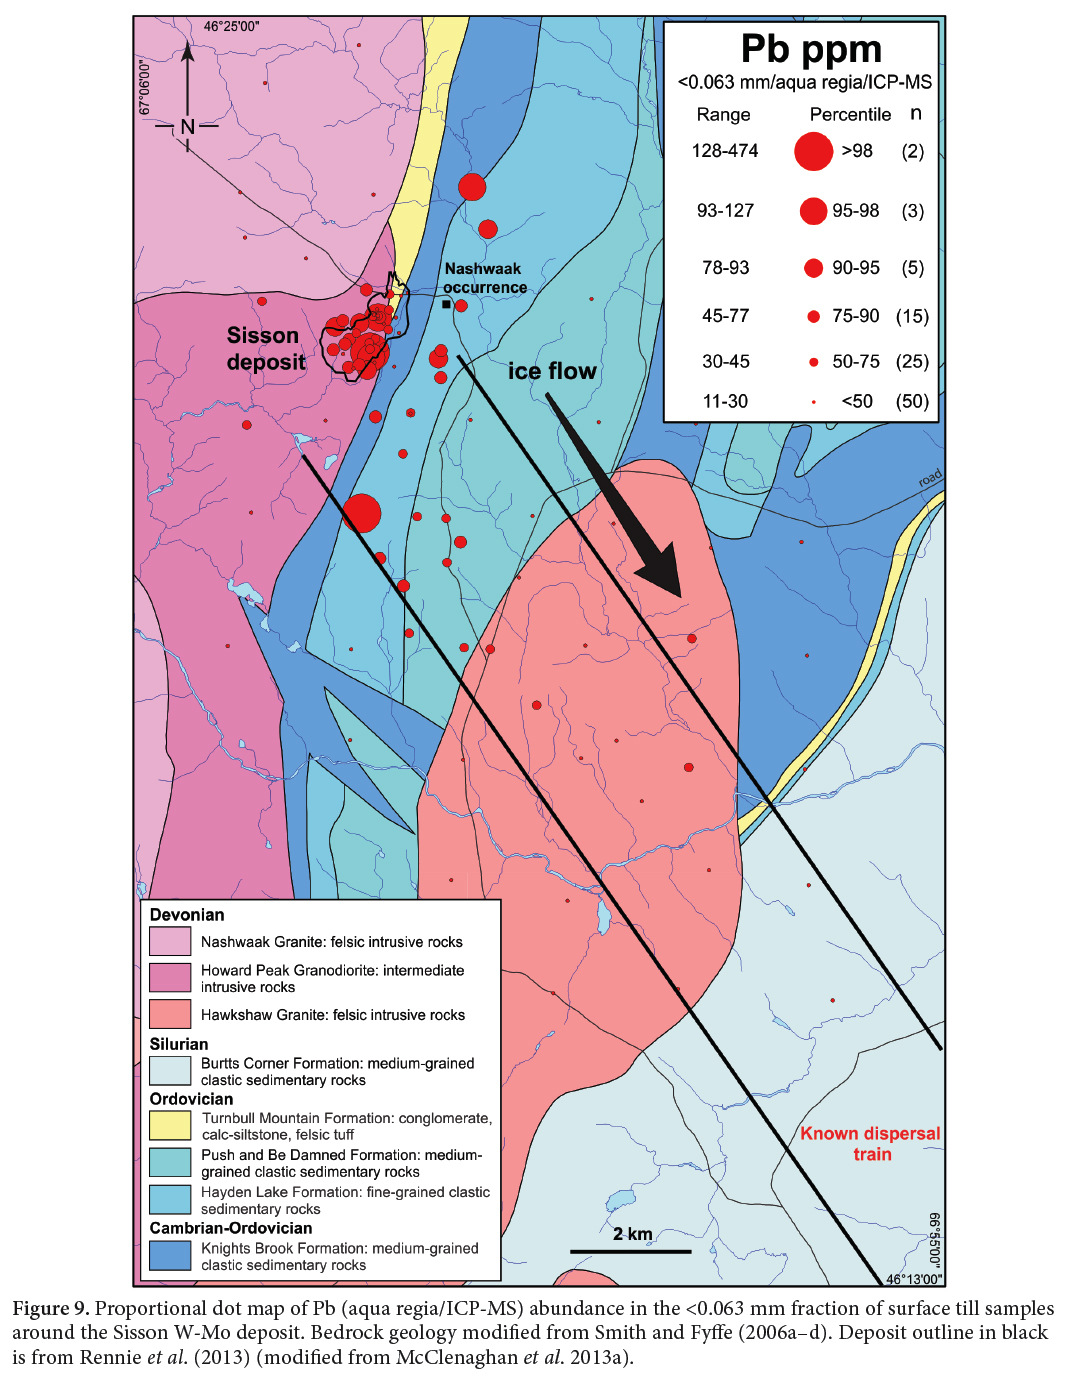 Display large image of Figure 9
28 Indium contents in till vary from <0.02 to 0.41 ppm. Background In values in till up ice range from 0.03 to 0.08 ppm (Appendix A). The highest In value of 0.41 ppm occurs in till overlying the southeast part of the deposit. The second highest In value is in till overlying Ordovician sedimentary rocks, 0.7 km southeast of the deposit (0.32 ppm). Slightly elevated values of In in till (0.08 to 0.28) occur over the deposit as well as over Cambrian and Ordovician sedimentary rocks southeast, east, and northeast of the deposit. Indium displays strong (r>0.8) positive correlations with Sn, Cu, Zn, and Bi, and moderate (r=0.6–0.8) correlations with W, Pb, Ag, As, Cd, and Te (Table 2).
29 Till in the Sisson area contains between <0.02 and 0.89 ppm Te. Background values up ice of the deposit are <0.02 to 0.05 ppm (Appendix A). The highest values of 0.51 to 0.89 ppm are in till directly overlying mineralization. Slightly elevated values of Te (0.05–0.20 ppm) occur in till over the deposit as well as over Cambrian and Ordovician sedimentary rocks southeast and northeast of the deposit. Tellurium displays a strong (r>0.8) positive correlation with Cu, and moderate (r=0.6–0.8) correlations with W, Sn, Mo, Zn, As, In, and Bi (Table 2).
DISCUSSION
Glacial Dispersal Patterns
30 The highest concentrations of W and Mo in the <0.063 mm fraction of till detected in this study overlie the Sisson deposit. Elevated W and Mo values in till form a continuous 3 to 5 km-long southeast-trending dispersal train but are also detected at least 10 km southeast of the deposit. This pattern trending southeast is expected as the till sampling was biased to sites within the first 14 km of the known southeast-trending dispersal train. The W and Mo values for till samples reported in Table 3 offer a guide to metal contents in till versus distance from the deposit.
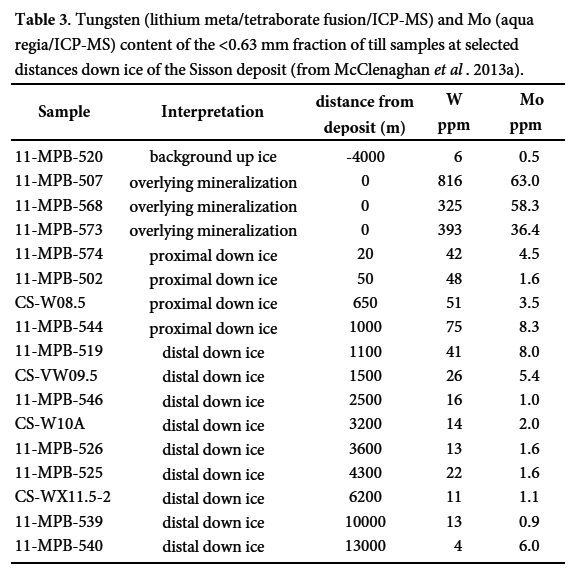 Display large image of Table 3
31 The glacial dispersal patterns for Zn and Cd are different from W and Mo in that values of Zn and Cd are highest over the deposit as well as in one sample that is 2 km southwest of the deposit. Slightly elevated values of 98–128 ppm Zn and 0.25–0.66 ppm Cd overlie Tetagouche Group volcanic and sedimentary rocks northeast and south of the deposit, but not immediately southeast of the deposit where W and Mo values are elevated. Patterns for Pb (Fig. 9), Ag, In, and Te are similar to those for Zn and Cd. The bedrock source of elevated concentrations of Pb, Cu, Te, and to a lesser extent Zn, In, and Ag, in till east and northeast of the deposit may be (1) a more distal expression of the intrusion that formed the Sisson deposit, such as the Nashwaak occurrence, or (2) metal-rich Ordovician Tetagouche Group sedimentary rocks that are unrelated to the intrusion mineralized system. These elevated metal concentrations in till east-northeast of the deposit warrant further investigation to determine their bedrock source.
32 Although the highest Sn values occur in till overlying and immediately down ice of the deposit and form a weak southeast-trending dispersal train, Sn contents in till are relatively low, varying between 3 to 28 ppm. In contrast, Sn content in till overlying the subcropping mineralization of the Mount Pleasant W-Mo-Sn-In deposit 100 km to the south is 150 to 409 ppm (GSC unpublished data). The low Sn content in till at the Sisson deposit is not unexpected as Sn minerals have not been reported in the deposit. Tin is therefore not a pathfinder element for the Sisson deposit.
Source of High Metal Contents in Till
33 The Sisson deposit contains an estimated resource of 383 Mt at 0.069% WO3 (Rennie et al. 2013); thus, it is not unexpected for glacial debris eroded from the deposit to contain significant (100s ppm) W contents (Appendix A). Till samples that contain the highest W contents in the <0.063 mm fraction at the Sisson deposit also contain up to 150,000 scheelite grains/10 kg in the pan concentrate fraction (Appendix A), with most grains between 25 and 200 µm in size (McClenaghan et al. 2013a, c). Only one till sample in this study was found to contain wolframite (McClenaghan et al. 2013a, c). Thus, it is most likely that scheelite is the source of much of the W in till samples in this study. Rennie et al. (2013) reported that the Sisson deposit also has a significant grade of Mo (0.023%), which is hosted in molybdenite and Mo-rich scheelite (molybdo-scheelite). These two minerals are the likely sources of the 10s ppm Mo in till overlying the deposit and down ice.
34 The Sisson deposit contains significant chalcopyrite, as do till samples overlying and down ice of the deposit (McClenaghan et al. 2013a, c), thus, chalcopyrite is the likely source of elevated Cu in metal-rich till around the Sisson deposit. Elevated Bi content in till (10s of ppm) is likely hosted in the Bi-rich minerals native bismuth (Bi), bismuthinite (Bi2S3), bismutite (Bi2(CO3)O2), and joseite (Bi4(S,Te)3) that were recovered from the heavy mineral fraction of metal-rich till samples overlying and up to 4 km down ice (southeast) of the deposit (McClenaghan et al. 2013a, c). Sphalerite is a minor mineral in the deposit, and is likely the source of elevated Zn (100s of ppm), as well as Cd and In in till overlying the deposit. Cadmium and In are known to occur in sphalerite (Cook et al. 2009; Pfaff et al. 2011). The source of elevated Pb (100–400 ppm) contents in till is likely galena, which was observed in the mineralized zones by Nast and Williams-Jones (1991). Silver-bearing minerals in the deposit include hessite (Ag2Te) and acanthite (Ag2S) (Nast and Williams-Jones 1991) and these minerals may be the source of elevated Ag in till overlying the deposit. Arsenopyrite was recovered from the heavy mineral fraction of metal-rich till in this study (McClenaghan et al. 2013a, c) and is the most likely source of the highest As values in till. Elevated values of Te in till over the deposit are likely related to the presence of the Te-bearing minerals hessite and joseite (Table 1) in the mineralization. The source of the low levels of Sn (10s of ppm) in the till could be rare cassiterite grains in the mineralization, though no cassiterite or any other Sn-bearing minerals have been seen in the Sisson deposit rocks used in this study or in any other studies of the deposit.
Indicator and Pathfinder Elements
35 The term ‘indicator element’ is used here to refer to an element that is an economically valuable component of the ore being sought and which may be used to detect an orebody (Rose et al. 1979). The results reported here indicate that W is the optimal indicator element for the Sisson deposit. Molybdenum is also an indicator, but to a much lesser extent. The term ‘pathfinder element’ is used here to refer to non-ore elements associated with the orebody that may be used to detect the orebody (Rose et al. 1979). Pathfinder elements in till overlying and down ice of the Sisson deposit include Cu, Zn, Pb, Ag, Bi, In, As, Cd, Zn, and Te. This list of elements is more extensive than the list of elements (W, Mo, Cu, As, and F) that Snow and Coker (1987) and Lamothe (1992) identified as key indicator/pathfinder elements in their earlier till geochemical study of the Sisson deposit. The Sisson indicator/pathfinder element suite identified in this study is also more extensive than those identified in other published studies around W mineralization (Table 4), which variably include Mo, Sn, As, Cu, Bi, and Pb (e.g., Matilla and Peuraniemi 1980; Tuach 1988; Rogers et al. 1990; Peuraniemi 1992). The extensive suite of indicator/pathfinder elements identified at Sisson reflects, in part, the polymetallic nature of the deposit as well as the ability of modern ICP-MS techniques to determine a broader suite of elements at lower detection limits.
 Display large image of Table 4Note: HMC = heavy mineral concentrate. NA = not
analyzed
Display large image of Table 4Note: HMC = heavy mineral concentrate. NA = not
analyzed
Comparison of Tungsten Content of Till to Other Studies and Deposits
36 The highest W value reported for <0.063 mm till fraction in this study is 816 ppm. This value is slightly lower than the maximum value of 1200 ppm reported for the <0.075 mm till fraction at the Sisson deposit by Snow and Coker (1987). Seaman and McCoy (2008) report a similar maximum (1240 ppm) for one till sample they collected from the 2007 exploration trench. Other till/soil studies around known W mineralization in glaciated terrain and regional till surveys that reported significant W data are compared in Table 4. The values in this table indicate that significant W values in till around W mineralization can vary from a few 100 ppm to 2000 ppm.
Till Size Fractions and Analytical Methods
37 Some of the earliest till geochemical studies around W mineralization analyzed the heavy mineral fraction of till to determine its W content because scheelite is a heavy mineral and would be concentrated in this fraction if present in the till (Toverud 1984; Peuraniemi and Heinänen1985; Petersen and Stendal 1987; Coker et al. 1988; Snow and Coker 1987). Some early studies also used the <0.063 mm fraction (Table 4) to successfully detect or model glacial dispersal of W-rich debris from mineralization (e.g., Nikkarinen and Björklund 1976; Johansson et al. 1986; Salminen and Hartikainen 1986; Petersen and Stendal 1987; Peuraniemi 1992). The <0.063 mm fraction of till was analyzed in this study to evaluate if this commonly used size fraction (e.g., Pronk and Burton 1988; Batterson 1989; Lestinen et al. 1991; Koljonen 1992; Friske et al. 2001; McClenaghan et al. 2011) is suitable for W-Mo exploration in the region and to allow for comparison with the previous NBDEM regional till surveys in the Sisson area. The results presented here, combined with earlier results reported by Seaman (2003, 2012), confirm that the <0.063 mm fraction of till reflects dispersal up to 40+ km down ice (southeast) of the Sisson deposit and is suitable for W-Mo exploration in the Sisson region.
38 Most published reports describing the use of till geochemistry for W exploration were published between the 1970s and early 1990s. In these studies, samples were analyzed using X-ray fluorescence spectrometry or a combination of a fusion or sintering digestion followed by measurement by colourimetry (e.g., Snow and Coker 1987; Petersen and Stendal 1987; Coker et al. 1988; Lamothe 1992). Lestinen et al. (1991) determined W contents using a 10 M HCl leach and measurement by spectrophotometer. These older methods were highly specialized, required a separate and unique method just to determine W, and added to the cost of routine analytical methods used for other elements. Analytical methods for W have improved significantly in the past 30 years. With the development of ICP-MS techniques and improvements in lower detection limits for ICP-MS and instrumental neutron activation analysis (INAA) over the past 20 years, the determination of the W content in till is now routine and inexpensive. An analytical technique that reports the total content of W is necessary for till analysis because aqua regia does not fully digest W-bearing oxides. In this study, lithium tetra/metaborate fusion followed by nitric digestion/ICP-MS was used to determine the total W content of till samples. The other indicator and pathfinder elements listed above were determined by aqua regia digestion as they occur in sulphide and telluride minerals (Table 1) that are more easily digested by aqua regia.
CONCLUSIONS
39 This till geochemical study is the first detailed study around a major W deposit in glaciated terrain. Combined with the earlier work of Snow and Coker (1987), Lamothe (1992) and NBDEM (Seaman 2002, 2003; Seaman and McCoy 2008) around the Sisson W-Mo deposit, they define glacial dispersal of W pathfinder elements at least 40 km down ice to the southeast. The W and Mo values for the <0.063 mm fraction of till samples reported in Table 3 offer a guide to metal contents that might be expected versus distance from a W-mineralized source. In general, W and Mo contents in till decrease with increasing distance down ice of the deposit, as has been noted by Shilts (1996), DiLabio (1990) and many others for glacial ice dispersal from specific bedrock sources. Overlying the deposit, metal-rich till contains up to 816 ppm W and 63 ppm Mo, while at 1 km down ice till contains up to 75 ppm W and 8 ppm Mo. Till in background areas contains 3–7 ppm W and 0.4–1.7 ppm Mo.
40 Indicator elements for this type of W-Mo deposit are the main ore elements W and Mo. Pathfinder elements identified in this study include Ag, As, Bi, Cd, Cu, In, Pb, Te, and Zn; a list more extensive than Cu, As, and F identified by Snow and Coker (1987), and more extensive than those identified in other published studies around W mineralization. The extensive suite of indicator + pathfinder elements identified at Sisson reflects the polymetallic nature of the deposit and the broader suite of elements that is now available using modern ICP-MS techniques. A total digestion method is required to determine the total concentration of W in till, either lithium tetra/metaborate fusion followed by nitric digestion/ICP-MS or instrumental neutron activation analysis (INAA). Aqua regia/ICP-MS is a suitable method for determining the other elements. Glacial dispersal of W and Mo from the Sisson deposit is detectable using regional-scale surface till sampling at least 10 km down ice (southeast). The 2 km sample spacing, used by the NBDEM for its regional till sampling program, is sufficiently dense to detect the W dispersal train from the Sisson deposit as well as its polymetallic nature. This study also identified an area of elevated metal content in till east of the Sisson deposit overlying Ordovician rocks of the Tetagouche Group that warrants further investigation. The bedrock source of the elevated metal contents may be related to the Nashwaak polymetallic occurrence 900 m east of the Sisson deposit, or other unknown metal-rich rocks in the area.
APPENDIX
 Display large image of Table 5Note: NA = not analyzed. Black horizontal line
separating up ice and proximal up ice samples is the threshold between background and
metal-rich samples as defined by W values, the main ore element. Tin and W were determined by
borate fusion/ICP-MS, all other elements by aqua regia/ICP-MS.
Display large image of Table 5Note: NA = not analyzed. Black horizontal line
separating up ice and proximal up ice samples is the threshold between background and
metal-rich samples as defined by W values, the main ore element. Tin and W were determined by
borate fusion/ICP-MS, all other elements by aqua regia/ICP-MS.
The Sisson deposit case study was conducted as part of the Geological Survey of Canada’s Targeted Geoscience Initiative 4 (TGI-4). This study is a collaborative research effort between the Geological Survey of Canada and the New Brunswick Department of Energy and Mines. Rob Duncan, Kandi Gallagher, Will Gilmore, Jim Lang, Megan Little, Charlie Morrisey, Drew Takahashi, and Alexandra Shaw of HDI and Northcliff Resources Limited are thanked for sharing confidential geological information, providing access to the deposit, facilitating field work, and providing bedrock samples. Kathleen Thorne is thanked for discussions of the bedrock and deposit geology. Jessey Rice, Brock University, and Mike Richards, University of New Brunswick, are thanked for their able field assistance. Sarah Hashmi, University of Waterloo, contributed to this study by conducting a literature review of till geochemical studies related to W-Mo glacial dispersal and a preliminary assessment of a small subset of the GSC till geochemical data as part of her B.Sc. thesis. Gwendy Hall (Emeritus Scientist, Geological Survey of Canada) provided guidance on analytical methods. Bill Coker’s early work in the 1980s at the Sisson deposit and his more recent advice (2011) are key factors to the success of the study reported here. This paper is dedicated to Bill’s memory. Journal reveiwers Mike Parsons and Chantel Nixon are thanked for their comments which improved the manuscript. Geological Survey of Canada Contribution No. 20130510.