Articles
Beach Morphological Dynamics at Cocos Bay (Manzanilla), Trinidad
ABSTRACT
Manzanilla beach in Cocos Bay, Trinidad is a barrier beach that protects the freshwater Nariva Swamp from the marine environment of the Atlantic. Manzanilla beach is a very dynamic system owing to the open bay morphology, and exposure to the Atlantic Ocean. This study evaluated the spatial and temporal morphological and sedimentological characteristics, alongside hydrodynamic conditions operating on the beach. It investigates the beach’s response to tidal cycles diurnally, from spring to neap tide, and seasonally. Data from nine sites during the period December 2005 to September 2007 are analyzed. Coastal parameters such as beach profiles, littoral data and sediment samples were obtained using standard geomorphological techniques. Beach volumetric changes that occurred over the tidal cycles are also quantified. Results indicate that wave height and wave energy were good predictors of beach change. The study showed that erosion was linked to rising tide and accretion to falling tide diurnally. Erosion occurred during spring tide conditions and accretion dominated during neap tides. Seasonally more erosion occurred in the winter period (dry season) and beach changes in the summer period (wet season) were controlled by the formation and migration of bars.
RÉSUMÉ
La plage de Manzanilla qui donne sur la baie des Cocos dans l’île de la Trinité est un cordon littoral qui protège le marais d’eau douce de Nariva en faisant écran entre celui-ci et l’environnement marin de l’Atlantique. Le système de la plage de Manzanilla est très dynamique en raison de la morphologie de la baie échancrée et de son exposition à l’océan Atlantique. L’étude évalue les caractéristiques sédimentologiques, morphologiques, spatiales et temporelles de la plage, ainsi que les conditions hydrodynamiques qui y sont à l’œuvre. Elle examine l’effet sur la plage des cycles diurnes et saisonniers des marées, depuis les marées de vives-eaux jusqu’à celles de morteseaux. Les données prélevées à neuf endroits pendant la période allant de décembre 2005 à septembre 2007 sont analysées. Les paramètres côtiers, comme les profils de la plage, les données sur le littoral et les échantillons de sédiments, ont été obtenus au moyen de techniques couramment employées en géomorphologie. Les changements de volume qui sont survenus sur la plage pendant les cycles des marées sont aussi quantifiés. Les résultats révèlent que la hauteur et l’énergie des vagues sont de bons prédicteurs des changements subis par la plage. L’étude a montré que l’érosion est associée à la marée montante et l’accrétion, à la marée diurne descendante. L’érosion est survenue pendant les marées de vives-eaux et l’accrétion se produisait plus souvent durant les marées de morteseaux. Par rapport aux saisons, il y avait plus d’érosion en hiver (saison sèche) et les changements subis par la plage pendant la période estivale (saison des pluies) étaient tributaires de la formation et de la migration des barres.
[Traduit par la redaction]
INTRODUCTION
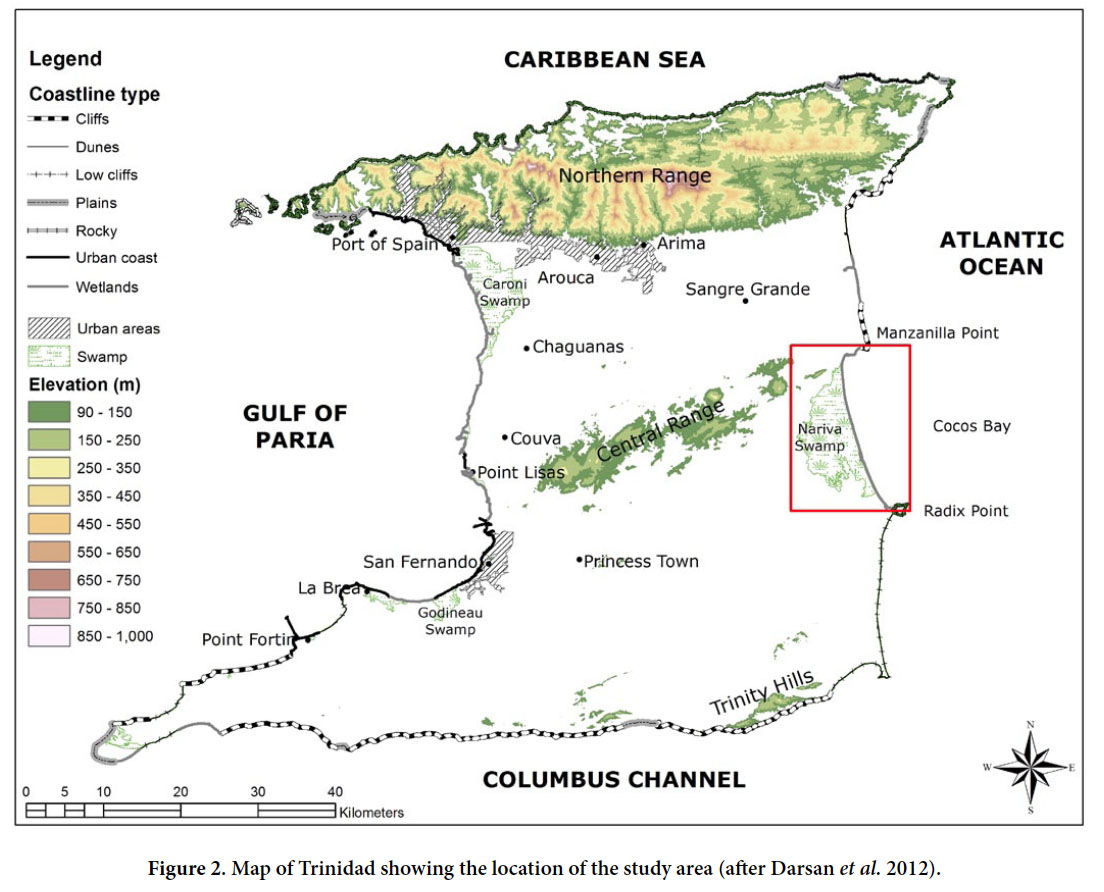
1 Beaches and coastal dunes constitute the most significant accumulations of subaerially exposed sediment along coasts (Short 1999). Several natural forces are responsible for beach profile changes, and these include waves, tides and currents (Johnson 1919; Cambers 1998). While tidal cycles are important in some coastal processes, tidal range is of much greater geomorphic significance because it controls the vertical distance over which waves and currents are effective along the shoreline (Masselink and Short 1993). Tides generate tidal currents which flow landwards as the tide is rising and seawards as the tide is falling. These tidal currents can move beach sand and are particularly important between islands and at river mouths where flow velocities are high (Cambers 1998). In addition to the tidal cycles that occur over the short-term, a study by Gratiot et al. (2008) has demonstrated that the 18.6 year nodal tidal cycle contributes significantly to regional coastal changes. Currents are important because of their role in transporting sediment, and to a smaller extent, erosion. More recently, Thomas et al. (2013a) showed that beach rotation took place over centurial timescales, with sediment exchange between headlands taking less than one year. Thomas et al. (2013b) also demonstrated that medium and short term beach oscillation occurred between offshore islands and an embayed beach.
2 Nearshore processes shape beach morphology (Hardisty 1990), but there is feedback where morphology influences the processes at work in the nearshore (Komar 1976). Beaches and their adjacent nearshore zones act as buffers to wave energy. As a result, they are sensitive to change over various timescales ranging from a few seconds to several years (Carter 1991). Beaches can both adapt their shape very quickly to changes in wave energy, and also dissipate this energy with minor adjustments of the position of each sand or shingle grain (Pethick 2001).
3 The works of Shepard and LaFond (1940), Shepard (1950, 1973), Bascom (1954), Hayes and Boothroyd (1969), and Norcross et al. (2002) on mid-latitude beaches, have all demonstrated that the beach and near-shore exchange sediment on a winter-summer cycle. They demonstrated that the low, flat swell waves during the summer build up the berm, which causes the beach face to prograde seawards forming a steep profile. During the winter period, high steep storm waves erode the beach face and transport the sediment seawards where it is deposited to form a long-shore bar. Cambers (1998) work on Caribbean beaches has also alluded to the existence of this winter-summer cycle. Subsequent research by Short (1979) and Nordstrom (1980) indicates that the terms “winter” and “summer” are somewhat misleading in that beach response is cyclic, as opposed to seasonal. Their work suggests that there may not be a defined seasonal pattern to beach change, but that the beach will go through cycles of erosion or accretion.
4 The morphology of a beach profile is transitory, and rarely attains a static equilibrium form, due to continual variation in littoral zone processes (King 1972). King (1972) recognized two major types of profiles; the “summer and winter” profiles. Other terms used to describe these two profiles are “storm and normal” by Johnson (1949), and “storm and swell” by Komar (1976).
5 The Institute of Marine Affairs (1986, 1998, 2004), Singh (1997) and Darsan (2005), have all conducted research on beaches in Trinidad, in particular on Cocos Bay and Nariva Swamp. Their research has highlighted the severe coastal erosion at work in this bay, and has also alluded to seasonal changes to the beach morphology. However, their research did not account for the causes of the morphological changes, specifically at shorter timescales.
6 The main aims of this paper are to (a) model the effects of tidal cycles on beach dynamics in an open bay, low-latitude tropical trade wind setting; and (b) address the applicability of the “summer and winter” profiles in this type of environment.
STUDY AREA
7 Trinidad and Tobago, the most southerly of the Caribbean islands, is situated between 10° 02' to 10° 50' N latitude and 60° 55' to 61° 56' W longitude (Fig. 1). It is located on the continental shelf of South America and immediately adjacent to the outflow of the Orinoco River, and this determines to a great extent the nature and form of its coastal and marine environment. Trinidad and Tobago has a tropical maritime climate with two distinct seasons; a wet and dry season. The prevailing wind system is the north-east trades, and the dominant wind direction is from the north-east in the dry season (December to May), and from the east in the wet season (May to November).
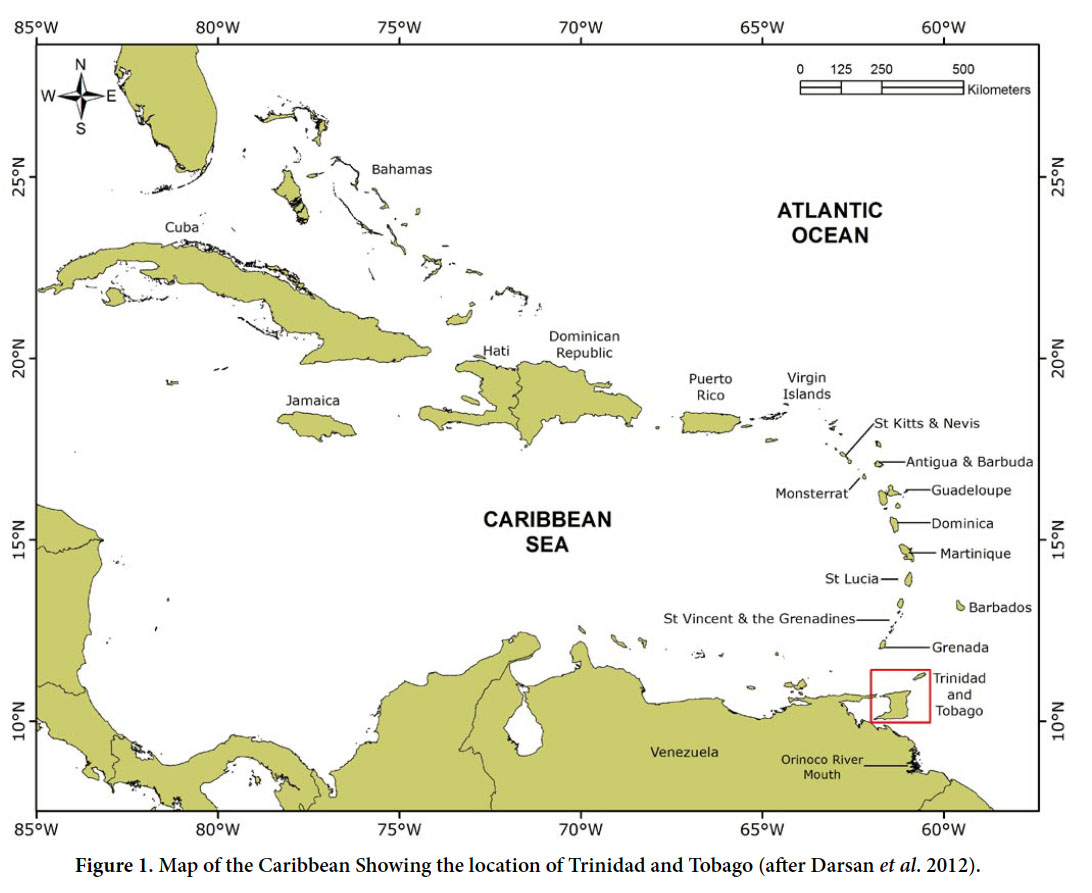 Display large image of Figure 1
8 The dominant ocean current influence in Trinidad and Tobago is the northern branch of the South Equatorial Current, the Guiana Current. As the Guiana Current approaches Trinidad and Tobago it divides into two streams, with the inner stream passing into the Columbus Channel in a predominantly westerly flow and then into the Gulf of Paria, while the outer passes up along the east coast of Trinidad (Hudson 1988) (Fig. 2). Trinidad’s coasts are influenced by the discharge of the Orinoco River, and the Guiana current that flows along the east coast of South America (Andel 1967). The Orinoco discharge subsequent to the rainy season in Venezuela affects the velocity of the Guiana current due to changes in sediment load and density (Kenny 2008); which in turn may have implications for wave energy and sediment budgets along the east coast of Trinidad.
 Display large image of Figure 2
9 The tidal regime experienced is a function of the tide waves from both the Caribbean Sea and the Atlantic Ocean. The tidal regime is semi-diurnal with periods of approximately 12.5 hours. At high spring tides the maximum range is 1.2 m with some slight variation from north to south. At other times, the tidal range is less than one metre, averaging 50 to 60 cm between high and low tides (Kenny 2008).
10 The Northern hemisphere's winter period with associated swell waves is most often experienced in the Caribbean between the months of October to April, and is usually caused by intense mid-latitude storms in the North Atlantic Ocean (Cambers 1998). During the winter months, swells attack the coast from directions varying from northwest to north-east. On the east coast, deepwater wave attack is primarily from north-east to south-east, with an easterly approach being the most significant.
11 The east coast of Trinidad is rugged in its northern section where the rocks of the Northern Range outcrop. Further south the coastline becomes gentler, where in the central regions the Nariva wetlands are found (Bertrand et al. 1992). The east coast of Trinidad is extremely varied with three stretches of low coast separated by prominent headlands. Manzanilla beach is a barrier beach system found in Cocos Bay, embraced by two prominent headlands at Manzanilla Point and Radix Point (Fig. 2). Cocos Bay has been classified as an open sea beach (Georges 1983).
12 The Cocal area includes the Manzanilla beach in Cocos Bay and the Nariva Swamp. The Cocal sand bar known locally as Manzanilla beach, has a relationship with the Nariva Swamp whereby the swamp is protected from the marine environment by the barrier beach. The beach protects the swamp from salt water intrusion, helping to maintain the correct salinity levels that promote life in this wetland ecosystem (Darsan 2005). The characteristics (including the geology and hydro-geology) of the sand bar are not well known having received little attention (Environmental Management Authority 2001). The Cocal sand bar has a fairly low topography with some sections below sea level (Environmental Management Authority 2001).
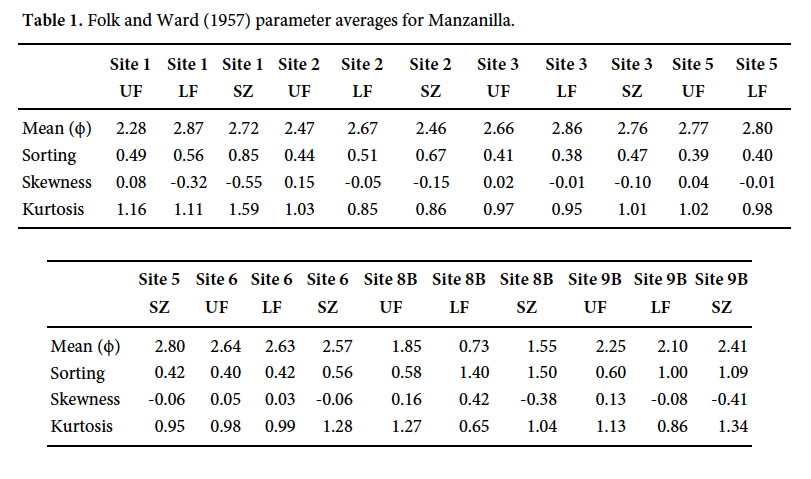
13 The Manzanilla beach at Cocos Bay located along the Manzanilla/Mayaro Main Road, is about 20 km long, and borders the landward edge of the Nariva Swamp. The barrier beach protects the Nariva Swamp and its distinct wetland ecosystem from the marine environment. The back of the barrier beach has not been driven inland with coastal retreat, and as such, sections of the barrier are becoming progressively narrower.
14 There is also significant erosion along several parts of the Manzanilla beach (Singh 1997; Darsan 2005), particularly near the Nariva River mouth; attributable to fresh water outflow and tidal inflow dynamics. The Nariva River also carries large quantities of particulates and nutrients to Cocos Bay which has implications for marine biota and productivity (Bacon et al. 1979). At several points along Manzanilla beach, the sand bar has been eroded from fresh water outflow and sea water inflow; creating points where salt water is able to directly penetrate and alter salinity in the Nariva Swamp (Environmental Management Authority 2001).
METHODS
15 Data were collected on a diurnal, lunar (tidal), monthly and seasonal basis to reveal the changes that occur diurnally, from spring to neap tides, monthly and seasonally from dry season (winter period) to wet season (summer period). In order to address the applicability of the “summer and winter” profiles in this tropical environment, data from the dry season and wet season were analyzed against the corresponding winter and summer seasons experienced in mid-latitude beaches.
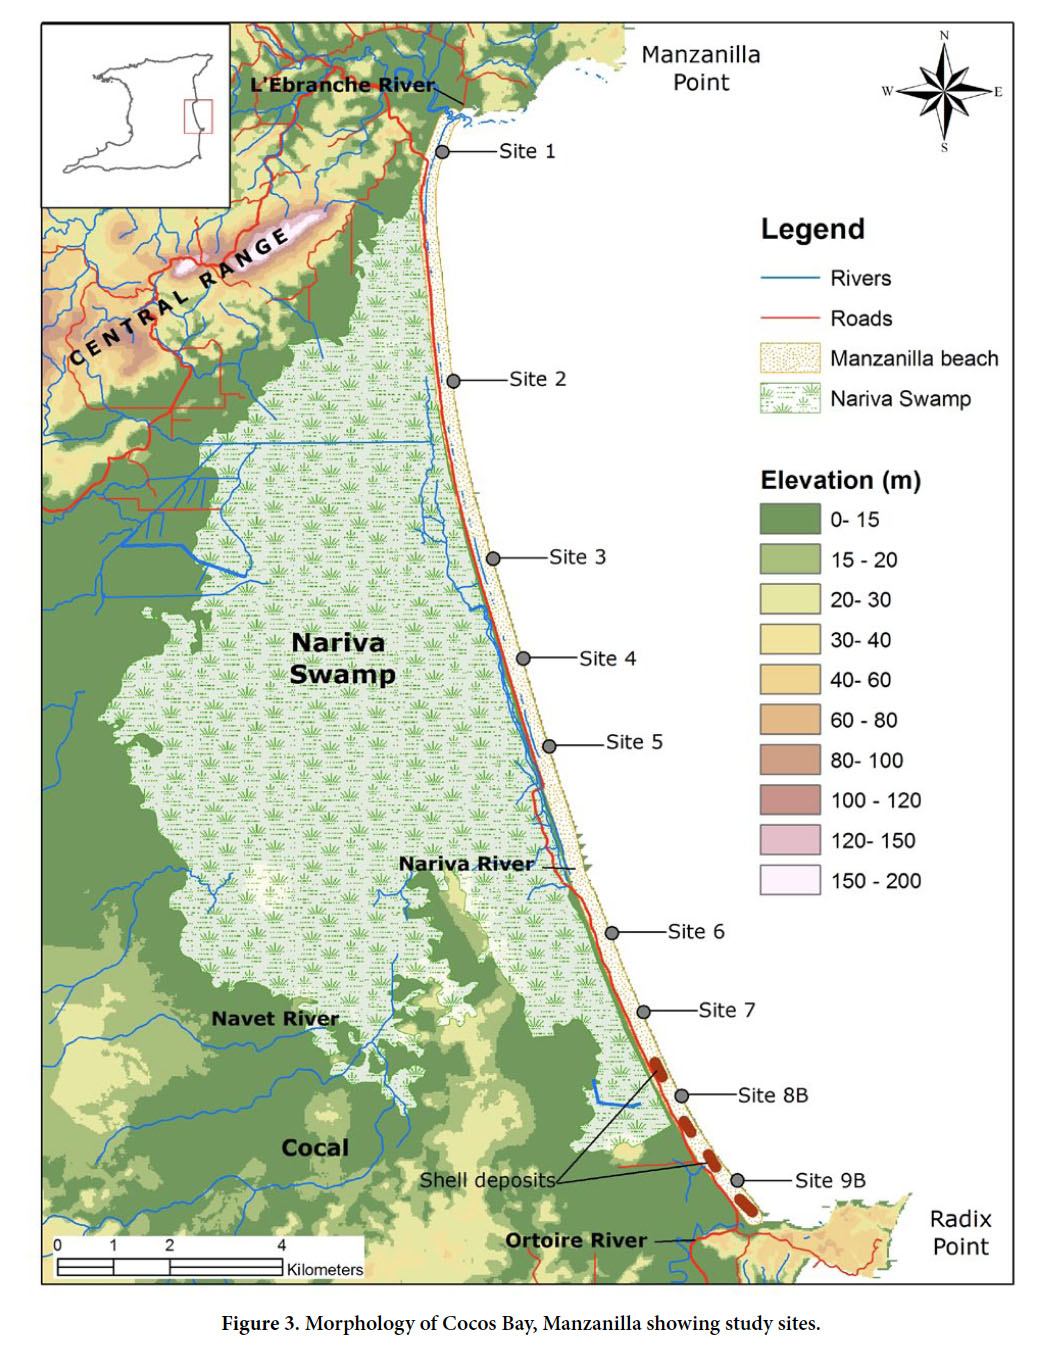
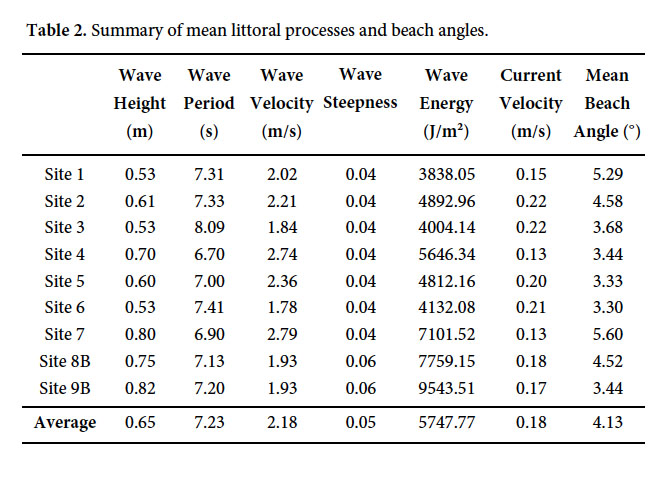
16 Data for the dry season (winter period) from 15th–23rd December 2005 were collected initially over one week to obtain diurnal changes. During this week, 3 stations (north, central, and south) were monitored in the morning and afternoon, corresponding to low and high tide cycles. Data collection included field measurements, sediment sample collections, and observations. After this diurnal data collection phase, data were collected over a lunar cycle to get an appreciation for the effects of spring and neap tides on 31st December 2005 and 6th January 2006 respectively at all 9 sites along the beach. Sites were selected based on accessibility and an attempt to get data coverage across the bay. Sites 8 and 9 had to be relocated and re-named 8B and 9B respectively after revetment works commenced in the southern section of the bay (Fig. 3). Data collection for these subsequent phases was done whenever possible at low tide, to maximize beach profile lengths.
17 Data for the wet season (summer period) from 11th– 18th June 2006 was also collected on a diurnal basis in order to compare the results with the data from the winter period for the same 3 sites. These 3 sites were also monitored for an entire month to understand how the beach profiles responds to lunar changes; from Full Moon on 11th June 2006 to Full Moon on 11th July 2006. Thereafter, all 9 sites were surveyed for a spring and neap tide on 25th June and 2nd July 2006 respectively to monitor these tidal effects on the coastline, and also to compare them with the surveys from the winter period.
18 Data was subsequently collected over a 14 month period from 9th August 2006–1st September 2007 on a monthly basis to investigate whether the beach actually goes through a yearly cycle, by being able to compare data with that of the previous year. Since data already existed for winter and summer periods in the previous year, these existing data could be cross-referenced with this new 14 month data to investigate any trends or cycles. This fieldwork was conducted once a month on every Full Moon corresponding to a spring tide.
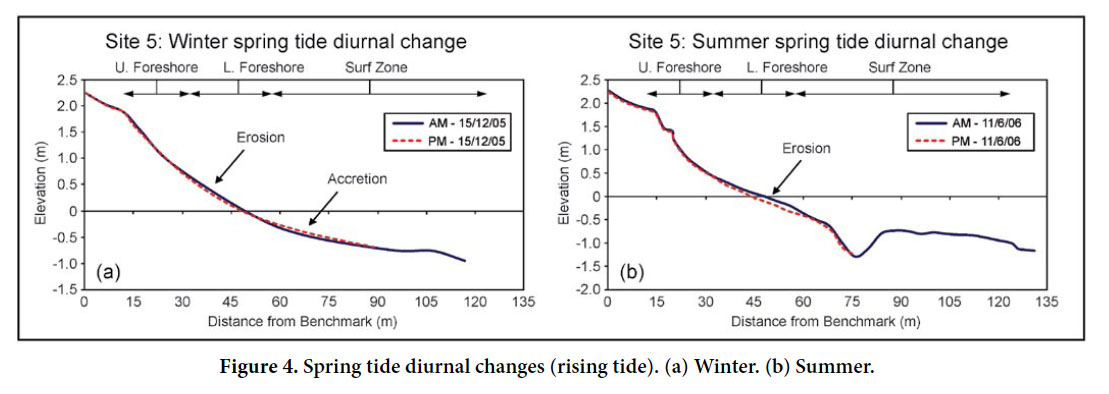
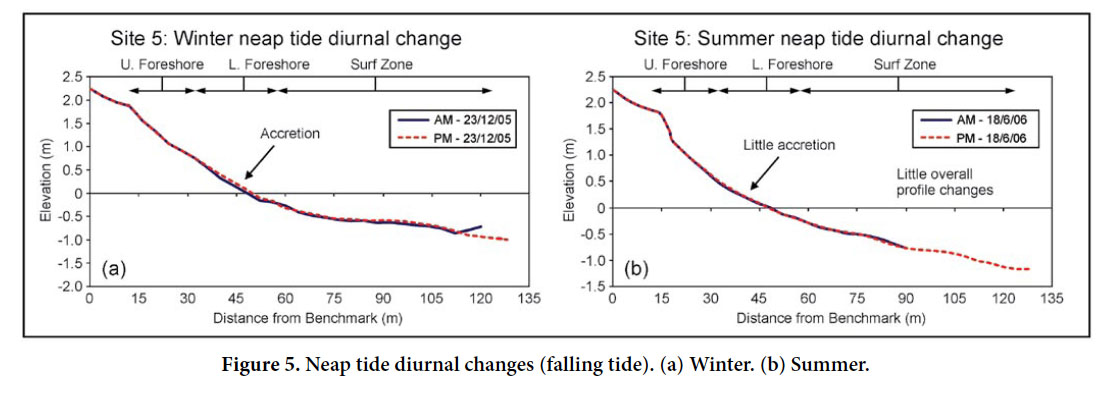
Beach sediments
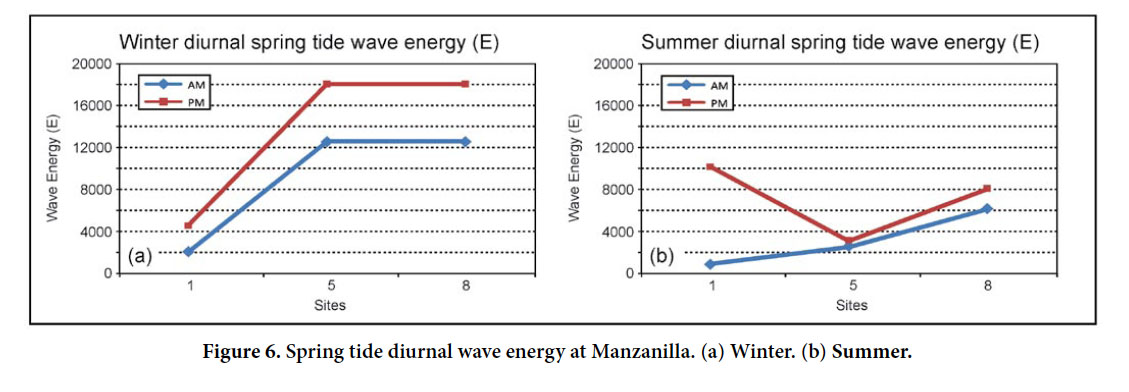
19 Beach sediments were collected from the upper foreshore (mean high water mark), lower foreshore (mean low water mark), and surf zone (15 m seaward of the lower foreshore sample) at each site along the profiling transect. Beach sediment grain-size analysis was conducted using a nest of standard sieves at 0.5ø intervals (with sizes ranging from 4 mm to < 0.0625 mm) using the standard method for dry-sieving by the British Standard Institute (BSI) as outlined by Tucker (1995). Gradistat-v5 was used to compute Folk and Ward (1957) statistical grain size distribution analysis, using the graphical method.
Littorals
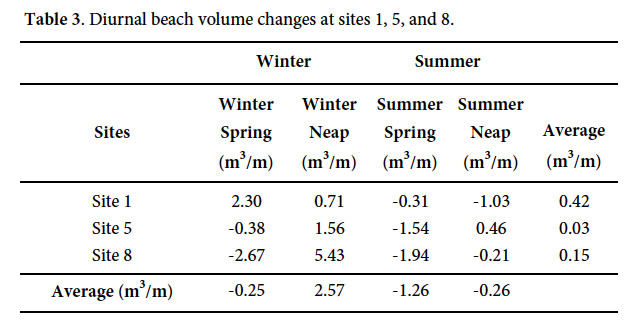
20 Predicted tides were obtained from the Hydrographic Unit of the Lands and Surveys Division, in Port of Spain. Littoral data was collected on each survey date (wind strength and direction, breaker height, wave period, wavelength and breaker angle, breaker type, and longshore currents) using standard geomorphological techniques as outlined by Goudie (1990). The Beaufort Scale was used to estimate wind speed at each site. Wind direction was recorded as a compass point, using a flag to assess the compass direction. Three averaged readings were taken of breaker height, wave period, wavelength and longshore currents. Breaker height was measured directly using a graduated staff as the distance from water level to wave crest. Wave period was obtained as the time (in seconds) for 10 wave crests to pass a stationary object. Wavelengths were measured directly using a measuring tape as the distance between two successive wave crests. Longshore currents were obtained as the distance moved by a float over sixty seconds. The current direction was recorded using a compass. Wave velocity, steepness, and energy were calculated as follows:
Wave steepness = Wave Height / Wavelength
Wave energy (E) = 1/8 pg H² (Dyer 1986)
Beach profiling
21 Beach Profiles were collected using a Topcon survey level, compass, 50 m tape and graduated staff. Apart from the diurnal data collection phase, surveys were conducted during low-tide conditions so that maximum profile lengths could be obtained. The uneven ground surface interval method was employed, where the beach slope is measured over uneven distances, corresponding to breaks or changes in slope (Goudie 1990). The surveying instrument was leveled before each survey to minimize collimation errors. The vertical heights along the profile transect were obtained from direct staff readings. The beachface angle was calculated as the average angle from the spring tide high water mark to the spring tide low water mark on each profile. The beachface angle was calculated as follows:
where
L = length of the segment (m)
VH = vertical height (m)
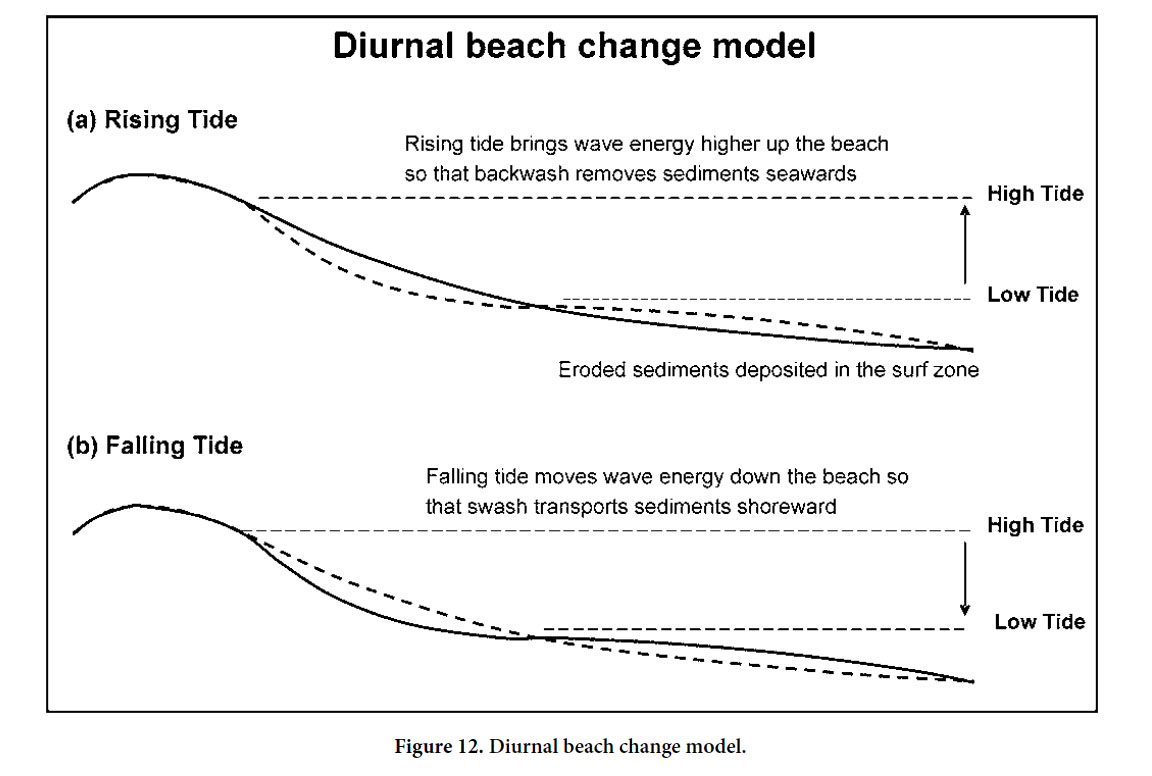
Beach volumetric analysis
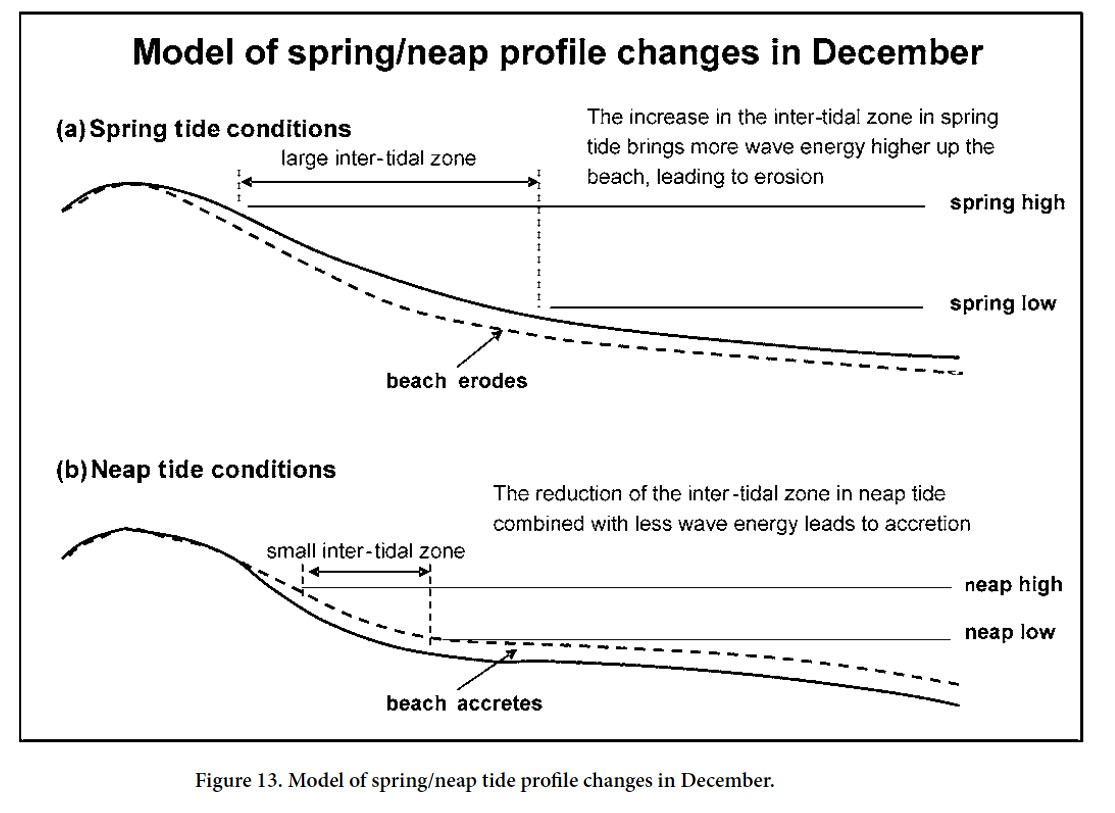
22 Average beach volume changes that occurred on the profiles were analyzed using beach profile distances up to 80 m (the shortest profile lengths) from the benchmarks. While beach changes were occurring seaward of the 80 m mark, since all profiles did not extend beyond this distance, it was not possible to include for the purpose of this analysis. A similar distance covered by all profiles was necessary in order to facilitate beach volumetric comparisons over varying timescales. Volumes were calculated as the area under each profile curve (using the trapezoidal rule) multiplied by 1, and expressed as m3/m. Therefore the beach volumes represent 1 m width of profile up to 80 m from the benchmarks.
RESULTS
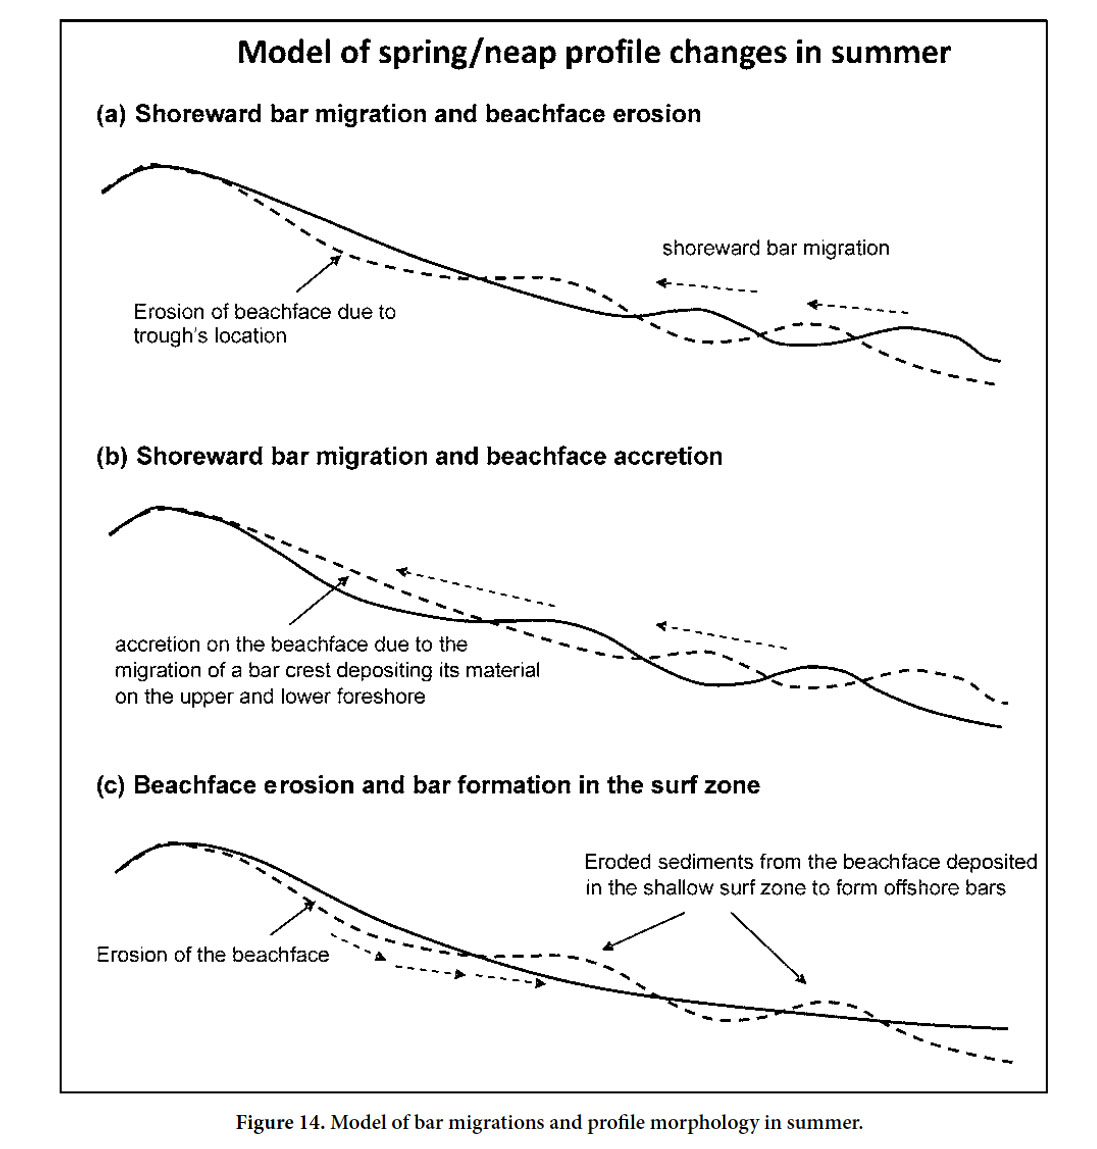
Grain size analysis
23 The Folk and Ward (1957) parameters revealed that the mean grain size ranges from coarse-sand (φ = 0.73) at site 8B to fine-sand (φ = 2.87) at site 1 lower foreshore. The majority of the beach sediment is comprised of fine-sand, with medium-sand predominating at site 8B, which has a more permanent shell deposit that coarsened the sediment. Most sediments were well-sorted except for sites 8B and 9B where moderate-sorting existed as a result of the bimodal distributions.
24 The upper foreshore sediments were either near-symmetrical or fine-skewed. Some sediments were strongly fine-skewed (φ = 0.42), such as the lower foreshore sediments at site 8B. The lower foreshore and surf zone sediments of sites 1, 8B and 9B differed in that they were generally coarse-skewed, while those at sites 2, 3, 5, and 6 were generally near-symmetrical.
25 The average kurtosis for site 1 was leptokurtic (where the centre of the grain-size distribution is better sorted than the ends). The sediments at sites, 2, 3, 5, and 6 were mesokurtic (normal and possess a normal bell shaped curve) with the exception of the surf zone sediment at site 6 which was leptokurtic. The upper foreshore and surf zone sediments at sites 8B and 9B were generally leptokurtic, while their respective lower foreshore sediments were platykurtic (where the ends of the grain-size distribution are better sorted than the centre) (Table 1).
26 The Mann-Whitney test however revealed that there were no significant sedimentological changes diurnally, across spring and neap tides, and across seasons at a 0.05 confidence level.
Morphological and littoral analysis
27 The beach on any one date of visit will be a product of the wave climate and tidal conditions of the period preceding each field visit over varying time scales. The littorals collected however give an indication of the wave environment at different sections along the bay over varying time scales. At this bay, it was found that an increase in the beach angle is an indication of erosion on the beachface and a decrease in beach angle indicates accretion. As such, changes to beachface angle was used as a proxy for analyzing beach morphological change (Table 2).
28 During the diurnal, spring/neap and seasonal study periods, linear regression tests revealed that the two littoral processes responsible for bringing about changes in beach angles were wave height and wave energy for both spring and neap tides at a confidence level of 95%. A linear regression test on the litttoral processes of the 14 month period (August 2006 to September 2007) and mean beach angles demonstrated that the only significant predictor of mean beach angle was wave energy, at a confidence level of 95% These results are similar to observations made by Komar (1976), Hardisty (1990), Carter (1991) and Pethick (2001) where coastal processes in particular wave height and wave energy are the influential factors in beach morphological changes. As such, wave energy was used in analyzing the beach morphological changes in response to tidal cycles.
29 Diurnal beach changes
30 While 3 sites (sites 1, 5, and 8) were monitored for diurnal changes, only the beach profiles at site 5 in the middle of the bay is presented, as the observed profile responses were similar. Erosion of the profiles was linked to rising tide, and accretion to falling tide. In the spring tides, the beach profiles all eroded on the upper foreshore and accreted on the lower foreshore and surf zone in the afternoon, which was linked to the rising tide and increased wave energy as wave height increased (Figs 4a, b). High spring tides concentrate more wave energy higher up the beach which led to beach erosion, transport and deposition of this sediment seaward. In the neap tides, the profiles eroded in the morning when the tide was high, and accreted in the afternoon as the tide retreated (Figs 5a, b).
 Display large image of Figure 4
 Display large image of Figure 5
31 The influential factor in determining beach morphology was wave height and wave energy during spring tides. While higher wave energies were experienced in the afternoon during both spring and neap tides, the increases in wave energy were significantly higher in the spring tide (due to meteorological conditions), and this resulted in erosion of the beachface (Figs. 6a, b).
 Display large image of Figure 6
32 During the neap tide, there were increases in the wave energy in the afternoon, but at a less substantial level compared to spring tide (Figs. 7a, b). The effect of these processes was accretion on the upper foreshore and lower foreshore in the afternoon as the tide fell. This suggests that tidal levels may have a part to play in the accretion observed on the profiles during neap tide conditions.
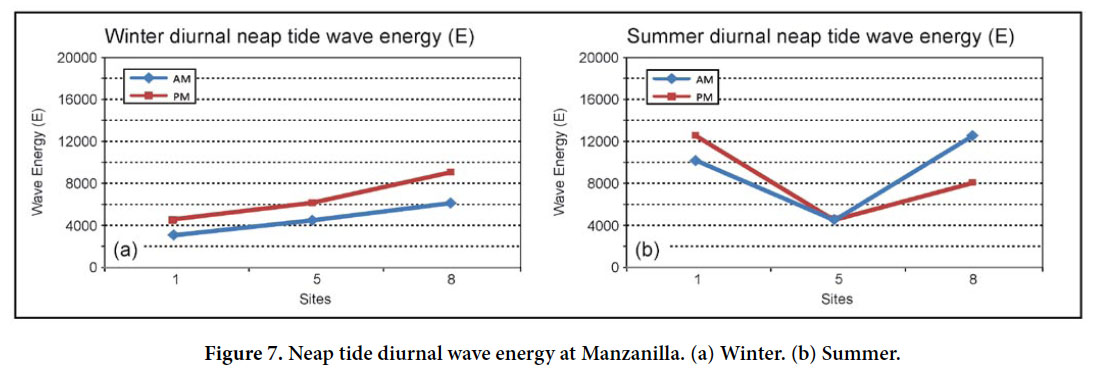 Display large image of Figure 7
33 The average diurnal beach volume change in spring tide was erosion of 1.51 m 3/m and accretion of 2.31 m3/m in neap tide across the sites. The average diurnal beach volume changes range between 0.03 m3/m and 0.42 m3/m (Table 3).
Spring/neap tide profile changes
34 The beach profiles in the winter period December 2005–January 2006 all give convincing evidence that erosion is the major process taking place from New Moon spring tide to First Quarter neap tide. From New Moon to First Quarter both winter and summer profiles eroded, however the summer profiles also showed accretion with the formation of offshore bars in the surf zone. The higher tidal range in spring tide brings more wave energy shoreward, and aids in erosion of the profile. The neap tide profiles did not repair the broad-scale erosion which occurred during the spring tide conditions after New Moon in the winter period, however in summer, accretion was observed in the surf zone with the formation of bars (Figs 8a, b).
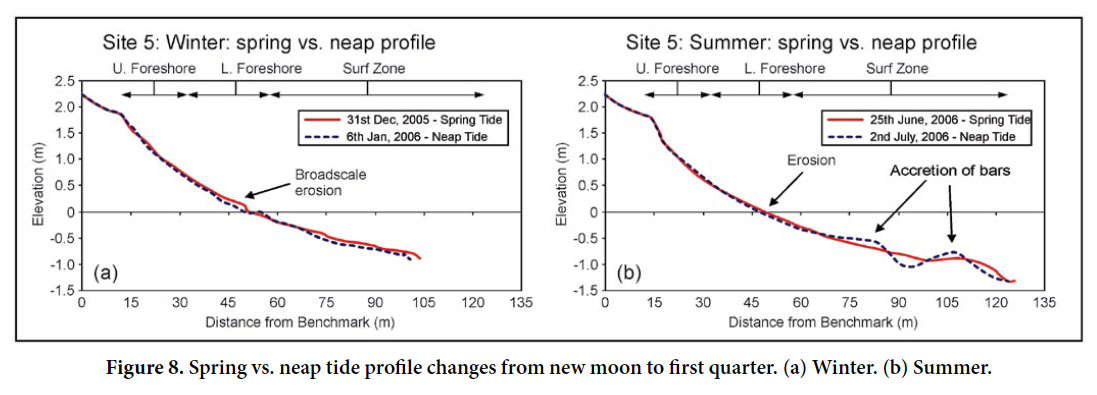 Display large image of Figure 8
35 During the winter period, wave energy in spring tide was generally higher than during neap tide, and this accounts for the broadscale erosion observed on the profiles. In the summer period however, wave energy varied across sites which led to erosion at some profiles, and also accretion occurring in the form of off-shore bars on other profiles (Figs. 9a, b).
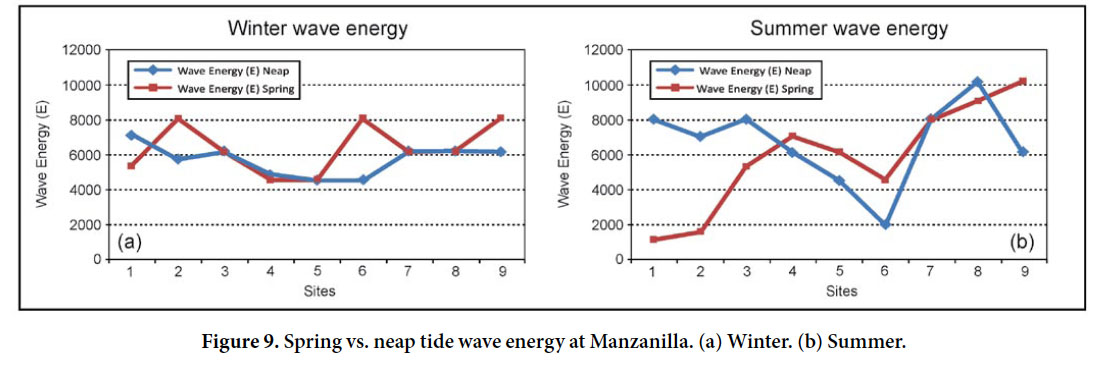 Display large image of Figure 9
Profile changes during a lunar month
36 When a Full Moon’s spring tide in the summer period was examined, the profiles eroded during spring tide conditions, and accreted during neap tide conditions. The difference from the profiles during the winter period was that the neap tide profile in Last Quarter was able to repair the erosion which occurred during the spring tide, through shoreward bar migration (Figs 10a, b). The changes to the profile in summer seem to be controlled by the formation and migration of bars in the summer period.
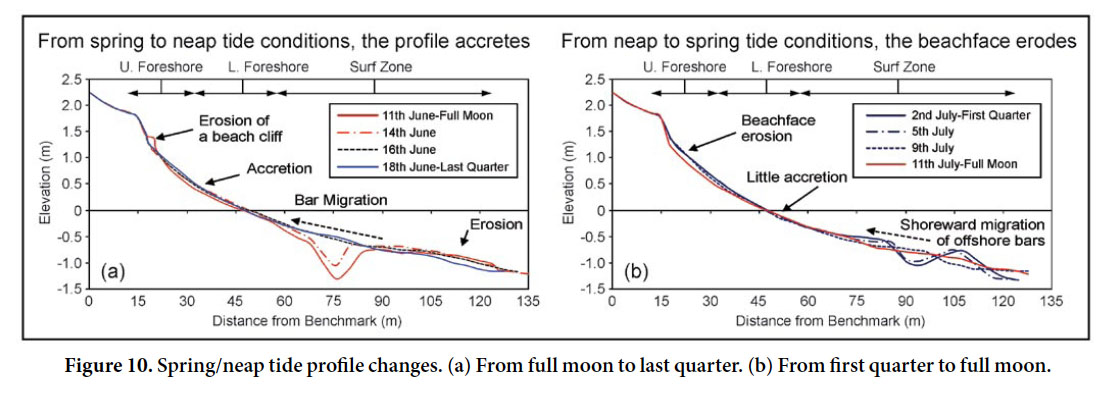 Display large image of Figure 10
37 The average seasonal beach volume change varied across sites. Erosion generally occurred at sites 1, 3, 5, 7, 8, and 9, while accretion occurred at sites 2, 4, and 6. This indicates the presence of circulation cells of erosion and deposition along the bay. Site 6 experienced the greatest seasonal average volume changes of 25.02 m3/m and site 2 the least 4.07 m3/m. The beach volume changes during spring tide conditions (erosion of 2.87 m3/m) outweighed that occurring during neap tide conditions (accretion of 0.17 m3/m) (Table 4).
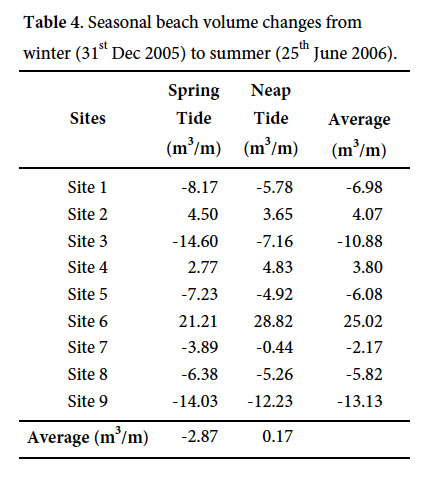 Display large image of Table 4
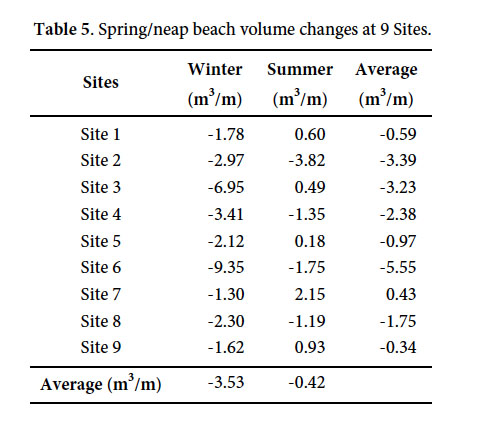
38 The seasonal beach volume changes become apparent whereby the average volume change across sites in winter was erosion of 3.53 m3/m, whereas it was only 0.42 m3/m in the summer period (Table 5).
Bar migrations and profile dynamics in summer
39 In the summer period June–July 2006, all profiles did not show that distinctive erosion of the profile from spring to neap tide as observed with the winter profiles December 2005–January 2006. In fact, only site 2 showed that distinctive pattern of eroding from spring to neap tide; while all the other sites displayed a consistent deposition taking place on the upper foreshore with erosion on their lower foreshore from spring to neap tide. It is therefore apparent that spring and neap tide effects on beach profiles could be influenced by seasonal change; since in the winter period beach profiles eroded from spring to neap tide, while the summer profiles generally accreted on the upper foreshore and eroded on the lower foreshore and surf zone. The different pattern observed in the summer was due to the presence of bars and their relative positions on the profile (Figs 11a–c).
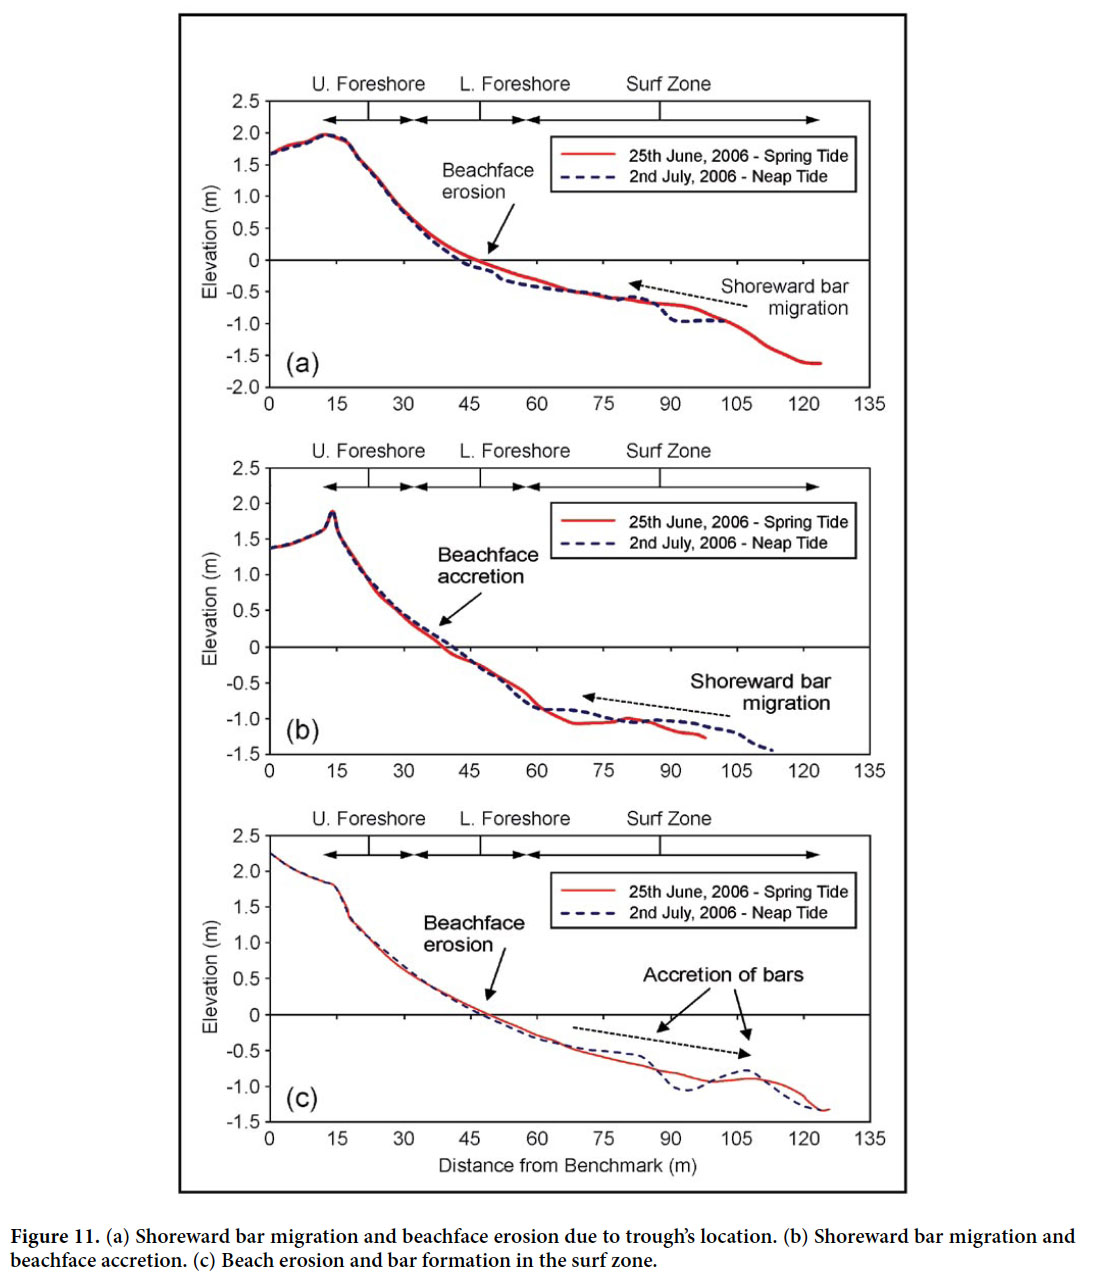 Display large image of Figure 11
DISCUSSION
40 Waves, tides and currents are responsible for beach profile changes (Johnson 1919; Cambers 1998; Saleh Salem et al. 2011). Masselink and Hughes 2003 noted the importance of not only tidal cycles, but also tidal range. Tidal range is of greater geomorphic significance because it controls the vertical distance over which waves and currents are effective along the shoreline (Masselink and Short 1993). Tides also generate tidal currents which flow landwards as the tide is rising and seawards as the tide is falling. Tidal type affects the intensity of tidal currents, as the velocity of water movement will be greater in semi-diurnal regimes than for mixed or diurnal types because of the shorter interval between high and low tide (Woodroffe 2002). At Manzanilla beach, the semi-diurnal tidal regime does play an influential role in the beach dynamics. The changes attributed to tidal cycles and seasonal changes are modeled below.
Diurnal beach change model
41 The diurnal trend highlighted was that erosion being linked to rising tide and accretion to falling tide (Fig. 12).
Model of spring/neap tide profile changes in the winter period (December)
42 The general trend observed for the spring/neap cycle was erosion during spring tide conditions and accretion in neap tide conditions. The spring/neap tide changes are also controlled by seasonal changes. In winter, the erosion that occurred after spring tide was not repaired in neap tide; therefore the profile recorded negative change. In the winter period, there is greater erosion in spring tide compared to summer due to rough seas (associated swell activity) and higher wave energy. These changes are modeled to show how the beach responds during spring and neap tide conditions in the winter period (Fig. 13).
Model of bar migrations and profile morphology in summer
43 In summer, the erosion after spring tide conditions was repaired in neap tide conditions due to shoreward bar migration. In summer, calmer sea conditions, lower wave energy and the presence of bars control the profile changes. Additionally, sedimentation derived from river discharges such as L’ Ebranche, Nariva and Ortoire, including that of the Orinoco River (Singh 1997) may be responsible for overall lower erosion rates in the summer profiles.
44 The trend observed seasonally was that bar formation was more prominent in the summer period. Enhanced bar formation and migration in summer, plays an integral role in the overall profile morphology; whereby the relative positions of the bar trough and crest determines whether erosion or accretion is occurring on the profile (Fig. 14).
 Display large image of Figure 14
45 These data indicate that Manzanilla beach does not have “summer and winter” profiles. Although Shepard and LaFond (1940), Shepard (1950, 1973), Bascom (1954), Hayes and Boothroyd (1969), Cambers (1998), and Norcross et al. (2002) have all demonstrated that the beach and near-shore exchange sediment on a winter-summer cycle, Manzanilla beach does not appear to follow this trend. The average seasonal beach volume change varied across sites, where erosion generally occurred at sites 1, 3, 5, 7, 8, and 9, while accretion occurred at sites 2, 4, and 6. Manzanilla’s beach response may more accurately be described as very dynamic with some seasonal control. During the winter period, the beach did undergo erosion, but this did not lead to the seaward transport and deposition of this sediment to form an offshore bar. During the summer period, while some sites experienced accretion, other sites were eroding. What became apparent was the enhanced formation and migration of offshore bars during the summer months, where the relative positions of the bar crest and trough determined the morphological state of the beach (whether eroding or accreting). While the exact mechanism for bar formation was not investigated, this study notes a relationship between reduced wave energy and bar formation in the summer period.
CONCLUSION
46 It should be acknowledged that results presented are based on observations of just under 2 years of data collection from December 2005 to September 2007. While a longer dataset would undoubtedly make the following conclusions more robust, the analysis has provided a window of understanding into the beach dynamics at Cocos Bay, Manzanilla. The beach changes which occur tidally and seasonally at Cocos Bay can be modeled. Diurnally, erosion occurs with rising tide and increased wave energy, whereas accretion takes place with falling tide. The general trend observed for the spring/neap cycle was erosion during spring tide conditions and accretion in neap tide conditions. The spring/neap tide changes are also controlled by seasonal changes. In the winter period (dry season), the erosion that occurred after spring tide was not repaired in neap tide; therefore the profile recorded negative change. In the summer period (wet season), the erosion after spring tide conditions was repaired in neap tide conditions due to the presence of and shoreward migration of bars, which had a relationship with lower wave energies.
47 The different pattern in the spring/neap cycle observed in the summer was due to the presence of bars and their relative positions on the profile. Three possible scenarios were modeled to show the beach changes in summer due to the formation and migration of bars:
- Shoreward bar migration and beachface erosion due to trough’s location on the beachface.
- Shoreward bar migration and beachface accretion as the bar becomes welded to the beachface.
- Beachface erosion whose sediment fuels bar formation in the surf zone.
48 In terms of beach volume changes, the diurnal cycle exhibited the least changes, with average diurnal beach volume changes ranging between 0.03 m3/m and 0.42 m3/m of sediment. The beach volume changes during spring tide conditions (-2.87 m3/m) outweighed that occurring during neap tide conditions (0.17 m3/m). The average volume change across sites during the spring/neap cycle in winter was erosion of 3.53 m3/m, whereas it was only 0.42 m3/m in the summer period. The volumetric changes in the spring/ neap cycle during the winter period outweighed that during the summer due to stronger wave energy in the winter period.
49 This beach does not have a winter-summer cycle as exists in mid-latitude beaches. All sites do not respond similarly across seasons from the winter period to the summer period. While some sites eroded from summer to winter, others accreted. It is also apparent that the beach generally contained more sediment volume in the summer months during lower wave energies as compared to the winter months. However, the winter-summer exchange of sediment across sites was not confirmed. Manzanilla’s beach response may therefore be described as dynamic with some seasonal control.
