Articles
A model for uranium mobility in groundwater in the Grand Pré region, Nova Scotia, Canada
ABSTRACT
Elevated levels of uranium that surpass maximum allowable concentrations have been recognized in some well water samples throughout Nova Scotia. In this study we examine the influence of redox conditions and regional geology on the mobility of uranium in groundwater in the Grand Pré region, located in the eastern end of the Annapolis-Cornwallis Valley in southwestern Nova Scotia. The study site is underlain by carbon-rich shale and arkosic sandstone of the Late Mississippian Horton Bluff Formation and the arenaceous sandstone of the Triassic Wolfville Formation. Water samples from drilled wells were analyzed on site for various water quality parameters (pH, conductivity, temperature, dissolved oxygen) and in the laboratory to determine alkalinity and cation (72) and major anion (9) concentrations.
Several samples exceeded Health Canada (2011) limits for uranium (20 μg/L) with values up to 50.8 μg/L and aesthetic objectives (AO) for iron (up to 605 μg/L), manganese (up to 2.28 mg/L) and other cations. Data show that different redox conditions occur in the study area. The geospatial arrangement of the chemical data suggests that the lithology of the underlying aquifer strongly influences the availability of uranium in groundwater. Reduced groundwater in Horton Bluff sandstone typically contains elevated concentrations of Fe 2+ and Mn 2+ , whereas groundwater containing high concentrations of U is found primary in oxidizing environments in quartz arenite sandstone units in the Wolfville Formation.
Consumption of groundwater in the Grand Pré region may pose a health risk; however, the level of risk remains unknown. This study emphasizes that in the area of Grand Pré, water that is considered aesthetically undesirable (containing high Fe and Mn) may pose less of a health risk (low U) than waters that are aesthetically pleasing.
RÉSUMÉ
Des niveaux élevés d’uranium qui dépassent les concentrations maximales admises ont été détectés dans certains échantillons d’eau de puits en Nouvelle Écosse. Dans cette étude, nous examinons les effets de la réduction-oxydation et de la géologie régionale sur la mobilité de l’uranium dans l’eau souterraine de la région de Grand Pré, dans l’extrémité est de la vallée d’Annapolis-Cornwallis, dans le sud ouest de la Nouvelle Écosse. Le site étudié repose sur du schiste charbonneux et du grès arkosique de la Formation de Horton Bluff, du Mississippien tardif, et sur du grès arénacé de la Formation de Wolfville, du Trias. Les échantillons d’eau de puits creusés ont été analysés sur place pour ce qui est de divers paramètres de qualité de l’eau (pH, conductivité, température, oxygène dissous) et des analyses ont eu lieu en laboratoire pour établir l’alcalinité et les concentrations de cations (72) et de principaux anions (9).
Plusieurs échantillons dépassaient les limites permises par Santé Canada (2011), en ce qui concerne la teneur en uranium (20 μg/L), certaines teneurs ayant atteint 50,8 μg/L. Il en allait de même en ce qui concerne les critères esthétiques pour le fer (des teneurs ayant atteint 605 μg/L), le manganèse (des teneurs ayant atteint 2,28 mg/L) et d’autres cations. Les données indiquent que divers phénomènes de réduction-oxydation surviennent dans le secteur étudié. Le contexte géospatial des données chimiques porte à croire que la lithologie de la couche aquifère sous jacente exerce une forte influence sur la disponibilité de l’uranium dans l’eau souterraine. L’eau souterraine qui a subi une réduction dans le grès de Horton Bluff contient généralement des concentrations élevées de Fe 2+ et de Mn 2+ , tandis que l’eau souterraine à forte concentration d’uranium est surtout observée dans les milieux oxydants de grès de quartz-arénite de la Formation de Wolfville.
La consommation de l’eau souterraine dans la région de Grand Pré peut poser un risque pour la santé, mais le degré de risque demeure inconnu. Cette étude met en lumière le risque moindre pour la santé (faible teneur en U) de l’eau dans la région de Grand Pré, qui a une apparence pouvant laisse à désirer (elle a une forte teneur en Fe et en Mn), comparativement à d’autres sources d’eau d’apparence plus agréable.
[Traduit par la redaction]
INTRODUCTION
1 Grand Pré is a rural community located on the southern shore of the Minas Basin in Kings County, Nova Scotia. The town site is located within Canada’s first designated Historic Rural District and is also a candidate for UNESCO’s World Heritage List. Water needs are supplied by privately owned drilled wells. Residents and businesses in the area have expressed concerns regarding elevated concentrations of natural contaminants in drinking water, most notably uranium. Nova Scotia does not have a comprehensive program for monitoring private well water quality, and as a result private well owners are responsible for the management and treatment of their drinking water (Nova Scotia Department of Environment and Labour 2005). Because no previous groundwater quality study has been done in the Grand Pré region to investigate these concerns, this study was undertaken to gain an understanding of the controls on uranium concentrations and mobility within aquifers underlying Grand Pré.
2 The presence of anomalous concentrations of uranium, radium, and radon in the Carboniferous Horton Group and underlying basement rocks of Atlantic Canada has been known for many years (e.g., Ryan and O’Beirne-Ryan 2006). During the late 1970s and early 1980s exploration for uranium in Nova Scotia was undertaken by numerous companies and resulted in several significant discoveries. However, in 1982 public pressure resulted in a moratorium on all exploration and prospecting for uranium in Nova Scotia that continues to the present.
3 Recent research involving the occurrence of uranium in groundwater in the region includes the identification of uranium in surface and shallow subsurface water in the Avon Valley in central Nova Scotia by Kronfeld et al. (2004). In this study, uranium concentrations in ground and surface waters were found to be generally low, except immediately adjacent to weathering uranium occurrences. Kronfeld et al. (2004) suggested that relatively high precipitation rates in the region and the high permeabilities of the sandstone aquifers in the Horton Group might result in persistent flushing. In a study of water derived primarily from these Horton Group aquifers, Page (1999) found a strong positive correlation between dissolved uranium and radon. Research by O’Beirne-Ryan and Zentilli (2003, 2006) examined the weathered surfaces on the South Mountain Batholith and their contribution of uranium and radon to groundwater in the region. Areas of high uranium concentration in Nova Scotia are associated with intrusive rock types, principally the South Mountain batholith in southwestern Nova Scotia. Both studies recognized that natural contaminants are mobilized through water-rock interactions as groundwater flows from recharge zones in granite- and slate-dominated highlands to sedimentary lowlands (Kronfeld et al. 2004). Ryan and O’Beirne-Ryan (2006) noted that numerous uranium occurrences are located in the area near Windsor, Nova Scotia. These occurrences can be divided into two types: (1) carbon- and pyrite-related quartz-sandstone-hosted type and (2) hematite arkosic sandstone-hosted type. The aerial extent of Horton Group strata throughout eastern Canada establishes the potential that similar environments for uranium accumulation likely occur elsewhere (Ryan and O’Beirne-Ryan 2006).
4 This study focuses on determining the influence of the physical and chemical properties of the local aquifers in Grand Pré on the concentration and mobility of uranium. Triassic Wolfville Formation sandstone and Carboniferous Horton Bluff Formation sandstone and shale underlie the study site but their distribution is poorly constrained (Fig. 1). Elevated levels of uranium may pose a local health risk but no research has been conducted to determine the influence that local geology may have on ground water concentrations.
 Display large image of Figure 1
LOCAL BEDROCK GEOLOGY
5 Slate of the Cambrian-Early Ordovician Halifax Group, carbon-rich shale and sandstone of the Late Devonian–Early Mississippian Horton Bluff Formation, and arenaceous sandstone of the Late Triassic Wolfville Formation all underlie the Grand Pré region (Fig.1). The Halifax Group is composed of slate, metasiltstone, and minor quartz metawacke deposited in a deep marine environment (Williams 1995) and is unconformably overlain by Horton Group sandstone and shale. The Horton Group is host to the best-documented occurrences of uranium in southwest Nova Scotia (Ryan and O’Beirne-Ryan 2006) and is comprised of the Horton Bluff Formation (HBF) and the overlying Cheverie Formation. The HBF was deposited in a fluvial deltaic and flood-plain environment; and coal measures are common (Martel and Gibling 1996). The lower unit of the HBF is composed of coarse sandstone and conglomerate and interbedded grey siltstone and mudstone. The middle unit is dominantly mud-stone, fissile shale and siltstone. A lacustrine influence in the middle and upper units is indicated by the presence of fresh water fish, plant debris, and thin pedogenic carbonates. The presence of thin horizons containing glauconite grains, marine-affinity bivalves, and crinoids suggests a distal marine influence at various times (Ryan 1998). The upper unit of the HBF and the overlying Cheverie Formation do not appear to be present in the Grand Pré region (Ferguson 1983). Instead, an unconformable contact between the middle unit of the HBF and the overlying Triassic Wolfville Formation occurs in the Grand Pré area (Moore and Ferguson 1986).
6 The Wolfville Formation is composed of interbedded and stratified sandstone, pebbly conglomerate, and minor mudstone, and was deposited in an arid braided river–aeolian environment (Leleu et al. 2009). At and near its base are pebbly and conglomeratic units with clasts derived from the metamorphic and granitic highlands nearby, and from material eroded from adjacent Early Carboniferous clastic sedimentary strata. The Wolfville Formation contains both calcite and silica cement and commonly displays well developed porosity (> 20 %).
GLACIAL GEOLOGY
7 The type and distribution of surficial sediments in the study area is a reflection of the glacial processes that dominated the area during the Late Wisconsinan (ca. 22 ka–12 ka). Both regional and local ice sheets were active and resulted in a complex ice-flow history. The last regional ice advance in western Nova Scotia was most likely towards the north (Scotia Phase; Stea et al. 1992), although drumlin orientation indicates that an earlier westerly advance may have had a strong influence on sediment deposition and deformation. Drumlins have relief of up to 20 m and are composed of clay-rich Lawrencetown Till derived from Paleozoic sediments to the east. Till thickness is highly variable; in low areas between drumlins, bedrock can be within 2 m of the surface, whereas elsewhere up to 20 m of till has been recorded in well logs. A very thin veneer (<1 m) of coarser grained ablation till is also common in the study area and is characterized by angular, locally derived clasts and a siltyto-sandy matrix. Kames and associated ice-contact deposits are rare.
HYDROSTRATIGRAPHY
8 The study area is underlain primarily by the shallow to moderately north-dipping porous Horton Bluff and Wolfville formations. The precise location of the east-west-trending contact between these two units is uncertain due to a lack of surface outcrop and inconclusive well logs. To the south and up-slope of the study area, highly fractured Halifax Group with minimal primary porosity dominates (Fig. 1). These bedrock units are commonly overlain by <10 m of till, although greater thicknesses can occur at the crest of drumlins. Five significant hydrostratigraphic units are likely to affect groundwater in the Grand Pré study area.
9 The Halifax Group outcrops approximately 5 km south of the study area. These rocks have low primary porosity (<5%; Trescott 1968) and variable groundwater flow is dominated by secondary fracture systems controlled by the attitude of the rocks (Trescott 1968). Well yields range from 0.1–150 igpm (imperial gallons per minute) with a mean of 4.6 igpm and anomalous concentrations of Fe and Mn are common.
10 About 10 km south of the study area the Devonian South Mountain Batholith (SMB) forms a regional highland composed primarily of biotite granite. This highland is the primary source rock for HBF sediments (Martel and Gibling 1996). The amount of recharge through the SMB is probably not very large on a regional basis. Previous studies on recharge in this area suggest that the majority of recharge comes as downward flow through the Quaternary sediments throughout the region (Rivard et al. 2007).
11 Groundwater is stored in and transmitted through the SMB through surface-parallel joints that decrease in density with depth (Trescott 1968). Well yields vary from 0.2–220 igpm, with a mean of about 5.7 igpm. The pH of ground-water in the SMB granite is generally between 4.5–5.5. The SMB contains numerous uranium deposits and occurrences (Ryan and O’Beirne-Ryan 2006). These deposits are interpreted as having been formed due to fluid migration in the late stages of granitoid emplacement and occur within shear and fracture zones in altered rocks, either in the granitoids rocks or as peribatholithic occurrences in the metasedimentary country rocks of the Meguma Group (MacDonald 2001).
12 The most significant aquifers in the study region occur within porous sandstone and conglomerate of the Wolfville Formation and carbonaceous siltstone and sandstone of the HBF (Rivard et al. 2007). The HBF underlies the southern half of Grand Pré though its northern boundary has not been well established. These rocks characteristically have low permeability and transmit water primarily through joints, although intergranular porosity in coarser grained units accounts for some groundwater storage. Well yields from HBF sediments are highly variable and range from 0.5–1000 igpm, with a mean of 24.7 igpm. Water quality is generally moderate to poor with high concentrations of Fe, Mn, salinity, and hardness being common. Elevated concentrations of U and As have been noted in wells located near the contact with slate of the Halifax Group.
13 The Triassic Wolfville Formation is composed of highly permeable sandstone and conglomerate that transmit water primarily through intergranular pore space (Trescott 1968). Well yields vary from 1–450 igpm, with a mean of 77.8 igpm. Water quality is generally good (pH range from 6.0–6.5); where calcite is the dominant cement, elevated hardness has been noted. Elevated concentrations of U have been noted near the contact with slate of the Halifax Group (Ryan and O’Beirne-Ryan 2006).
14 Surficial deposits such as till, ice-contact drift, and out-wash deposits are common in the Annapolis-Cornwallis Valley (Trescott 1968) but do not comprise significant aquifers in the study area. In Grand Pré a few dug wells access local or perched aquifers located in sandier facies of the Lawrencetown Till; well yields are generally less than 40 igpm. Both surface water and groundwater in the Annapolis-Cornwallis Valley ultimately discharge into the Bay of Fundy (Trescott 1968) and groundwater movement in the study area is generally northward into the Minas Basin.
SAMPLING PROCEDURES AND ANALYTICAL METHODS
15 Two suites of groundwater samples were collected from wells in Grand Pré. Samples were collected in acid-washed 250 ml polyethylene bottles from plumbing-access points located up-flow of any treatment or filtration devices. All well locations were recorded using a hand-held WAAS-enabled GPS receiver. Samples were stored on ice and in the dark during transportation to the laboratory.
16 Suite #1 includes seventeen samples gathered in August, 2006. Suite #2 was gathered in November, 2006, and contains nine samples from nine of the seventeen wells sampled initially. Re-sampled wells were chosen based on initial results from suite #1 and the requirement for further geochemical analysis. In sample suite #2, the concentration of ferrous iron (Fe2+) was measured immediately after sampling using a handheld Hach® (DR/870) colorimeter.
17 The pH of each sample was measured both in the field and at Acadia University immediately after returning from field sampling. Minimizing the time between sampling and measurement decreased the amount of gases lost and temperature changes that could alter the chemical equilibria of the water. Each sample was filtered through a 0.45 μm filter using a vacuum filtration unit. Filtering removed suspended particulate matter; most obvious of which was iron oxide (reddish-brown coating accumulated on filter surfaces). Samples that were to undergo cation analysis were acidified to a pH of 2 using concentrated nitric acid. Acidification and filtration minimized the dissolution of particulate matter and the formation of colloids in solution that could change the chemical equilibria of water samples between collection and analysis (Deutsch 1997).
18 Cation analysis was performed at ACME Analytical Laboratories Ltd. in British Columbia. Sample duplicates were included in both suites to monitor data quality. All samples were analyzed for the concentrations of 72 cations using an Inductively Coupled Plasma Mass Spectrometer (ICP-MS). Major anion concentrations were measured in suite #2 using ICP-MS to provide data for a more detailed geochemical analysis. Alkalinity was measured in non-acid-ified samples from suite #2 by titration using 0.02 N H2SO4 (with an end-point pH of 4.5).
pE-pH monitoring
19 The pE of each sample was determined using an ideal aqueous solution assumption where all activity coefficients equal unity. This assumption was justifiable after ionic strength calculations (Faure 1998) revealed that samples were highly dilute, with ionic strengths between 4.88 × 10⁻³ and 1.02 × 10⁻². As a result, virtually all activity coefficients calculated using the Debye-Hückle equation were only negligibly different from one. Furthermore, the influence of complexation on the solubilities of the elements under consideration was also negligible, again precisely because of the low ligand concentrations in these dilute waters. These observations significantly simplify thermodynamic modeling of these aqueous systems.
20 To calculate the pE of each sample, the equilibrium:
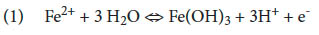
was used to determine the log K at 25°C. This log K was than adjusted using van t’Hoff’s equation to the measured temperature for each sample. Finally, the mass action equation:
along with the measured pH’s and colorimetrically-derived Fe2+ concentrations were used to estimate the pE of each sample.
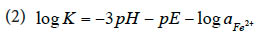
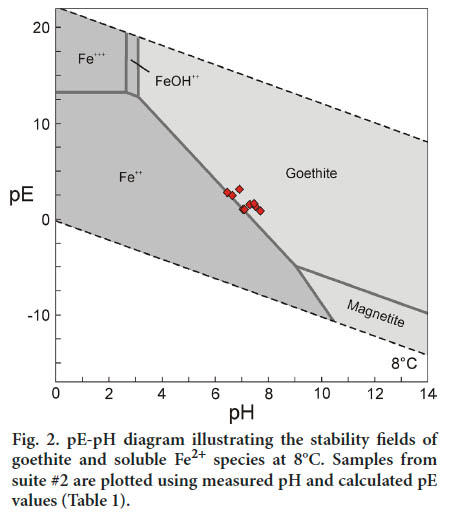
21 The calculated pE and pH values for each sample were plotted on pE-pH diagrams (Figs. 2, 3, and 4). These diagrams depict the stability fields of Fe, Mn, and U in natural waters at 8°C. The activities of Fe, Mn, and U used to obtain these diagrams were 10-6, 10-6, and 10-7 molal, respectively (close to the mean molalities observed in the samples), and this influenced the locations of stability boundaries on these diagrams.
 Display large image of Figure 2
 Display large image of Figure 3
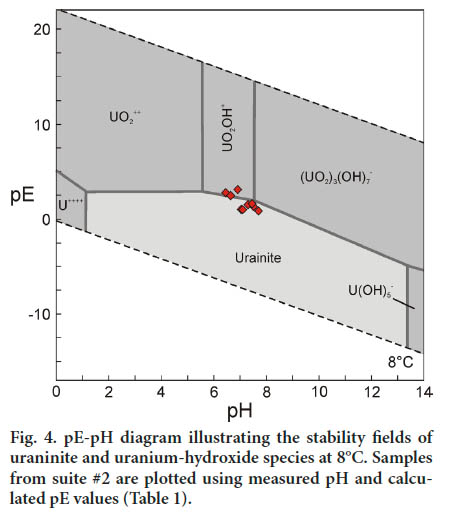 Display large image of Figure 4
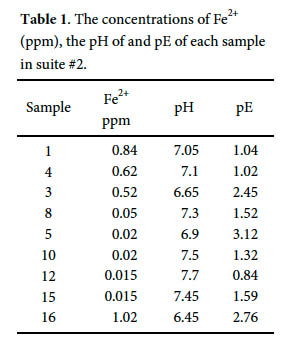 Display large image of Table 1
Piper trilinear plots
22 The Piper trilinear diagram is a useful tool in water-analysis interpretation as it helps to classify waters in terms of composition and this information can assist in determining the different geologic or hydrologic units through which groundwater flows (Hem 1992). All cation concentrations (Ca2+, Mg2+, Na+, and K+) and most anion concentrations (SO42- and Cl-) required to construct the Piper trilinear diagram were included in the laboratory analysis of suite #2; only carbonate (CO32-) and bicarbonate (HCO3-) concentrations were lacking. However, these concentrations were deduced through an indirect method using alkalinity measurements.
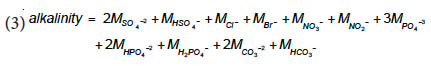
23 The laboratory analysis reported alkalinity in units of mg/L of CaCO3. This approach assumes that the carbonate ions present in the groundwater are completely responsible for the consumption of the hydrogen ions during H2SO4 titration (Deutsch 1997). This assumption may not be true if there are additional H+ acceptors dissolved in solution [Equation 3]. As a result, the concentrations of non-carbonate species must be subtracted from alkalinity before determining the concentration of the carbonate species (Deutsch 1997):
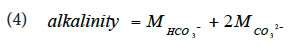
The ability of non-carbonate species to contribute to alkalinity was determined to be negligible as they have concentrations that are considerably lower (by several orders of magnitude) than those of the carbonate species. As a result, the alkalinity of each sample is demonstrated to be essentially a function of the carbonate and bicarbonate concentrations alone. Carbonic acid has no effect on alkalinity as it has a charge balance of zero. Therefore, in these waters, we can assume that:
The moles of each carbonate species (CO32-, HCO3- , and H2CO3o) were then determined using pH and thermodynamic constraints. This determination was done via the following procedure:
(i) the observed pH’s for each sample and the calculated log K’s for the equations:
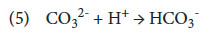
and:
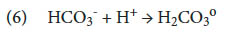
were used to determine the log ratios of (CO3-2/HCO3-) = RA and (HCO3-/H2CO3o) = RB, using the Henderson-Hasselbalch (Po and Senozan 2001) equation;
(ii) then the equations:
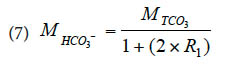
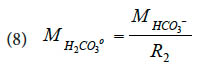
were used to determine the molalities of carbonate and bicarbonate.
24 Once the molalities of CO32- and HCO3- were determined, construction of a Piper trilinear diagram for samples from suite #2 could be achieved using Rockworks 2002© software.
RESULTS
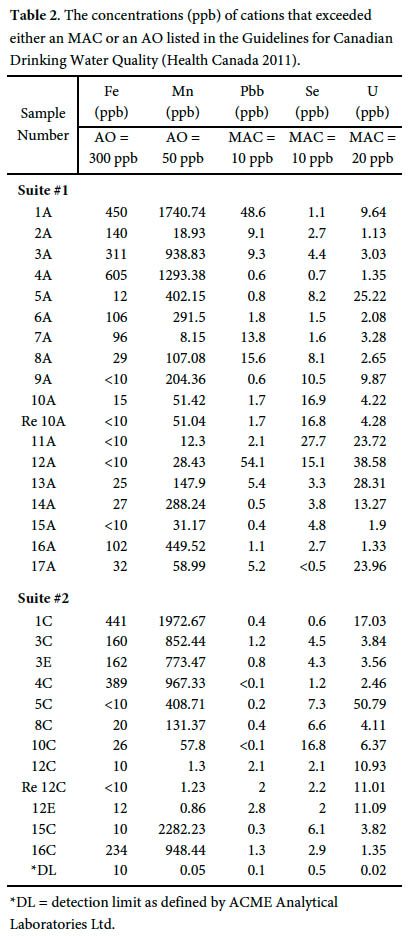
25 Five of the 72 cations in the Grand Pré samples were present in concentrations that exceeded a Health Canada (2011) maximum allowable concentration (MAC) or aesthetic objective (AO) in suite #1 and again in suite #2 (excluding Pb; Table 2). These cations are U (exceeding MAC = 0.02 mg/L in 4 wells), Se (exceeding MAC = 0.01 mg/L in 4 wells), Fe (exceeding AO = 0.3 mg/L in 3 wells), Mn (exceeding AO = 0.05 mg/L in 12 wells), and Pb (exceeding MAC = 0.01 mg/L in 3 wells).
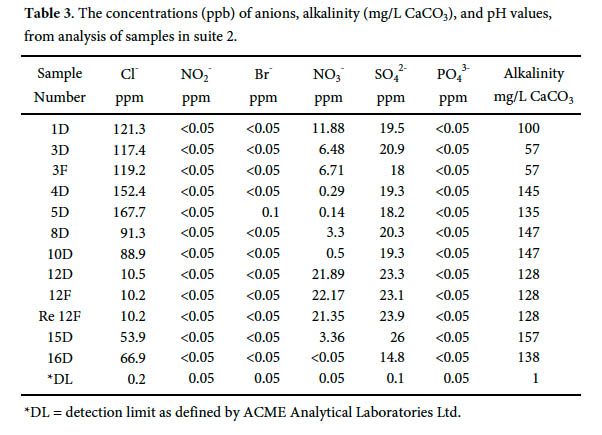
26 The concentrations of chloride (Cl-), bromide (Br-), sulphate (SO42-), nitrate (NO3-), nitrite (NO2-), and phosphate (PO43-) were below the limits listed in the Guidelines for Canadian Drinking Water Quality (Health Canada 2011). All concentrations of nitrite, phosphate, and bromide (excluding sample 5D) were below the detection limits (Table 3). Alkalinity ranged from 57 to 157 mg/L CaCO3; the majority of the samples fell within the range 130 to160 mg/L CaCO3 (Table 3). The pH values of groundwater in Grand Pré ranged from 6.45 to 7.7.
 Display large image of Table 2
Distribution and redox trends
27 The concentrations of cations measured in samples from suite #1 were compared to the locations of the wells using the GPS location of each well. A digital elevation model (DEM) was superimposed on the grids in order to demonstrate surface water flow direction.
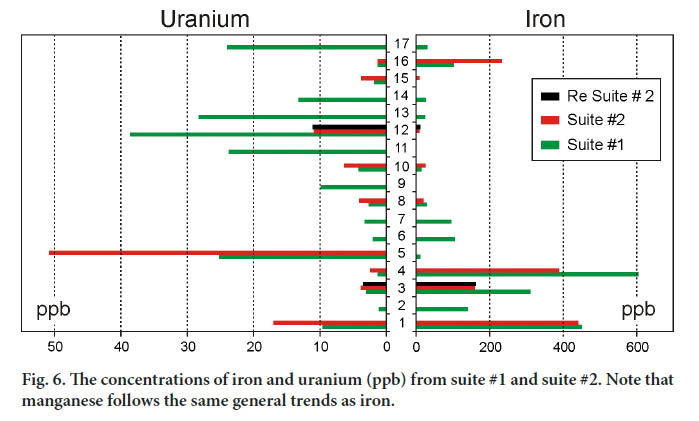
28 Distribution trends of uranium were determined by plotting circles with diameters sized proportional to concentration over each associated well location (bubbleplots). The highest concentrations (largest circles) are clustered together in the northwestern part of the study area (Fig. 5). This distribution suggests the possibility of a local source of U affecting groundwater in this area or local redox conditions contributing to the dissolution of U by groundwater. A plot of Fe and Mn concentrations indicate a roughly inverse relationship with U concentrations (Fig. 6).
29 The solubility of ions in groundwater is influenced by changes in the redox potential in the aquifer. Iron and Mn ions dissolve in reducing environments principally into the species Fe2+ and Mn2+, and precipitate in oxidizing environments as Fe(OH)3 and Mn(OH)2 (Hem 1992). In contrast, U dissolves in oxidizing environments, predominantly in the form of the uranyl ion (UO22+), and precipitates in reducing environments as UO2 (uraninite) (Hem 1992). It is therefore likely that U is present in elevated concentrations in oxidizing conditions, whereas Fe and Mn are present in elevated concentrations in reducing environments. Consequently, distribution trends reveal that redox conditions may be predominantly responsible for the dissolution or precipitation of U, Fe, and Mn in groundwaters underlying Grand Pré.
Cation availability
30 Iron is an appropriate indicator of redox conditions in Grand Pré because it is saturated in groundwater (iron-oxy-hydroxide precipitates were removed from all samples during filtration). Iron reacts predictably in oxidizing and reducing conditions and is present in high concentrations in environments where reduction of ferri-oxy-hydroxides is occurring (Hem 1992). In Grand Pré, the filtrate colour suggests that goethite and hematite precipitated. If these mineral are present in suspension, elevated Fe concentrations indicate a reducing environment in Grand Pré groundwater, and lower Fe concentrations indicate an oxidizing environment.
31 Uranium is a trace metal and is not as abundant as Fe in natural groundwater (Hem 1992). At Grand Pré, U occurs in low concentrations where Fe concentrations are elevated (suggesting a reducing environment), but occurs at both high and low concentrations where Fe concentrations are low (suggesting an oxidizing environment). These variable concentrations of U in oxidized groundwaters may be explained by the presence or absence of U in the host formation.
 Display large image of Table 3
 Display large image of Figure 5
pE-pH diagrams
32 The calculated pE values for Grand Pré groundwaters fall within a range of 0.84–3.12, and are listed in Table 1 along with the Fe2+ concentrations and pH measurements of sample suite #2 used to determine them. The pE-pH stability fields for Fe are presented in Figure 2. The data points plot close to the boundary between the stability fields of goethite and dissolved ferrous iron, consistent with these waters being saturated with respect to goethite. These results suggest that the Grand Pré well waters are likely derived from goethite-bearing aquifers in the Horton Group or Wolfville Formation, as discussed above.
33 Figure 3 presents a pE-pH diagram for Mn. The data points plot well within the Mn2+ stability field, indicating that Mn is very undersaturated relative to pyrolusite (MnO2; Mn concentrations are much lower than 10-6 M), and is not likely to become saturated unless highly oxidizing conditions are encountered. Accordingly, no history of Mn stains on residential plumbing is reported in the Grand Pré area.
34 The pE-pH stability fields of U minerals and species that could be present in Grand Pré groundwaters are presented in Figure 4. The data points bracket the stability field boundary between uraninite and uranyl-hydroxide complexes. This distribution indicates that some of these waters are likely to be saturated with respect to uraninite, and may also be derived from an aquifer containing uraninite. Because uraninite is a principle U ore mineral, this conclusion has significant health implications. It could suggest that the host rocks to some of the Grand Pré well waters contain at least some uranium-bearing minerals.
 Display large image of Figure 6
Piper trilinear plots
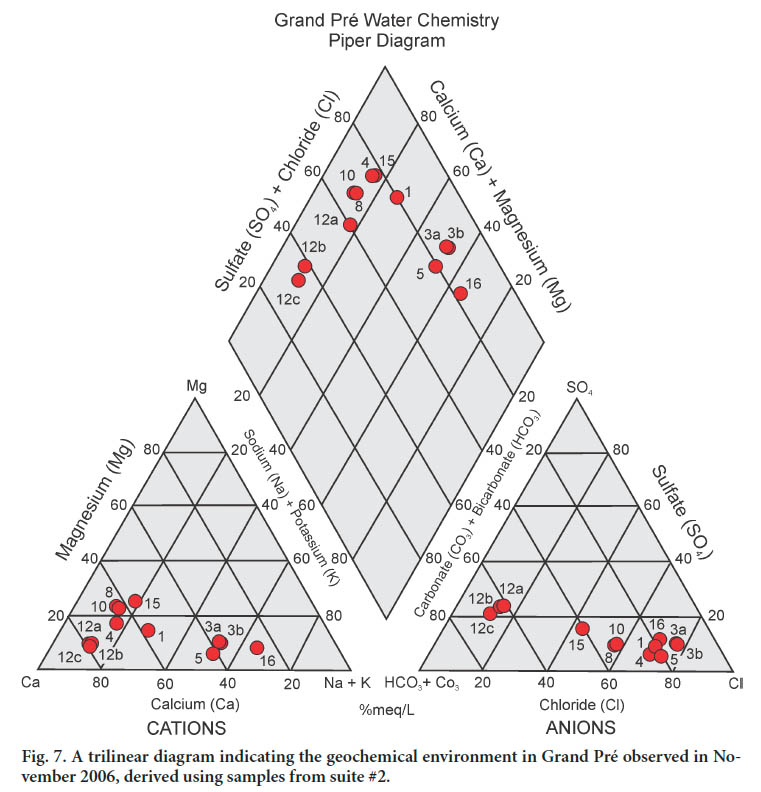
35 The triangular field displaying the cation concentrations (Fig. 7, left side) reveals that sample waters are dominated by either Ca2+ or Na+ ions. Similarly, the triangular field displaying the anion concentrations reveals that the samples are dominated by Cl-, with the exception of samples 12a, 12b and 12c, which are dominated by carbonate and bicarbonate. The diamond field depicting the combined water chemistry indicates that the groundwater is divisible into three water types: a calcium carbonate water type (CaCO3; samples 12a, 12b, and 12c), a sodium chloride water type (NaCl; samples 3a, 3b, 5 and 16) and a calcium chloride water type (CaCl2; samples 1, 4, 8, 10, and 15) (Fig. 7; Table 4).
36 Well waters that are dominated by high Ca concentrations are likely derived from Ca-cemented (calcite, dolomite, gypsum and/or anhydrite) sedimentary rocks within both the Horton Group and Wolfville Formation (Martel and Gibling 1996). Wells 1, 4, 8, 10, 12, and 15 may be drawing water from such sedimentary rocks.
37 Grand Pré is bordered directly by the Minas Basin, and as a result, the ocean is a predicted cause of NaCl-type water. If samples 3a, 3b, 5, and 16 are influenced by ocean water they would be expected to have a pH similar to that of ocean water (pH = 8). However, as compared to the other samples on the Piper trilinear diagram, the pH values of the NaCl-type water samples are furthest from a pH of 8, and thus the source for this water is likely not the ocean.
38 Apart from saltwater influence, chloride ions contributing to NaCl and CaCl2 water types may originate from various sources. Clay beds in the shales of the Horton Group may be acting as semi-permeable membranes retarding the passage of chloride ions and causing them to become concentrated in one area (Hem 1992). This situation may occur because chloride ions are larger than most other ions and are unable to penetrate interstitial pore spaces within clays. Also, calcium ions may be exchanged for sodium ions on mineral surfaces in an ion-exchange process resulting in CaCl2-dominated waters (Hem 1992).
39 Trilinear diagrams are often used to demonstrate a change in water chemistry over time, and as a result indicate the direction of flow. No trends are apparent in water chemistry and flow direction to suggest such water composition evolution in the Grand Pré area.
DISCUSSION
40 Weathered granite from the South Mountain Batholith and arkosic arenite and shale from the Horton Group have been associated with the release of U into groundwater and may be a regional source of U in the Grand Pré area (O’Beirne-Ryan and Zentilli 2003; Kronfeld et al. 2004; Ryan and O’Beirne-Ryan 2006). Ryan and O’Beirne-Ryan (2006) noted that in the Windsor region, U enrichment in the HBF is related to reduction-oxidation fronts in the sandstone. The U is associated with carbon-rich horizons and disseminated pyrite in the sandstone and shale, the oxidation of which reduces the valence state of U to an insoluble U4+ state, causing its deposition at or near pyrite and/or organic carbon debris.
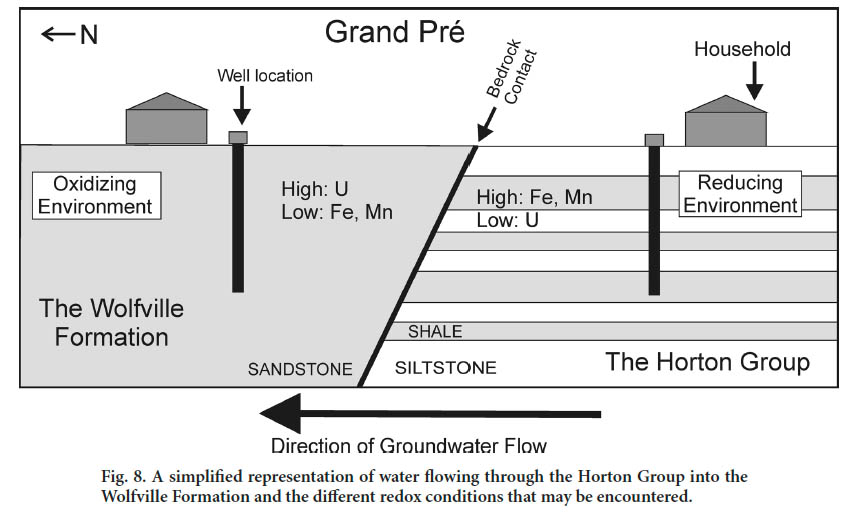
41 The contact between the Horton Group and the Wolfville Formation lies north of Highway 101 but is poorly constrained by both outcrop and subsurface data (Moore et al. 2000; White 2010). The erosional contact marks a significant change in stratigraphy and rock composition, and is likely to affect the chemistry and composition of the groundwater that flows through it. Interbedded carbon-rich shale and siltstone of the HBF likely produce a reduced groundwater environment, and the clean, porous sandstone (mature quartz arenite) in the Wolfville Formation produce an oxidized groundwater environment. This stratigraphic dichotomy may explain the different groundwater environments (oxidized and reduced) observed in the Grand Pré area.
42 The higher concentrations of U are located in the north-ernmost wells in the sample area (Fig. 5), the area most likely underlain by the Wolfville Formation ( Fig. 1). Groundwater flowing through reducing conditions in the Horton Group is characterized by low U concentrations and high Fe and Mn concentrations (e.g., samples 15 and 16). When water flows into the Wolfville Formation, oxidized conditions are encountered (Fig. 8). This change results in the precipitation of Fe and Mn and the dissolution of U (e.g., samples 11 and 12).
43 This model presents a paradox that is supported by the data, and is of importance to well owners. Well water that is aesthetically undesirable due to high concentrations of Fe and Mn may pose a lower health risk than water with low Fe and Mn concentrations that is more aesthetically desirable but likely has higher U concentrations.
 Display large image of Figure 7
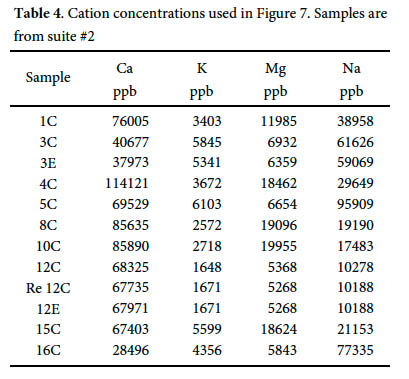 Display large image of Table 4
CONCLUSIONS
44 Significant scope exists for continued investigation of groundwater quality and the occurrence of U in the Grand Pré region. The effect of well depth and seasonal variations on groundwater chemistry should be examined. Also, determination of the composition of the lithologies from which samples were derived and locating the contact between the Horton Group and the Wolfville Formation would provide further insight into the dominant influences on groundwater in the study area.
45 The health risks associated with the consumption of Grand Pré groundwater were not within the scope of this study. Unpredictable and poorly understood environmental influences on groundwater make predictions unrealistic. Importantly, this study has determined that residents and industrial users in the Grand Pré area will likely have to treat water with high Fe and Mn concentrations in order to obtain water that poses the lower health risks (i.e., low U concentrations).
 Display large image of Figure 8
I. Spooner and C. Stanley acknowledge support from the National Science and Engineering Research Council. The authors also gratefully acknowledge the support of ACME Laboratories, Vancouver, Canada. DEM data were compiled by Amanda Lavers, Acadia University, in 2006. Grant Ferguson and an anonymous reviewer provided constructive suggestions on the manuscript.