Articles
Urban Geochemical Hazard Mapping of St. John’s, Newfoundland, Canada
ABSTRACT
The surface soil concentrations (n = 997) of ten metals with Canadian Council of Ministers of the Environment soil quality guidelines were mapped on residential properties in the City of St. John’s, Newfoundland and Labrador, Canada. Concentrations of all metals are elevated above background levels, five of the ten metals – As, Ba, Cu, Pb, and Zn – have concentrations above environmental health guidelines in more than 20% of samples, and three metals – As, Pb, and V – exceed human health guidelines in 34 to 47% of samples. Using a contamination index, surface soil was shown to be highly contaminated in the downtown area, primarily on residential properties predating the 1950s. In order of influence, the four metals with the highest contamination factor are Pb, Zn, As, and Cu. Compared to background levels, surface soils are significantly enriched in Pb and Cd, and moderately enriched in Cr, Cu, and Zn. A hierarchical clustering procedure indicated strong statistical relationships between the occurrences of two metal groups across all soil samples. One group – Pb-Zn-Cd – has consistently elevated concentrations in soil sampled adjacent to the exterior walls of buildings, although high values were also recorded in roadside sites and from open spaces on properties. The second group – Cr-Ni-Cu – has minimal to moderately elevated concentrations in all sample locations, though slightly higher concentrations along roadsides. The clusters of metals and their spatial concentration patterns suggest that weathered paint, vehicular emissions, and coal burning were important sources for the main contaminants in sampled soils. Of the three metals (i.e., As, Pb, and V) which significantly exceed human health guidelines, Pb and As pose the greatest potential health risk and require further assessment. It is possible that other cities in the region that share similar urban history and characteristics have a potentially hazardous geochemical landscape.
RÉSUMÉ
Des concentrations du sol en surface (n = 997) de dix métaux qui figurent dans les lignes directrices sur la qualité du sol du Conseil canadien des ministres de l’Environnement, ont été répertoriées sur une carte de terrains résidentiels de la ville de St. John’s, à TerreNeuveetLabrador, au Canada. Les concentrations de tous les métaux étaient plus élevées que le niveau naturel et cinq de ces dix métaux, As, Ba, Cu, Pb et Zn, avaient une concentration supérieure aux lignes directrices sur l’hygiène du milieu dans plus de 20 % des échantillons. Dans 34 à 47 % des échantillons de trois métaux, As, Pb et V, il y avait une concentration qui dépassait les lignes directrices sur la santé humaine. En regard d’un indice de contamination, il a été établi que le sol en surface dans le secteur du centre-ville présentait une forte contamination, principalement sur des terrains résidentiels aménagés avant les années 1950. En ordre d’importance, les quatre métaux qui présentaient la plus forte contamination étaient le Pb, le Zn, l’As et le Cu. Comparativement au niveau naturel, les taux de Pb et de Cd étaient particulièrement élevés dans le sol en surface, tandis que les éléments Cr, Cu et Zn étaient modérément présents. Une classification hiérarchique a indiqué une forte corrélation statistique en ce qui a trait à la présence de deux groupes de métaux dans tous les échantillons de sol. Un groupe de métaux – Pb-Zn-Cd – présentait toujours une concentration élevée dans les échantillons de sol recueillis à proximité du mur extérieur des bâtiments, même si des teneurs élevées ont aussi été relevées dans des échantillons en bordure du chemin et dans des aires libres sur les propriétés. Un autre groupe de métaux – Cr-Ni-Cu – avait une concentration minimalement à modérément élevée à tous les points de prélèvement des échantillons, bien que la concentration ait été légèrement plus élevée en bordure du chemin. La classification des métaux et la configuration de leur concentration dans l’espace portent à croire que des résidus de peinture, des émissions polluantes des véhicules, et le produit de la combustion du charbon ont été d’importants apports des principaux contaminants dans les échantillons de sol prélevés. Parmi les trois métaux (As, Pb et V) dont la concentration dépasse largement les lignes directrices sur la santé humaine, les éléments Pb et As sont ceux qui posent la plus grande menace possible à la santé et qui nécessitent une évaluation plus approfondie. Il se peut que d’autres villes de la région qui ont en commun les mêmes antécédents et caractéristiques d’urbanisation contiennent des terrains dont la composition géochimique est susceptible d’être dangereuse.
[Traduit par la redaction]
INTRODUCTION
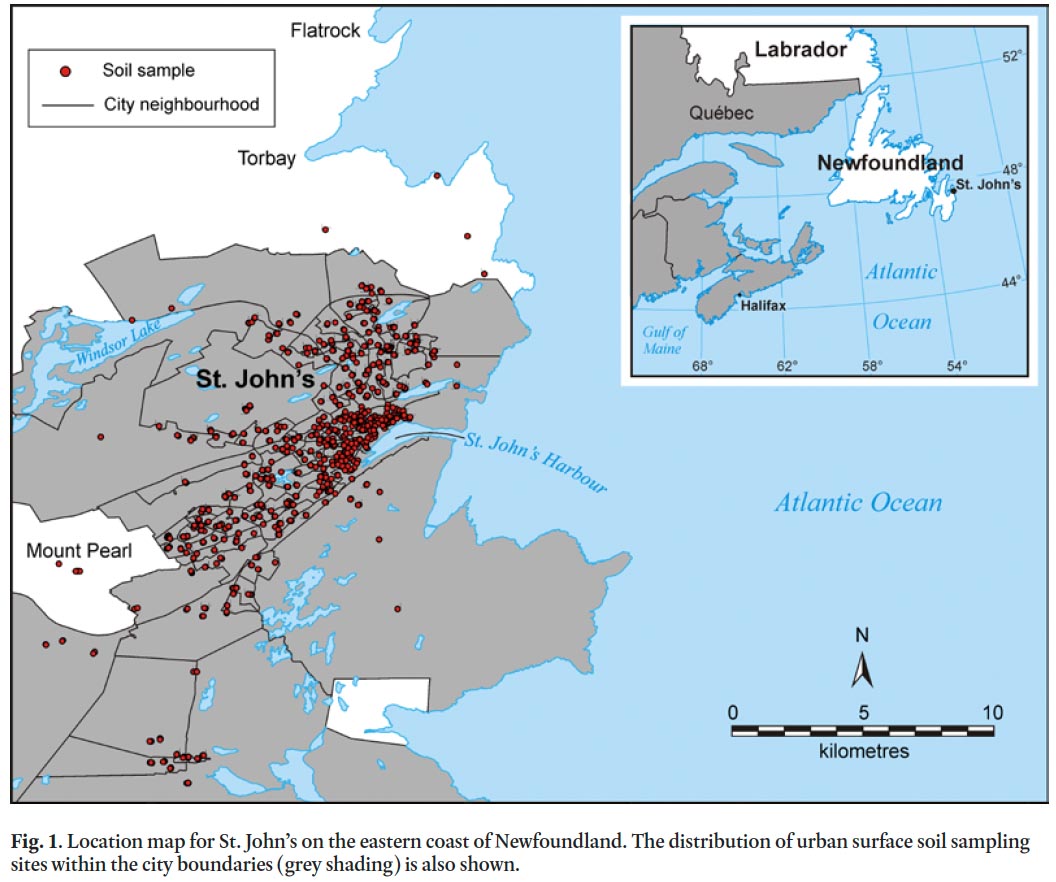
1 Metal concentration and distribution in urban environments have received considerable attention in the past several decades, with more emphasis on European and Asian cities compared to those in North America (Johnson and Ander 2008). Studies on the urban geochemistry of metals in North America include Grand Rapids, Michigan (Klein 1972), St. Louis, Missouri (Kaminski and Landsberger 2000), Montreal, Quebec (Ge et al. 2000), and Cincinnati, Ohio (Turer et al. 2001), whereas urban geochemical mapping projects are less common with studies conducted in New Orleans, Louisiana (Mielke 1994) and Pueblo, Colorado (Diawara et al. 2006), for example. Urban geochemical studies in general have tended to focus on large cities with associated major transportation and/or industrial activities. In contrast, this study focuses on the relatively small port city of St. John’s, Newfoundland and Labrador, in Atlantic Canada (ca. 100,000 population; Statistics Canada 2006; Fig. 1) where, apart from small-scale commercial and industrial enterprises that served the local community, there is no history of major industrialization (Poole and Cuff 1994).
 Display large image of Figure 1
2 Beginning in the early 1500s, St. John’s became a supply base for European fishermen and by 1795 had a settled population of 3000, the largest settlement in Newfoundland (Poole and Cuff 1994). By 1888, the population of St. John’s was 29,000, mainly located along the harbour, and the city had 30 km of streets concentrated in the eastern part of the downtown. Since then the city has grown, fan like, from the north side of the harbour outwards (Fig. 2). Between 1951 and 1971, the population grew rapidly from 52,873 residents to 88,100. More recently, the growth of St. John’s has slowed in favour of Mount Pearl and other communities outside the city boundaries (Poole and Cuff 1994).
 Display large image of Figure 2
3 Previous urban geochemical studies of St. John’s have either indicated the potential for "a large reservoir of potentially toxic metals" (Christopher et al. 1993) or revealed the presence of high soil Pb levels (Bell et al. 2010). Specifically, Christopher et al. (1993) used urban lake sediment records (pollen, diatoms, charcoal, soot and oil droplets, geochemistry, Pb isotopes) to examine the impact of urbanization on lakes in and around St. John’s. They measured a 30–40-fold increase in Pb in recent sediments and associated peaks in metals, including Ag, Al, As, Au, Cd, Co, Cr, Cu, Fe, and Zn. They attributed these increases to land clearance and urban development, sewer construction, road building, coal burning and leaded gasoline. Bell et al. (2010) concluded that strong correlation exists between soil-Pb levels and age of housing in St. John’s, with likely sources of Pb from coal burning, leaded gasoline combustion and weathering of leaded paint on exterior building surfaces.
4 Given the potential exposure risk for St. John’s residents to metals in soil and the potential human and environmental health hazards associated with above-guideline metal exposure, this study sought to: (1) describe the urban geochemical landscape of St. John’s, with specific reference to those metals with Canadian Council of Ministers of Environment (CCME) health guidelines; (2) establish the levels of natural and anthropogenic input to urban soils of the selected metals; and (3) distinguish the major pollution sources of metals into the urban residential environment. To address these objectives the study takes advantage of a dataset of surface soil geochemistry from residential properties spread across the city.
METALS
5 The term ‘metal’ is used here to refer to the chemical elements that were analyzed in St. John’s soils, although As is technically a metalloid of the Group 5A elements and exhibits both metallic and nonmetallic properties. Many metals are necessary to plants and other organisms below a certain threshold but become toxic when the threshold is exceeded (Facchinelli et al. 2001; Lindh 2005). For instance, essential metals such as As, Co, Cr, Cu, V, and Zn are required in the range of a few micrograms to milligrams per day. In general, metals are toxic to humans because of the strong affinity of their cations (e.g., Pb2 +) for sulphur. Pb interferes with sulfhydryl groups that occur in enzymes that control critical metabolic reactions in the human body (Baird and Cann 2005).
6 Bedrock weathering results in metal input to soils, where they may persist for a long time due to their non-biodegrad-ability. The levels of some metals in the environment are significantly elevated by human activities, particularly in urban and industrial settings, resulting in heightened exposure risk for residents (Grzebisz et al. 2002). To discriminate anthropogenic pollution from natural sources, metals should be present in the environment at relatively high concentrations, have multivariate relationships different from elements of natural origin and display spatial patterns related to pollution sources (Zhang 2006).
Soil Quality Guidelines
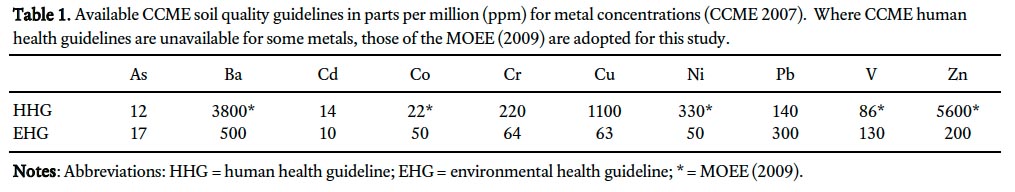
7 Many factors influence whether a metal will be toxic to a particular organism; these include but are not limited to: chemical form, concentration, mobility, behaviour in the environment, bioavailability, acidity, soil texture and mineral composition. The Canadian Council of Ministers of the Environment (CCME) has produced soil quality guidelines for the protection of the environment and human health (Table 1; CCME 2007). These guidelines are recommended concentrations that should result in negligible risk. If the guidelines are exceeded additional work is required to determine whether a significant risk exists. The human health guideline is the soil metal concentration at which no appreciable human health risk is expected upon exposure. The derivation of the guideline takes into account background exposure from air, water, soil, food and consumer products and involves defining scenarios for a sensitive receptor (child or adult) and specific pathways of exposure (CCME 2007). It is adapted for various land use categories, including agricultural, residential, commercial and industrial. The environmental health guideline is based on an assessment of physical and chemical properties, sources and emissions, distribution in the environment, toxicity, and existing guidelines and standards for each metal. Ecological toxicity data are considered to ensure the guideline protects a wide variety of organisms.
8 Metals were chosen for analysis in this study based on the availability of CCME soil quality guidelines (Table 1). The ten metals selected are: As, Ba, Cd, Co, Cr, Cu, Ni, Pb, V, and Zn. As the soil quality guideline is intended to protect both environmental and human health, the lower of the two is the recommended guideline for any land use category. Where the CCME has not specified a human health guideline for a specific metal, the Ministry of Environment and Energy (MOEE) (Government of Ontario) human health guideline for that metal was adopted in this study (Table 1; MOEE 2009).
 Display large image of Table 1
BEDROCK GEOLOGY AND TILL GEOCHEMISTRY
9 Soils uncontaminated by anthropogenic input should inherit their mineralogical and geochemical characteristics from the underlying geology. Metal concentrations in the local bedrock, and in the case of St. John’s, glacially transported sediments (e.g., till), should therefore be an estimation of naturally occurring or background levels in the soil. A major challenge for the identification of background concentrations in urban geochemical studies is the fact that urban soils are typically disturbed by human activities or imported into the city from surrounding areas, and may not exhibit the natural stratification found in undisturbed areas (Wong et al. 2006).
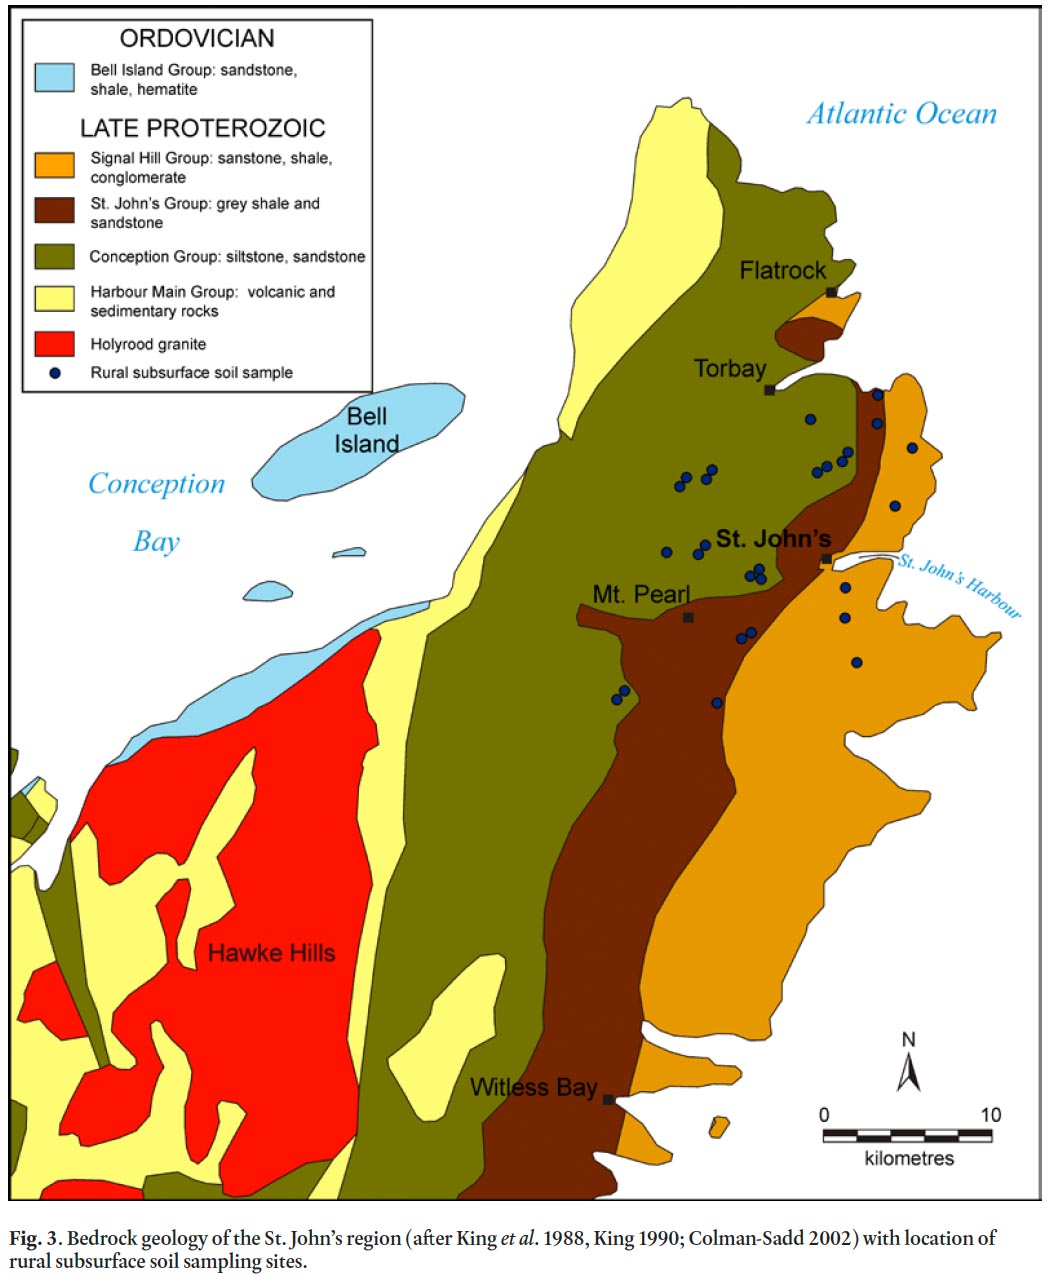
10 The Avalon Peninsula of eastern Newfoundland is part of the Avalon Zone, a major tectono-stratigraphic zone of the Appalachian orogen (King 1990). Locally, the Avalon Zone consists of a thick Precambrian succession including volcanic and sedimentary (Harbour Main Group), turbiditic (Conception Group), basinal-deltaic (St. John’s Group), and molasse-like clastic rocks (Signal Hill Group; Fig. 3; King et al. 1988). Initial deformation of these rocks occurred during the Avalonian orogeny and was followed by regional deformation and metamorphism during the mid-Palaeozoic Acadian orogeny. Granitoid rocks of the Holyrood Intrusive Suite intruded the volcanic rocks during the late stages of the Avalonian orogeny (Krogh et al. 1983, 1988; King et al. 1988, 1990).
 Display large image of Figure 3
11 The thick marine sequence of mainly green, siliceous sedimentary rocks of the Conception Group underlies the western part of the City of St. John’s (King 1990). The St. John’s Group, a marine sequence of dark grey shale and sandstone, conformably overlies and outcrops to the east of the Conception Group and underlies much of the older (i.e., downtown) part of the city. Conformably overlying the St. John’s Group is the late Precambrian to early Palaeozoic Signal Hill Group that forms a thick alluvial-plain sequence that underlies east St. John’s (King 1990).
12 The Avalon Peninsula was glaciated during the late Wisconsinan glacial episode that reached its maximum around 18,000 years ago. During deglaciation a northeastward ice flow across St. John’s originated from the Hawke Hills—Witless Bay area (Fig. 3; Batterson 1984; King 1990; Catto and St. Croix 1998). Glacial deposits (generally <2 m thickness in the study area) therefore contain both local and erratic rock types, including Holyrood granite and Harbour Main Group volcanic and sedimentary rocks (Catto and St. Croix 1998).
13 Mineral soils in the region belong to two major groups: podzol and gleysol (Heringa 1981). Podzols are more common; they are thin (<0.5 m) and acidic and first developed under a forest vegetation dominated by fir, spruce and birch (Page 1971; Heringa 1981; King 1990). The gleysols formed under anaerobic conditions in drainage systems supported by hydro-phytic vegetation (Heringa 1981).
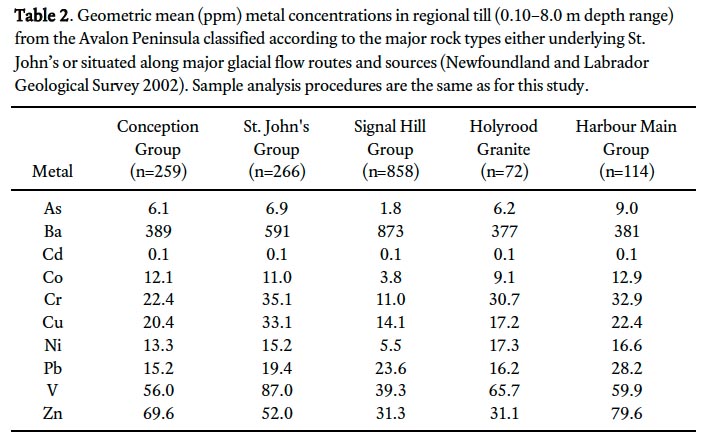
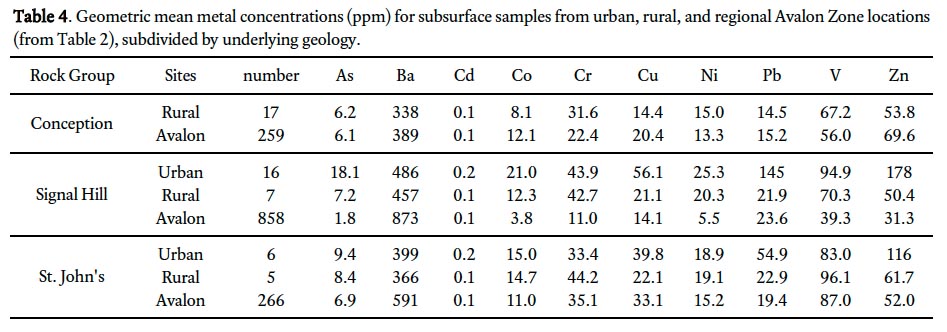
14 The Newfoundland and Labrador Geological Survey reported till geochemistry (total metal content) from above all major rock groups of the Avalon Peninsula (Newfoundland and Labrador Geological Survey 2002). In this dataset distinct variations occur in the geometric mean concentrations of metals in till overlying each rock type (Table 2). For example, the geometric mean concentrations of Pb in till overlying the Conception and St. John’s groups are 15.2 and 19.4 ppm, respectively, whereas overlying the Harbour Main Group the geometric mean concentration is 28.2 ppm. For the most part, till samples overlying the St. John’s and Harbour Main groups have elevated metal concentrations (i.e., As, Co, Cr, Cu, Pb, V, and Zn) compared to other rock groups (Table 2).
 Display large image of Table 2
SAMPLE COLLECTION AND ANALYSIS
15 The soil samples available for this study were collected in two stages. In the first stage (2003), a pilot sampling program was undertaken to gain an understanding of the range of metal levels in soils in St. John’s (Bell 2003). A total of 260 soil samples were collected from public parks, school properties, playgrounds, backyards and roadsides. Individual samples were not intended to be representative of the properties sampled; rather, collectively they provided a preliminary assessment of general soil-metal levels in the city.
16 In the second stage (2004–2005), soil samples (n = 1231) were collected from residential properties only. Neighbour-hood areas (n = 95), as defined by the Community Accounts information system of the Newfoundland and Labrador Statistics Agency (www.communityaccounts.ca), were chosen as the spatial sampling unit, an approach that roughly followed that of Mielke (1994) and United States Environmental Protection Agency guidelines (US EPA 2000). Each neighbourhood represents a population of ca. 1000, and a minimum of three houses were sampled in each neighbourhood. An opportunistic sampling method was used with some effort made to spatially distribute the sample locations within each neighbourhood (Campbell 2008). Surface soil samples were also collected from urban-rural transects to establish soil-metal levels away from urban sources and from the subsurface in both urban and rural settings to determine naturally occurring background levels of soil metals.
17 Multiple soil samples were taken from each residential property, including where possible one sample from within 5 m of an adjacent road (roadside), within 1 m of the foundation of the house (dripline), and in an open area of the property away from buildings and roadside (ambient). Samples were not composited for individual properties as in other Canadian soil contamination studies (e.g., Hilts et al. 2001; Rasmussen et al. 2001; MOE 2002; Lambert and Lane 2004; Government of New Brunswick 2005), but rather each sample was analysed separately to test whether sources and pathways of metals in soils could be revealed through a strategic sampling program (Bell et al. 2010).
18 The combined soil dataset was filtered to remove samples with obvious signs of localized pollution (e.g., nails in soil sample, adjacent to pressure-treated wood) or ambiguous site type (not exclusively roadside, dripline or ambient). The final data-set (Fig. 1, n = 997 soil samples) therefore should reflect broad trends and patterns in urban pollution sources.
19 Approximately 500 g of soil was sampled using a plastic trowel and stored in a paper sample bag. Aſter each soil sample the trowel was rinsed with water and wiped off. Most samples were taken at the surface (0–2 cm) of bare soil, whereas others were collected from immediately below the sod layer at up to 10 cm depth. Duplicate samples were taken at every tenth site. Sample analysis was performed at the Geochemical Laboratory of the Newfoundland and Labrador Geological Survey in St. John’s using inductively coupled plasma-emission spectrometry (ICP-ES) and following standard methods and protocols described in Finch (1998). The digestion process completely dissolved samples and generated total metal concentrations, with the exception of Cr from chromite and Ba from barite (Campbell 2008). Five millilitres (ml) of concentrated HCL, 15 ml of concentrated HF and 5 ml of 1:1 perchloric acid were added to a gram of soil. Following addition of the acids the samples were evaporated to dryness on a hotplate at 200°C. Then the beakers were half filled with 10% HCl and placed on a hot plate at 100°C. When the samples were completely dissolved, they were cooled and transferred to 50 ml volumetric flasks. Finally, 50 g/L boric acid was used to complex any residual HF. Every twentieth soil sample in the laboratory was split and both parts analyzed to evaluate the reproducibility of the analysis. Standard reference materials were also analysed with each sample run (Finch 1998). Analysis of laboratory and field duplicate soil samples and laboratory standards indicated that laboratory methods were accurate and precise. Both the laboratory (n = 75, r = 0.717 (Co) to 0.982 (Cr), p = 0.000) and field (n = 104, r = 0.924 (As) to 0.999 (Zn), p = 0.000) duplicates are highly correlated.
DATA ANALYSES
20 Two indices are used to assess metal concentration in St. John’s. The Contamination Index incorporates all metals that exceed guidelines and the amount by which these guidelines are exceeded in each sample (Backman et al. 1998). An Enrichment Factor (EF) assesses the degree of metal contamination above naturally occurring levels and measured the degree of anthropogenic input (Yongming et al. 2006). Cluster Analysis identifies statistical associations between metals and may be used to trace the sources and pathways of contaminants (Siegel 2002).
Contamination Index
21 One approach to assessing and visualizing cumulative metal contamination on a landscape is to portray the degree of contamination in each sample using a contamination index (C d ; Backman et al. 1998). The index sums up the combined influence of the selected metals by sample and when mapped may identify areas of concern or ‘hot spots’ of multi-metal contamination on the landscape. C d is calculated according to the equation of Backman et al. (1998):
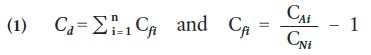
21 where, C f i is the contamination factor for the i–th metal, C Ai is the analytical value of the i–th metal, and C Ni is the guideline value for the i–th metal.
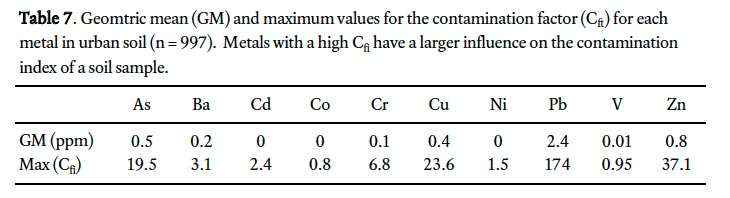
22 The index normalizes each metal against its acceptable guideline value to produce a contamination factor (C f i ). The C f i is centered on zero, with values greater than zero exceeding calculation of C d . The C f i for each metal in a sample is summed to produce the C d value for the sample. A metal with a high C f i will have a larger influence on the index value of a sample than metals with lower C f i values.
Enrichment Factor
23 An enrichment factor is used to differentiate between anthropogenic and natural sources of metals. A common approach is to normalize the concentration of a selected metal against that of a reference element from the same sample. A reference element is assumed to be derived entirely by lithologic weathering (Yongming et al. 2006). For example, scandium (Sc) is immobile in most geologic processes, is non-volatile, and has almost no industrial uses; therefore, it is considered to be an excellent reference element (Lee et al. 1994; Youngming et al. 2006). Other studies have used Al (Trefry et al. 1985; Schropp et al. 1990), Cr (McMurtry et al. 1995), Fe (White and Tittlebaum 1985), Li (Loring 1990), Mn (Loska et al. 1997; Yongming et al. 2006), and Ti (Horowitz et al. 1988) as reference elements.
24 The metal enrichment factor (EF) is calculated as follows (Lee et al. 1994; Sutherland 2000; Yongming et al. 2006):
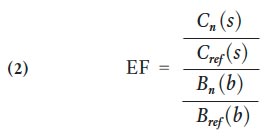
24 where, C n(s) and C ref (s) are the concentrations of the selected metal and the reference metal in the soil sample, respectively, and B n(b) and B ref (b) are the background concentrations of the selected metal and the reference metal, respectively.
25 The EF value can be used to apportion the concentration of a given metal (C total) to either natural (C natural) or anthropogenic (C anthropogenic) sources as follows:
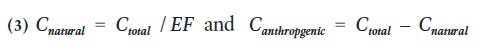
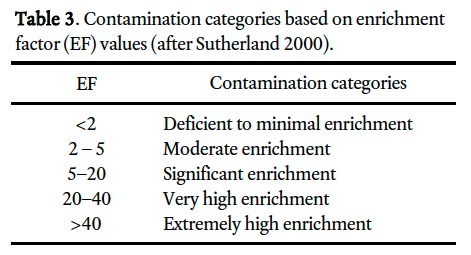
26 Yongming et al. (2006) suggested that EF values close to 1 indicate a crustal origin, whereas those >10 are non-crustal, or presumably from an anthropogenic source. On the other hand, Sutherland (2000) and Loska and Wiechula (2003) divided EF values into five contamination categories, ranging from deficient or minimally enriched (<2) to extremely enriched (>40), to help determine the degree of metal contamination (Table 3). Lee et al. (1994) applied a more conservative categorization of EF values, treating EF values <7 as indicative of crustal or natural sources and >10 from anthropogenic sources.
Cluster Analysis
27 The enrichment and contamination indices described above provide an effective means to identify areas that have elevated metal concentrations with reference to background levels or recommended guidelines; however, they do not identify the sources of metal enrichment in soils nor identify a pollution source. Statistical methods that highlight associations between metal occurrences and concentrations can provide a better understanding of the underlying mechanisms responsible for geochemical patterns (Siegel 2002). Those metals that are statistically associated can be compared with the metal content of probable pollution sources.
28 Cluster analysis is a technique commonly used in environmental geochemical studies to group chemical elements (i.e., metals) according to common characteristics. In this study, hierarchical agglomerative cluster analysis grouped individual metals into successively larger clusters based on a measure (correlation coefficient) of their similarity across soil samples (Johnson and Wichern 2007). The decision to group metals followed Ward’s hierarchical clustering method (Swanson et al. 2001; Johnson and Wichern 2007; Templ et al. 2008). A dendrogram is used to graphically display the hierarchical cluster analysis results to visually assess the cohesiveness of the clusters.
29 Standardization of variable measurements is a common strategy in geochemical studies when dealing with widely different concentration ranges (Johnson and Wichern, 2007). The concentration of metals in this study varies by orders of magnitude and hence data standardization was performed using mean and variance values, according to the following equation (Skeppström and Olofsson 2006; Johnson and Wichern 2007):
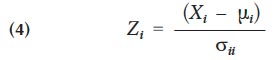
29 where Z i is the standardized metal value, X i the raw metal value, √ i the arithmetic mean for the metal, and σ ii the variance of the metal values.
30 Finally, although cluster analysis does not require normally distributed data, it is recommended that heavily skewed data undergo transformation prior to analysis (Templ et al. 2008). A simple logarithm transformation was used to normalize each variable (Templ et al. 2008).
RESULTS
Background Metal Concentrations
31 The geometric mean metal concentrations for subsurface soil samples from urban locations in St. John’s (n = 22; 0.25– 1.9 m depth range) are at least double the concentration for 5 of 10 metals (As, Cd, Cu, Pb, and Zn) relative to surrounding rural locations (Fig. 3; n = 29; 0.25–1.3 m depth range; Table 4). Samples from sites overlying the Signal Hill Group have the highest number of elevated metals (n = 9) compared with sites from above the St. John’s Group, with Pb and Zn having between 1.5 and 2.5 times higher geometric mean values (Table 4). Based on these results, together with evidence of human disturbance at some urban subsurface sampling sites (Campbell 2008), metal concentrations from urban subsurface soils were not chosen to represent naturally occurring background values in this study. In contrast, rural subsurface samples generated geometric mean values for metal concentrations similar to regional till values (Table 4), and are considered to be broadly representative of background levels in the St. John’s region; consequently, the rural subsurface samples were used in calculations of metal enrichment factors for urban sites.
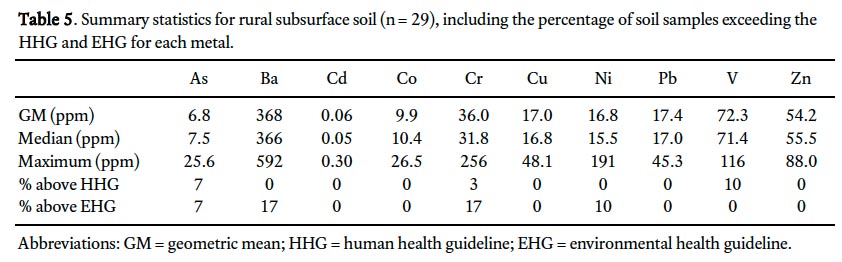
32 Between 3 and 17% of rural subsurface soil samples exceed CCME/MOEE soil quality guidelines for 5 metals: As, Ba, Cr, Ni, and V (Tables 1 and 5). The human health guidelines for As, Cr and V are exceeded in 7%, 3% and 10% of samples, respectively, whereas between 7 and 17% of samples exceed the environmental health guidelines for As, Ba, Cr and Ni (V does not exceed the environmental health guideline in any samples). These exceedances occur exclusively in samples from above the Conception and Signal Hill groups.
 Display large image of Table 3
 Display large image of Table 4
Urban Surface Soil Metal Concentrations
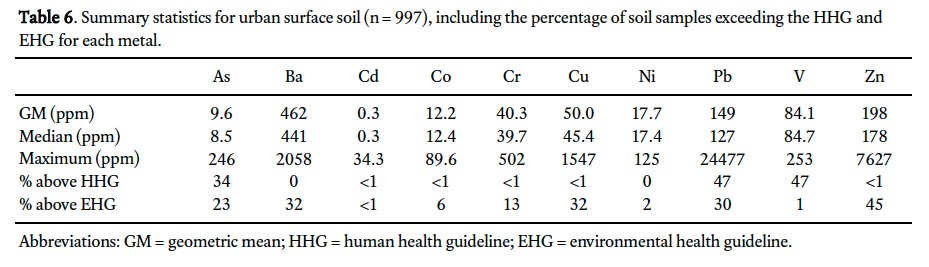
33 Comparison of the geometric mean of urban surface (Table 6) and rural subsurface (background; Table 5) soil geochemistry indicates elevated concentrations for all 10 metals in surface soils in St. John’s, with particularly notable differences for Cd (×5), Cu (×3), Pb (×8.6), and Zn (×3.7). Predictably, all of these metals except Cd (<1%) have significant percentages (30–45%) of samples that exceed CCME/MOEE environmental health guidelines. Similarly, those metals that had concentrations above enviornmental health guidelines (7–17%) in background samples (i.e., As, Ba, Cr, and Ni) also had significant guideline exceedances in surface soil samples (13–32%), except Ni (2%; Tables 5 and 6). Although the geometric mean concentration for Co is elevated by only 20% in urban surface samples compared with background, 6% of St. John’s soil samples exceed the envionmental health guidelines for Co and <1% exceed the human health guidelines. Only three metals – As, Pb, and V – have concentrations that exceed the human health guidelines to any significant degree (<1% of samples from other metals exceeded guidelines) in St. John’s soils; notably, however, the percentage of samples with exceedances were 34%, 47%, and 47%, respectively.
 Display large image of Table 5
 Display large image of Table 6
Contamination Index
34 The geometric mean C fi for each metal ranged from 0.0 (Cd, Co, and Ni) to 2.4 (Pb; Table 7). Overall, Pb dominates the C d for most soil samples but there are significant contributions from As, Cu, and Zn. Contamination index categories were chosen based on the standard deviation (σ) around the mean C d value (<0.5, 0.5–1.5, 1.5–2.5 and >2.5); the category ranges are 0–6.5, 6.5–14.5, 14.5–22.5, 22.5–105.5. Samples with large standard deviation represent more heavily contaminated soil relative to the other samples. The spatial pattern of C d plotted by sample location shows that the highest index values are roughly concentrated in the downtown; that is, the urban area marked as developed by 1950 on Fig. 2. In general, this area contains most of the high index samples that comprise the two highest index categories (>14.5). Outside this downtown core, C d values are generally less than 6.5 or within 0.5σ of the mean (Fig. 2).
 Display large image of Table 7
Enrichment Factor
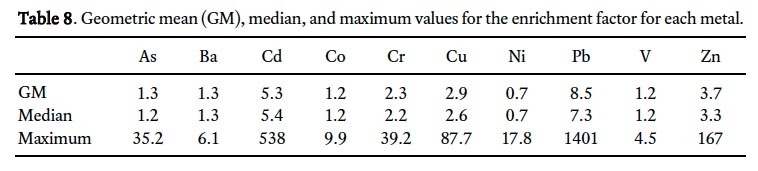
35 Scandium was used as the reference element to calculate EF values in this study. There was little or no difference between the geometric mean Sc concentrations in rural subsur-face (background) samples (11.6 ppm; n = 29) and the surface soils of St. John’s (11.0 ppm; n = 997), supporting the choice of Sc as the reference element. The geometric mean for the EF varies from 0.7 (Ni) to 8.5 (Pb), with values for 7 of 10 metals below 3 (Table 8). According to the classification categories of Sutherland (2000) (Table 3), Pb and Cd occur near the lower boundary of the significant enrichment (EF 5–20) category with geometric mean EF values of 8.5 and 5.3, respectively (Table 8). Chromium, Cu and Zn are on average only moderately enriched (geometric mean EF 2-5), whereas the other metals (As, Ba, Co, Ni, and V) are locally deficient to minimally enriched (geometric mean EF <2).
 Display large image of Table 8
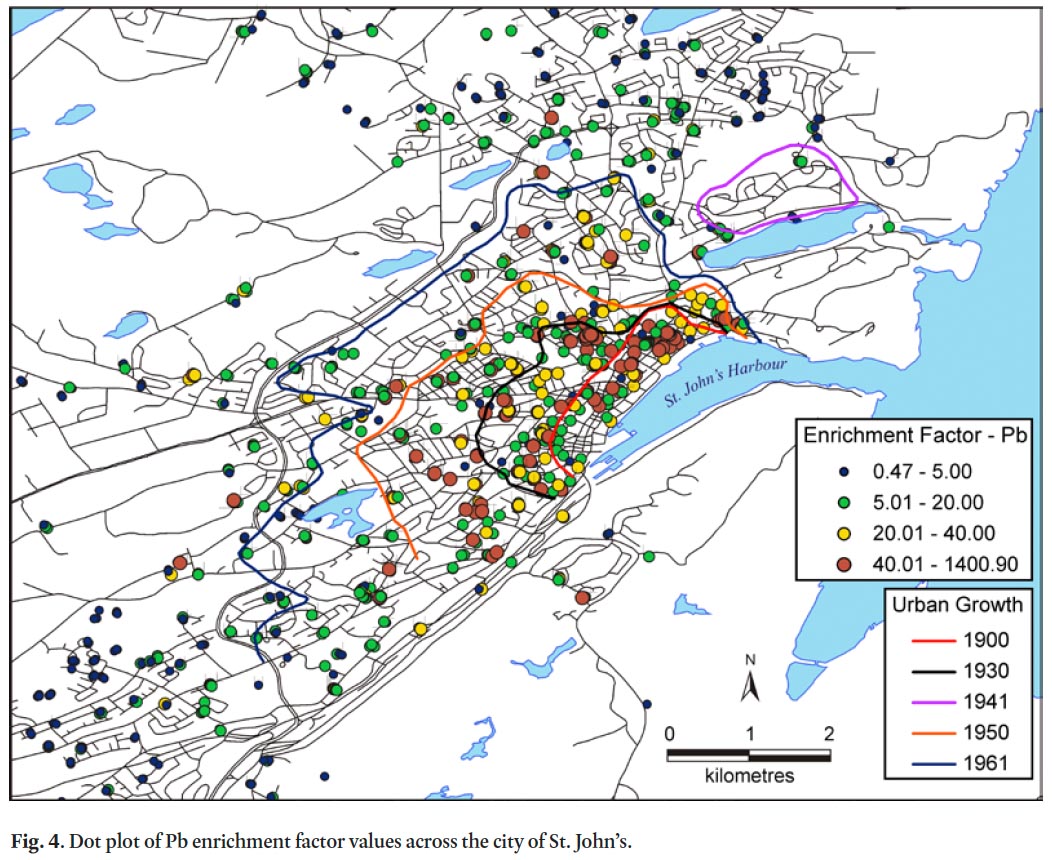
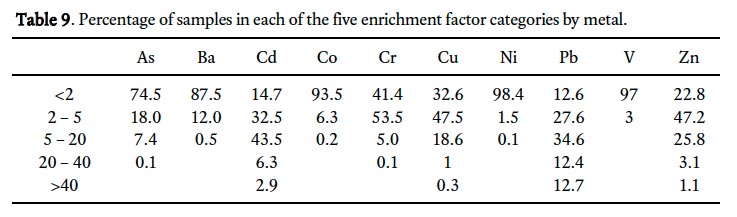
36 The spatial pattern of Pb enrichment factors shows a high concentration of enriched sample sites in the downtown core (Fig. 4), largely mimicking the pattern for contamination index (Fig. 2). Many of these downtown samples are classified as very highly to extremely highly enriched (EF >20) and represent 25% of all soil samples in the study (Table 9, Fig. 4). Large parts of the city outside of the downtown core have moderately enriched sites (EF 2–5). In comparison, the spatial pattern of the C d enrichment factors also has its highest values in the downtown core, but in general there is a much more even distribution of EF categories across the city with 75% of samples either moderately or significantly enriched (Table 9, Fig. 5).
 Display large image of Figure 4
 Display large image of Table 9
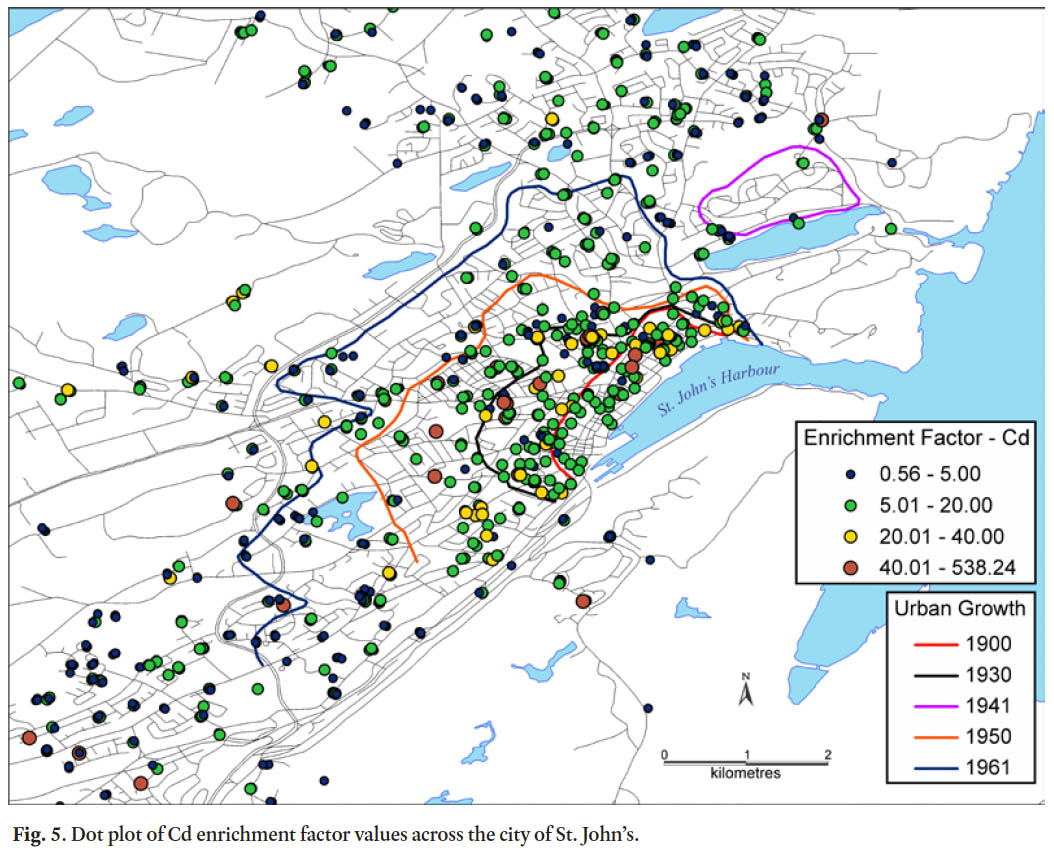 Display large image of Figure 5
37 A closer examination of geometric mean EF values for each metal by sample category reveals a spatial pattern of enrichment at the residential property level (Fig. 6). Lead, Cd and Zn have highest enrichment at dripline sites followed by ambient and roadside sites. Chromium and Cu are slightly more enriched at roadside sites followed by dripline and ambient sites. In contrast, As is slightly more enriched in ambient and dripline sites. The remainder of the metals have low EF values that are more or less equally divided among the site categories.
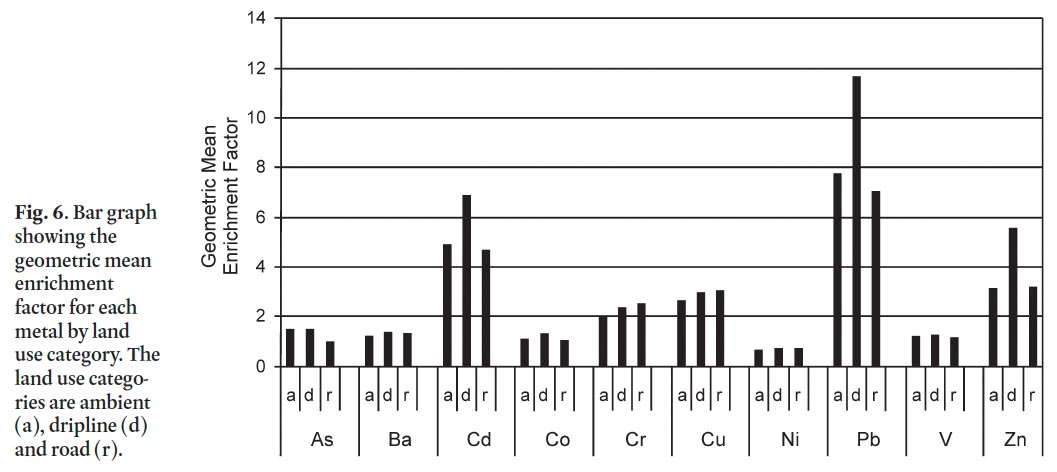 Display large image of Figure 6
Cluster Analysis
38 Prior to cluster analysis and following logarithmic transformation, Co, Cr, Ni, and V concentrations were symmetrically distributed; As, Ba, Cd, and Cu were only weakly skewed, and Pb and Zn remained strongly skewed. During the hierarchical clustering procedure Pb and Zn and Cr and Ni merged to form two distinct clusters representing a high level of similarity across the samples (Fig. 7). At slightly lower similarity levels, Cu joined the Cr-Ni cluster, and Cd the Pb-Zn cluster to form the two strongest and most distinct metal associations among the group of ten. At lower similarity levels, As and Co form a single cluster that subsequently merges with a grouping that combines the Cr-Cu-Ni cluster with V. (Fig. 7). Barium concentrations have the weakest association with the other metals across all the samples.
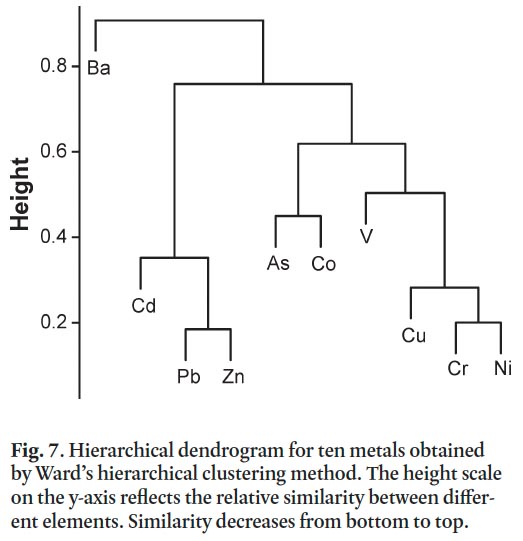 Display large image of Figure 7
DISCUSSION
The Urban Geochemical Landscape
39 Residential soils in St. John’s have elevated concentrations above background levels (rural subsurface) for all ten metals with CCME/MOEE soil quality guidelines. Three of the four metals that are the most elevated (Pb>>Cd>Zn>Cu; Table 8) are also among the four metals that contribute most strongly to the contamination index (Pb>>Zn>As>Cu; Table 7). Lead, Cd, Zn, and Cu also have the highest enrichment factors with 60, 53, 30 and 20%, respectively, of surface soil samples in St. John’s classified as significantly to extremely highly enriched. For the most part, soils contaminated with these metals are concentrated in the oldest parts of the city, around the downtown core, where many properties predate the 1930s, though others may be several decades younger. Lead, Zn and Cd are most highly enriched at dripline sites on residential properties, though ambient and roadside sites also have moderate enrichment (Fig. 6).
40 The results of the cluster analysis suggest that two distinct groups of metals are commonly associated together in surface soil samples (Fig. 7). One group that includes Pb, Zn and Cd is commonly found in soils at dripline sites (Fig. 6), especially in areas of the downtown developed prior to the 1950s (Fig. 4), where weathered paint is believed to be a major contaminant source (Bell et al. 2010). The age of these properties corresponds to the period when Pb concentrations were highest in paint, up to 50% by weight (CMHC 2007). Paint may also contain extremely elevated Zn concentrations (Mielke et al. 2000), and Cd is added to paint as a pigment component (CCME 1999b).
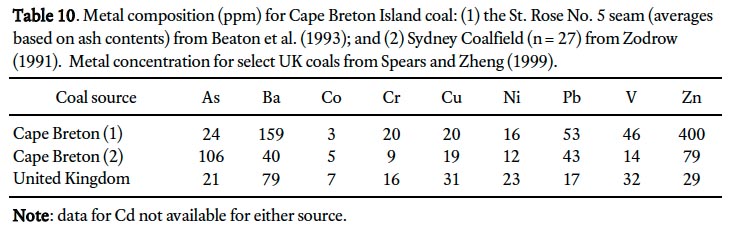
41 Lead, Zn, and Cd are also significantly enriched in roadside sites in St. John’s. Similar patterns were also documented for New Orleans, where vehicular traffic, both past and present, is considered to be an important metal source for adjacent soils (Mielke et al. 2000). Lead was used in Canadian gasoline up until the 1980s, Zn is a major component of rubber tires, and Cd is both a trace contaminant of the Zn that is used in tires and part of the alloys used to harden engine parts (Mielke et al. 2000). All three metals also contribute to enriched ambient sites in St. John’s, where coal combustion products and ash dumping are believed to be major sources of soil Pb at sites distal to roads and walls on high-density downtown properties (Bell 2003; Campbell 2008). Coal was a major heating fuel in St. John’s up until the 1960s when oil became more popular (Poole and Cuff 1994). From 1838 to 1948 St. John’s residents burnt almost 80% Cape Breton Island coal, the remainder from the United Kingdom and the United States of America (Newfoundland Customs Returns for the Years Ended 1835–1948). Coal from Cape Breton Island has elevated Pb and Zn compared to UK coal (Table 10).
 Display large image of Table 10
42 For the second group of clustered metals – Cr, Ni and Cu – Cr and Cu are moderately enriched in residential soils and Ni is minimally enriched. Chromium and Cu are slightly more enriched in roadside samples compared to dripline and ambient sites. All three metals are components of a wide range of alloys that are associated with vehicles; however, their pervasive presence at all residential sites may also in part be associated with their common occurrence in paint and their naturally occurring background concentrations (Tables 4–6).
43 Arsenic does not display strong associations with other metals in the cluster analysis (Fig. 7), which is surprising particularly for ambient sites where Cape Breton Island coal is believed to be a significant source. For instance, Cape Breton coal may contain elevated levels of As, Pb and Zn (Table 10) but only the latter two metals are closely associated in the cluster analysis.
Human Health Hazards
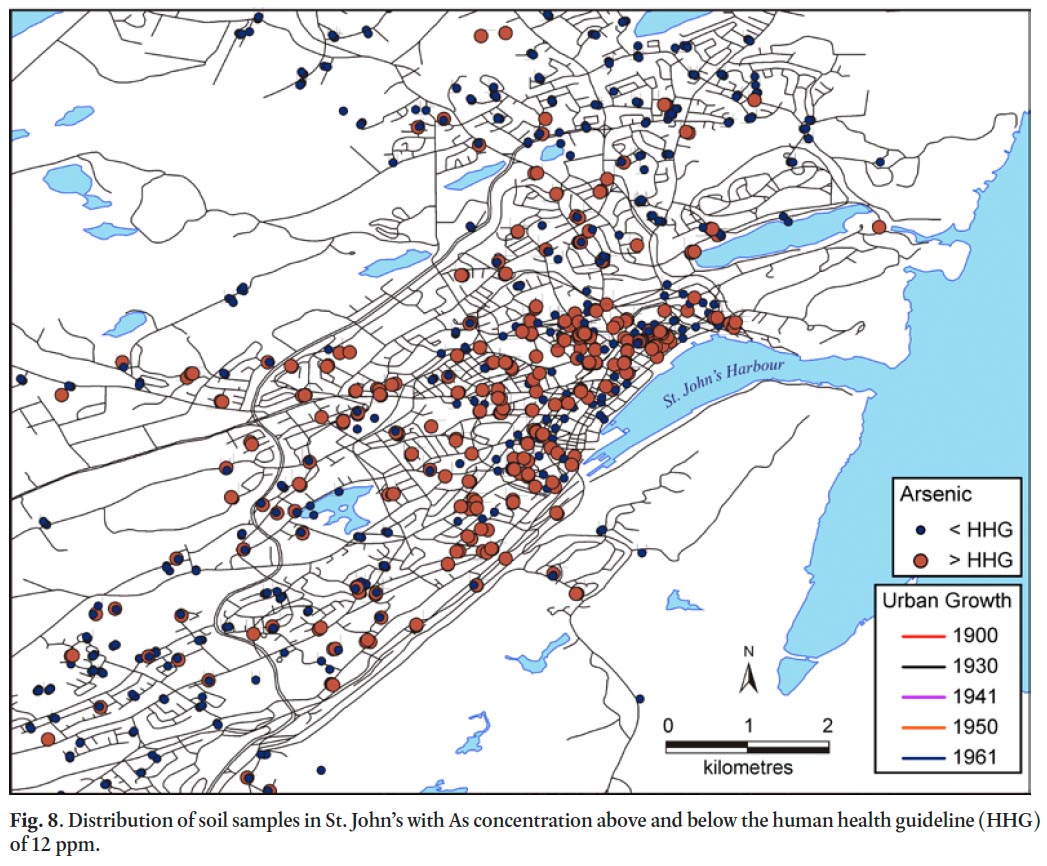
44 Only three metals – As, Pb and V – have concentrations that exceed the human health guidelines in greater than 1% of soil samples taken in St. John’s; however, between one-third and one-half of all soil samples collected in this study exceed environmental health guidelines for these metals (Table 6). Downtown areas of St. John’s have soil-Pb levels well above those from Canadian cities of equal or greater population size (e.g., Ottawa, Ontario, Rasmussen et al. 2001; Victoria, British Columbia, Bowman and Bobrowsky 2003) and closer to much larger North American cities (e.g., New Orleans, Louisiana; Mielke et al. 2000). Although almost half the residential soil sampled in St. John’s has Pb concentrations exceeding the human health guideline of 140 ppm, of greater concern are the exceptionally high concentrations (>1200 ppm) that tend to occur along the dripline of houses built before the 1960s and anywhere on residential properties that date to the 1920s or earlier (Bell et al. 2010). Risk assessment predictions suggest that while the wider St. John’s community may not be at risk of adverse health effects, there may be an increased risk for children living in pre-1960s housing that for the most part is concentrated downtown and in surrounding neighbourhoods (Campbell 2008). It is estimated, for instance, that 8 to 21% of children living in housing built before 1949 in St. John’s may exceed the current recommended blood-Pb level guideline of 10 g/dL (Campbell 2008). Young children are more susceptible to Pb exposure because of hand-to-mouth behaviour and their developing nervous systems, while the neuro-developmental effects of increased body-Pb burden in children are linked to decreased IQ scores and other intelligence and developmental deficits (ATSDR 2007). Because of this public health concern, a comprehensive biomonitoring study is underway in St. John’s to determine the extent of Pb exposure in young children across a range of housing age categories (www.LeadNL.ca).
45 Although As is on average in the deficient to minimally enriched EF category, 34% of all soil samples exceeded the human health guidelines for As in residential soil, mostly concentrated in the downtown core in areas developed prior to 1961 (Table 6, Fig. 8). The human health guideline for As is 12 ppm, 2.4 ppm higher than the geometric mean concentration in surface soils of St. John’s (Table 6) and 5.2 ppm above background levels (Table 5). Till samples from the Avalon Peninsula show that As is naturally elevated (7% of background samples exceed the human health guideline), especially overlying the St. John’s Group, with a geometric mean of 6.9 ppm (maximum value = 246 ppm); (Table 2). On average, 2.3 ppm of As has been added to the soils of St. John’s through anthropogenic processes, based on Equation 3 above, potentially from past coal combustion and ash disposal. Because the mobility and bioavailability of As in soil depends on its form, and the physical and chemical characteristics of the soil (Liu and Cai 2007), more research is needed to assess the exposure risk and potential health impacts of these elevated As levels on pre-1960s properties.
 Display large image of Figure 8
46 The human health guideline for V of 86 ppm is based on the MOEE soil guideline. MOEE guidelines are calculated based on high frequency, high intensity human exposure (both soil ingestion and dermal contact, and including children and pregnant woman) to soil on a variety of non-industrial land uses from residential to agricultural (MOEE 2009). In Ontario, however, where the background soil concentration (86 ppm) of V is above the calculated guideline (39 ppm), the human health guideline defaults to this higher value (86 ppm). The geometric mean for V in rural subsurface soil in St. John’s varies between 67 and 96 ppm, depending on the underlying bedrock type (Table 4). Because the geometric mean V concentration in urban surface soils is 84 ppm, 47% of the soil in St. John’s exceeds the MOEE human health guideline for V.
47 Vanadium is added to special steels (e.g., titanium alloys) and is used as a catalyst in the chemical industry (CCME 1999b), but neither is expected to be a major source to the soil of St. John’s. Food contains low amounts of V, but it represents the major exposure source for the general population. The toxicity of V compounds, however, is low with most toxic effects causing irritation of the eyes and the upper respiratory tract (Barceloux 1999). These effects are mostly observed in people exposed to V in work environments (Barceloux 1999).
48 The remaining metals that have very low (<1%) exceedances of the human health guidelines include Cd, Co, Cr, Cu, and Zn (Table 6). Although enrichment values suggest a significant input of Cd into St. John’s soils, the fact that natural levels of Cd in the soil are so low (geometric mean = 0.06 ppm; Table 5) means that significant enrichment can occur without exceeding the human health guideline of 14 ppm (Table 1). In the case of Zn, and to a lesser degree Cu, the human health guidelines are very high – 5600 and 1100 ppm, respectively – compared with the geometric mean values for St. John’s soils (198 ppm and 50 ppm, respectively) and hence soil is not considered an exposure risk for city residents. Both these metals are essential micronutrients required for optimal functioning of biological processes and organs in humans (Siegel 2002).
Environmental Health Hazard
49 Five of the ten metals (i.e., As, Ba, Cu, Pb, and Zn) have concentrations exceeding their environmental health guidelines in 20% or more of the samples. In some cases, these metals are essential for both plants and animals (e.g., Cu, Zn; CCME 1999c, e; Bradl 2005), whereas others are considered non-essential (e.g., Pb; CCME 1999d; Bradl 2005) or phytotoxic at relatively low concentrations (e.g., As, as low as 10 ppm; Bradl 2005). The toxicity of these metals in plants is mainly dependent on chemical form, soil properties and environmental conditions (e.g., plant sensitivity to Ba is heightened in the absence of Ca; CCME 1999a) and has largely been measured in the context of agricultural crop yields (Table 11). For example, at soil-Ba concentrations of 500 ppm and 2000 ppm, barley yields decline by 38% and 63%, respectively (Chaudry et al. 1977) and 50% reduction in seed yield of turnips is documented in soil with Zn levels of 50 ppm or more (Sheppard et al. 1993; CCME 1999e). Chlorosis, an abnormally yellow color of plant tissues resulting from partial failure to develop chlorophyll, is an indication of Zn toxicity and may result in depressed plant growth; it occurs at soil concentrations >100 ppm, well below the median value of 178 ppm for St. John’s soils (Table 6, CCME 1999e; Bradl 2005).
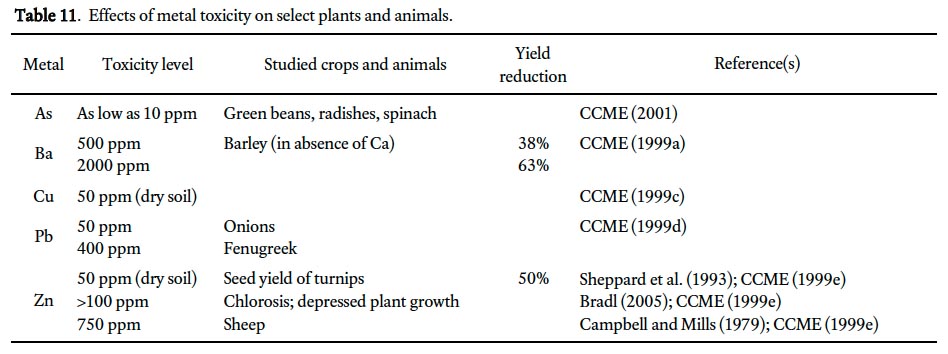
50 Lead poses a more significant toxic threat to mammals and birds than plants and exposure occurs through ingestion of soil when birds and herbivores feed (CCME 1999d). Lead is a nonspecific toxin to wildlife and livestock, which inhibits many enzymatic activities and may adversely affect the haematological and central nervous systems and reproduction function (Bradl 2005). In contrast, adverse effects of Zn on wildlife and livestock is less of a concern than on plants but have been observed in sheep at soil concentrations of 750 ppm (Campbell and Mills 1979; CCME 1999f).
51 Although there is limited commercial gardening in downtown areas of St. John’s, a recent survey suggested that roughly 10–15% of homeowners consume garden produce from their own properties (Campbell 2008). Although reduced crop yield and quality may be a concern for some gardeners, the ingestion of metals through locally grown produce and the increased bare soil exposure on residential properties due to phytotoxic effects on plant cover are a potential public health concern for city residents, especially in neighbourhoods where metals exceed environmental health guidelines. The bio-concentration of metals in edible plants would heighten this concern but actual uptake and location of accumulation in different plants and soil concentrations are poorly understood. For instance, plants growing on As-contaminated soil rarely contain greater concentrations than their substrate (i.e., low bio-concentration; CCME 2001), whereas a mean bio-concentration factor of 2.65 was calculated for Cd in different plants and plant tissues (CCME 1996b). A more detailed eco-toxicological assessment is required to properly assess the environmental health impacts of these metals in St. John’s soils.
CONCLUSIONS AND NEXT STEPS
52 Analysis of the urban geochemical landscape of St. John’s indicates that there is anthropogenic enrichment in surface soils of all metals selected for this study. The most highly enriched metals relative to background are Cd, Cu, Pb, and Zn, with only As having background (rural subsurface) levels near guidelines (Tables 1 and 5). Overwhelmingly, metal contamination is greatest in the older downtown core and in large part concentrated along the exterior walls of buildings, although significant contamination is also documented in roadside and open spaces on properties. The patterns of contamination and enrichment rule out a modern industrial source because industrial parks are located away from the downtown on the city periphery. Some metals, for example Pb and As, have only limited usage in our urban environment today and hence their soil concentrations are a legacy of past urban activities and accumulation. The clustering of metals according to their statistical relationship across all samples, together with the pattern of metal contamination of the three sampling locations (i.e., drip-line, roadside and ambient), strongly suggest that weathered paint, vehicular emissions, and coal burning were important sources for the main contaminants in sampled soils. Cadmium, Cu, and Zn are metal additives in paint and vehicle parts, Pb was an important component of paint and gasoline prior to its phase out in the 1970/80s, and Pb and As were by-products of coal combustion when coal was widely used for heating in St. John’s. Although leaded gasoline and leaded paint are no longer widely in use today, the metals that were added to these materials are persistent in the soil long aſter their liberation to the environment and hence persist as potential health hazards for urban residents.
53 The health implications of elevated metals in the soils of St. John’s are not known and demand further research to address public health concerns, especially for those residents living in the downtown core and surrounding neighbourhoods, where soil metal concentrations commonly exceed CCME human health guidelines. Of the three metals (As, Pb, and V) with significant exceedances, Pb and As pose the greatest health risk; the former for its impact on neuro-development in children at low chronic levels and the latter for its carcinogenic effects, especially in its valent form As3 + (Baird and Cann 2005). Current research in St. John’s is attempting to address exposure to Pb for the most vulnerable population – young children – by measuring blood lead levels, assessing exposure levels in residential environmental media, estimating Pb bioaccessibility levels in soils, and sourcing exposure using Pb isotopes.
54 Although elevated As levels in drinking water is a serious global environmental issue (Brinkel et al. 2009) and soil ingestion near agricultural sites using pesticides with As is a serious local health concern, little attention has been paid to soil-As in urban environments where coal-burning was an important urban legacy (Liu and Cai 2007). St. John’s is an ideal location to explore this question further and important first steps would be to confirm the source and determine the form of As in local soils. There is also a database of As concentration in ca. 2000 indoor dust samples from 200 households across a range of housing ages in St. John’s that will provide an exceptional opportunity to explore temporal and spatial associations in As concentration and housing stock, particularly a comparison of housing that pre- and post-dates coal as a widespread heating fuel.
55 St. John’s appears to be an exceptional city in the context of its soil metal burden because unlike others with a similar burden (e.g., Chicago, Illinois, Cannon and Horton 2009; New Orleans, Louisiana, Mielke 1994), it is neither industrialized nor heavily populated, and does not have intensively used transportation networks. Rather, it is a relatively low population port city with small industrial enterprises and a long tradition of coal-heating and row housing with wooden clapboard, not unlike many cities in Atlantic Canada. Do these cities share a similar geochemical legacy as St. John’s? In some cases, there is also an industrial legacy (e.g., Halifax, Nova Scotia; Saint John, New Brunswick) that may increase the soil metal burden. Targeted geochemical mapping to assess the hazard risk seems warranted.
Funding for soil sampling was provided by the Research Advisory Committee of The Janeway Children’s Health and Rehabilitation Centre, the Natural Sciences and Engineering Research Council of Canada, and the Faculty of Arts research grant program, Memorial University. Melissa Putt, Dominique St. Hilaire-Gravel and Stacy Campbell collected soil samples and Chris Finch at the Geochemical Laboratory of the Newfoundland and Labrador Geological Survey supervised the soil analysis. Dr. Joel Finnis, Department of Geography, Memorial University, provided advice on statistical analysis and Dr. Pat Doyle, Environment Canada, read an earlier manuscript draſt. Helpful comments of two journal reviewers are appreciated.