Articles
Radon soil gas in the Halifax Regional Municipality, Nova Scotia, Canada
ABSTRACT
Naturally occurring radon222 is found in measurable quantities in soil gas across Nova Scotia. Next to smoking, exposure to radon is the leading cause of lung cancer. This study identifies relationships between the permeability and composition of the soil, and the geology of the respective bedrock types within Halifax Regional Municipality (HRM). Over 280 radon soil gas samples from 60 sites were collected and analyzed using protocols developed for the North American Soil Geochemical Landscapes Project. This study focused on soil developed on glacial till over three major bedrock types: the Cambrian–Ordovician Goldenville and Halifax groups, and Devonian granite of South Mountain Batholith. All samples contained radon soil gas. Fine-grained leucomonzogranite samples returned the highest mean radon concentration of 51.0 kBq m-3, followed by coarse-grained leucomonzogranite (50.2 kBq m-3), monzogranite (44.3 kBq m-3), slate (36.1 kBq m-3), and metasandstone and Lawrencetown till, respectively 22.5 kBq m-3 and 19.4 kBq m-3. Analysis of the permeability readings was done in four major till types in HRM: granite (3.27 × 10⁻¹² m2), metasandstone (5.84 × 10⁻¹² m2), and slate facies (5.20 × 10⁻¹² m2) of the Beaver River Till (BRT), and Lawrencetown Till (1.18 × 10⁻¹² m2). The soil radon potential index (SRP), which is used to correlate soil gas and permeability readings with indoor radon potential, was applied to data collected for the HRM study area, where over 40% of Nova Scotia’s population resides. The SRP index results show the granite facies of BRT returning the highest mean value of 34.5, followed by the slate facies (27.2) and metasandstone facies (15.1) of the BRT, and Lawrencetown Till (9.1). 1D soil-gas modeling demonstrated that it is unlikely that bedrock radon transport from depth alone can contribute to the concentrations measured at 60 cm; the overlying tills must also be producing radon.
RÉSUMÉ
Du radon (Rn 222) à l’état naturel et en quantités mesurables est observé dans les gaz souterrains partout en Nouvelle‑Écosse. Après le tabac, l’exposition au radon est la deuxième cause de cancer du poumon. Cette étude examine les liens entre la perméabilité et la composition du sol, ainsi que la géologie des divers types de substratum rocheux présents dans la Municipalité régionale d’Halifax (MRH). Plus de 280 échantillons de gaz souterrain de radon provenant de 60 endroits ont été recueillis et analysés selon des protocoles élaborés dans le cadre du projet des paysages géochimiques des sols d’Amérique du Nord. Cette étude a surtout porté sur le sol formé dans le till glaciaire de trois principaux genres de substratum rocheux: les groupes de Goldenville et d’Halifax du Cambrien-Ordovicien, et le granite du batholithe South Mountain, du Dévonien. Tous les échantillons contenaient du gaz de radon souterrain. Les échantillons de leucomonzogranite à grains fins ont produit la plus haute teneur moyenne de radon, soit 51,0 kBq m-3, suivis en cela par les échantillons à grains grossiers de leucomonzogranite (50,2 kBq m-3), de monzogranite (44,3 kBq m-3), d’ardoise (36,1 kBq m-3), et de métagrès et du till de Lawrencetown, dont les teneurs respectives étaient de 22,5 kBq m-3 et de 19,4 kBq m-3. Les valeurs de perméabilité ont été analysées dans les quatre principaux genres de till présents dans la MRH: le granite (3,27 × 10⁻¹² m2), le métagrès (5,84 × 10⁻¹² m2) et le faciès d’ardoise (5,20 × 10⁻¹² m2) du till de la rivière Beaver (BRT), et le till de Lawrencetown (1,18 × 10⁻¹² m2). L’indice de teneur possible de radon dans le sol (SRP) sert à établir une corrélation entre le gaz souterrain et des valeurs de perméabilité, susceptibles de donner lieu à une présence de radon dans l’air intérieur. Cet indice a été utilisé pour l’analyse des données provenant de la zone d’étude de la MRH, où 40 p. 100 de la population de la Nouvelle‑Écosse habite. L’analyse à l’aide de l’indice SRP a établi que le faciès de granite du till de la rivière Beaver présente la teneur moyenne la plus élevée, soit 34,5, suivi en cela par les faciès d’ardoise (27,2) et de métagrès (15,1) de ce till, puis par le till de Lawrencetown (9,1). La modélisation dimensionnelle des gaz souterrains a déterminé qu’il est peu vraisemblable que la seule migration du radon du substratum rocheux en profondeur serait à l’origine de teneurs lues à 60 cm de profondeur; les tills sus‑jacents doivent également produire du radon.
[Traduit par la redaction]
INTRODUCTION
1 Radon222 is a naturally occurring, invisible radioactive gas that is present in measurable quantities in all till and soil types in Nova Scotia (Goodwin et al. 2008). It is a daughter product of uranium238, and decays to polonium218, releasing a potentially harmful alpha particle. High radon soil gas values are typically associated with granite and slate (Je 1998). Radon is a human health risk, as long-term exposure to high radon concentrations through inhalation is the second leading cause of lung cancer next to smoking (World Health Organization 2005). A radon potential map of Canada identified Nova Scotia and Winnipeg as the highest risk provinces (Chen 2009).
2 Previous radon soil gas (where soil refers to glacial till) testing completed in Nova Scotia (Goodwin et al. 2008) indicated measurable quantities of radon in all 72 sites across the province (sampling density of 1 sample ever 800 km2). Radon in Halifax Regional Municipality (HRM) has been previously identified as a potential health risk (Lewis et al. 1998; White et al. 2008). As over 40% of the provinces population resides in HRM, significant study has been focused on identifying and managing this potential risk to human health.
3 In order to better understand the radon soil gas distribution and risk across HRM, this study investigates the controls on radon soil gas in the major till units, and attempts to answer the following two questions: what are the major factors controlling the expression of radon, and how can soil gas modeling be used to predict a bedrock production value? The spatial distribution of radon with respect to bedrock and till units is mapped, and gas transport modeling is used to determine important controls influencing the high radon concentration prevalent in HRM tills. The controls on the concentration of radon gas measured in the till have not yet been well established. The previous radon study in HRM did not incorporate a model of radon gas transport from depth (Goodwin et al. 2009b). The present study incorporates soil gas modeling to understand the production of radon at depth and the diffusivity of the overlying tills.
BACKGROUND
4 A limited study focused on radon concentrations in surficial geological units of Halifax Regional Municipality (Goodwin et al. 2009b). Within HRM, 20 sample sites from four specific glacial till types were sampled. The granite facies of the Beaver River Till returned the highest mean radon concentration of 54.1 kBq m-3, followed by the Lawrencetown Till with 28.3 kBq m-3, and the metasandstone and slate facies of the BRT with 26.2 kBq m-3 and 25.4 kBq m-3, respectively.
5 Permeability plays an important role in the expression of soil gas (in this case, the soil is till), as it is a proxy for the diffusion of gas transport. Coarser soil tends to have higher permeability relative to clay rich soil (Freeze and Cherry 1979). The higher the permeability, the easier soil gas can pass through the pore spaces and be detected. Soil gas transport is diffusive. Previous work (Ball et al.1999) showed that the production, consumption, and transport of CO2 and N2O were strongly influenced by changes in soil structural quality and water content associated with tillage and compaction. A primary soil quality component influencing the soil transport of a gas is the gas diffusivity. As diffusivity is linked to permeability, it is a key component in this study. The contribution of radon from the bedrock is also important.
6 The concentration of radon in soil gas and the permeability of the soil are two important factors that affect the movement of radon to the surface. The soil radon potential (SRP) index helps quantify the radon gas to soil permeability relationship. The higher the SRP value, the greater the potential for radon to migrate through the soil and enter a home to levels that exceed the guideline of 200 Bq m-3 (Health Canada 2009). The SRP index has previously been used by Goodwin et al. (2009a, b), however a brief explanation is given here. The SRP index is defined (Neznal et al. 2004) as:
7 Where C is the radon soil gas concentration for a field sample site in kBq m-3, and P is the soil permeability of the field site in m2. C0 and P0 are set constants, respectively, 1 kBq m-3 and 1 × 10⁻¹⁰ m2.
8 Previous SRP work has been completed for parts of southern Ontario (Chen et al. 2008) when the Ottawa-Sarnia transect was analyzed for the radon potential. Natural soil gas radon variability and background concentrations were determined at 32 sites between Ottawa and Sarnia. The measured soil gas radon concentrations varied significantly from 4 to 116 kBq m-3. The SRP results ranged from 1 to 80 at the same sites; areas of high potential risk were identified (Chen 2009). Radon soil gas testing was done in southern Ontario previously (Je 1998). Natural background was found to be 3.7–7.4 kBq m-3, with anomalies found near the extensively fractured black shales around the Greater Toronto Area (GTA). These anomalous concentrations peaked at 37 kBq m-3.
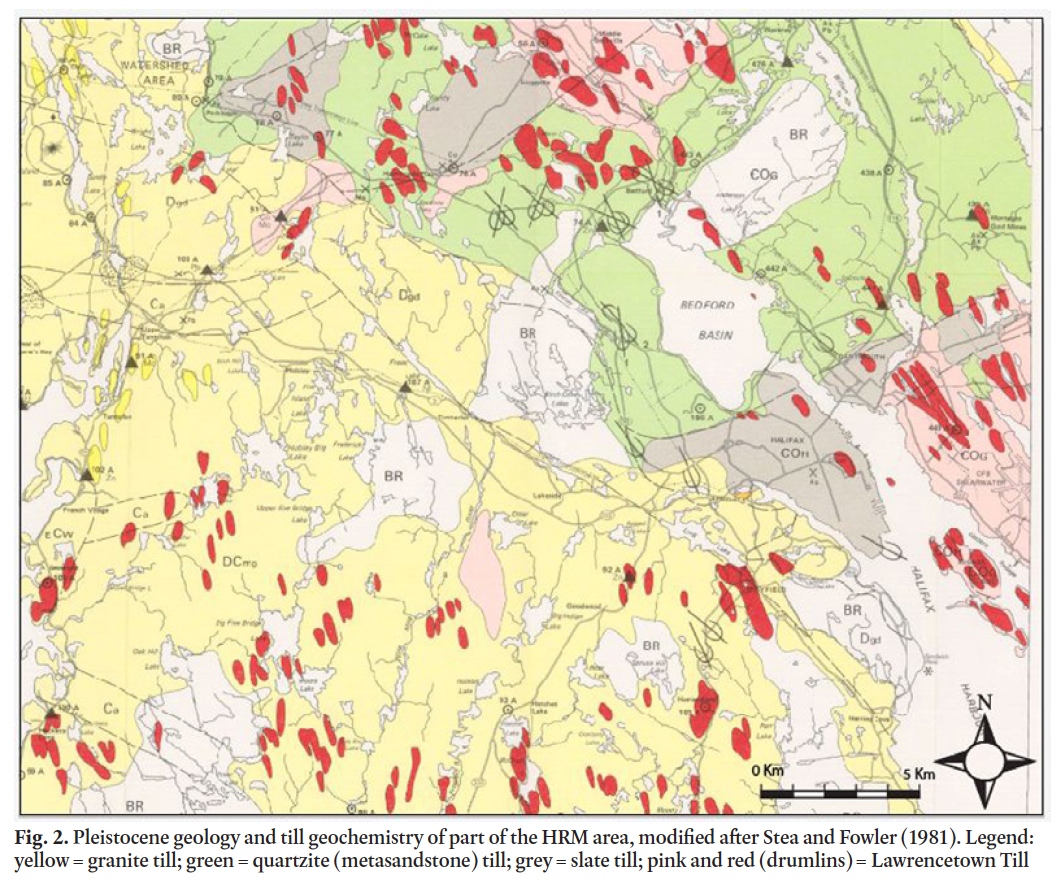
9 The SRP index helps determine which till (and bedrock) types will have the highest potential for accumulation of indoor soil gas (and exceed the 200 Bq m-3 indoor guideline). Approximately 40% of the study area (Fig. 2) is covered with granite facies till, 10% with clay-rich Lawrencetown Till (mostly drum-linized), 25% with slate facies till, and 25% with metasandstone facies till (Stea and Fowler 1981). In this paper, the SRP values are calculated for each surficial unit to determine the relative ranking of the radon potential. In situ gamma ray spectrometry measurements are also collected at each site to determine the concentration of equivalent uranium (eU) (as well as equivalent thorium, and potassium). This uranium data may be used to further asses the radon potential, though it is important to note that eU is only a proxy of uranium (U), as it is measuring bismuth214.
METHODS
10 For this study, all sample sites were located within Halifax Regional Municipality. A total of 200 measurements from 40 sites were collected and analyzed during the 2009 field season (and combined with the 20 sites from 2008) using protocols developed for the North American Soil Geochemical Landscapes Project (Friske et al., 2010). A detailed methodology has been previously described (Goodwin 2008; Goodwin et al. 2008, 2009a, 2009b), but a brief summary is given below.
Field sites
11 Individual sample sites (Fig. 1) were chosen and subdivided based on the surficial geology (till) units. The sites were biased by the existing road network (for example, along Highway 103). Also, the 2009 samples were in natural undisturbed sites (sites from 2008 were taken in parks).
 Display large image of Figure 1
Radon equipment and sampling procedure
12 At each sample site, five hollow probes were hammered into the till to a depth of 60 cm. A spacer and thin rod were then used to punch out a tapered tip, creating a fixed head space. Soil permeability was determined for each probe, using the Radon-JOK portable permeability instrument. If, aſter 10 minutes, the instrument did not move (low permeability), that probe was assigned a value of 2.0 × 10⁻¹⁴ m2 (Friske et al. 2010). Once the permeability readings were taken, 150 mL of soil gas was extracted from each probe. This gas was transferred into IK-250 sampling ionization chambers, held for approximately 15 minutes, aſter which radon concentrations were measured. The arithmetic mean of the five probes was calculated, and this value was assigned the concentration of the radon soil gas used for the site.

Soil gas modeling
13 In order to take an analytical look at the radon soil gas, the diffusivity equation (No. 2) (Nazaroff 1992) is used to help model the radon concentration with depth. The bulk distribution coefficient was modified (Penman 1940; Washington et al. 1994), resulting in equation 3. This now represents a time independent formula; the data collected in the field is also time independent. One of the major assumptions using this model is that till is not producing radon, and that it is being emitted from the bedrock only.
14 Soil gas transport is primarily diffusive; non-diffusive transport is typically a very near-surface phenomenon. Permeability is a measure of transport driven by pressure gradients imposed by wind, while diffusivity is a measure of molecular flow driven by concentration gradients, and has been measured recently with isotope signatures (Kayler et al. 2010). Therefore, for the soil gas modeling, diffusivity is used instead of permeability. It is a more common way of modeling the gas mobility, and can be correlated more easily with other soil gas model results.
 Display large image of Figure 2
15 If soil gas transport is diffusive, why is the permeability tested on site? There are two reasons for this; first, in the field it is much easier to measure permeability than it is to measure diffusivity (Risk et al. 2008). Secondly, permeability and diffusivity are both controlled by similar factors such as porosity, water filled pore space, etc (Washington et al. 1994). Both are similar, so permeability is used as a proxy for diffusion.
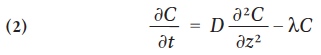
16 Where C is radon soil gas concentration in Bq m-3, t is time, D is the diffusivity of radon in the soil in m2 s-1, and z is depth in meters.
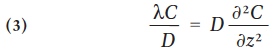
17 Assuming that the soil does not produce radon, which it is in a steady state and does not change over time (for the sake of the model), the right side of that equation is equal to zero. The solution is seen in equation 3:
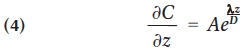
18 Integrating once, the solution is shown in equation 4, where A is the constant of integration and z is depth.
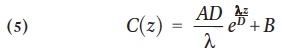
19 Integrating a second time, the solution is found in equation 5, where B is a second constant of integration.
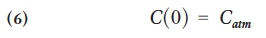
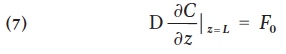
20 Two boundary conditions are shown in equations 6 and 7. Substituting equation 7 back into equation 5 allows one to solve for A, while the flux at L is equal to the constant F0. Substituting equation 7 back into equation 4, shows the solution for I.
21 The final solution is:
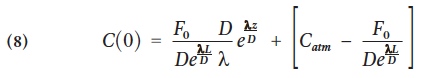
22 Where C is the depth dependant concentration in Bq m-3, F0 is the flux of radon from the bedrock in Bq m-3 s-1, z is the depth in meters, D is the diffusivity of radon in the soil in m2 s-1, λ is the radon decay constant and is unitless, Catm is the atmospheric radon concentration in Bq m-3.
23 The radon concentration was calculated for a sampling depth of 60 cm. Using Graham’s Law of Effusion with respect to CO2 (Mason and Kronstadt 1967), the diffusivity of radon in water is calculated to be 2 × 10⁻¹⁰ m2 s-1, and using Fick’s Law, in free air it is approximately 7.1 × 10⁻⁶ m2 s-1. This means that the lowest possible diffusivity of radon in the soil is assumed to be around 2 × 10-11 m2 s-1, and the highest possible diffusivity must be slower than 10-5 m2 s-1, because radon in free air is 1.62 × 10⁻⁵ m2 s-1 (Davidson and Trumbore 1995). Because the granite facies (which also had the highest soil permeability) was used for the model the lowest value was ruled out. The model was run to determine the diffusivity of the till and the production of radon from the bedrock that would be required to achieve the measured field concentration of radon in soil gas. Diffusivities ranged from 10-7 m2 s-1 (fastest) to 10-10 m2 s-1 (slowest), and production rates ranged from 1 to 1000 Bq m-3. The depth to the bedrock was set at 1.6 m because the till thickness was generally thin, therefore, the bedrock on average is assumed to be one meter below sampling depth for the model, except where drumlins were present.
BEDROCK GEOLOGY
24 Within the Halifax Regional Municipality sample area, three dominant geologic units are of interest (Fig. 1). The study focused on soil (glacial till is the parent material) developed over these three major bedrock types: the Cambrian-Ordovician Goldenville and Halifax groups, and Devonian granite of the South Mountain Batholith. The Goldenville and Halifax groups consist of, primarily, metasandstone and slate, respectively (White et al. 2008). Devonian granite intruded both the Gold-enville and Halifax groups. The granite has been subdivided, based on its composition and cooling history, into primitive monzogranite, middle stage coarse-grained leucomonzogranite, and evolved fine-grained leucomonzogranite (MacDonald and Horne 1987).
SURFICIAL GEOLOGY
25 Within HRM, two glacially derived till units dominate the surficial geology and associated landforms (Fig. 2). One is the locally derived Beaver River Till that has been subdivided into three mappable units based on a number of different criteria including dominant clast type, matrix composition/texture, and geochemistry: (1) slate facies; (2) metasandstone facies; and (3) granite facies (Stea and Finck 2001). The three informal sub-units of the South Mountain Batholith granite till include: (1) early granite till, derived from relatively primitive granite including granodiorite and monzogranite; (2) middle granite till, derived from a relatively moderately evolved coarse-grained leucomonzogranite; and (3) late granite till derived from relatively highly evolved fine-grained leucomonzogranite (MacDonald and Horne 1987).
26 The second dominant till type is the distally derived Lawrencetown Till (Stea and Fowler 1981). This till unit is distinct from the Beaver River Till because (1) it contains clasts from as far away as the Cobequid Highlands (100 km to the north), (2) the matrix is (commonly) finer grained than in the Beaver River Till, and (3) it has a relatively distinct brick-red color. The distribution of the till facies mimics that of the underlying bedrock (Fig 2 versus Fig. 1).
Beaver River Till – granite facies
27 The clasts of the granite till facies are comprised of angular, local monzogranite, granodiorite, and leucomonzogranite set in a granite-derived sandy till (Stea and Fowler 1981). It is commonly yellow-brown to yellow-grey. Granite till commonly gives rise to a hummocky terrain with an average thickness of 2 m and a maximum of 5 m. Commonly, the granite till facies forms a thin veneer (<1 m) in areas of abundant granite bedrock.
Beaver River Till – slate facies
28 The slate till facies of the Beaver River Till is derived from Halifax Group slate and the till contains clasts of slate (Stea and Fowler 1981). The sandy matrix is commonly light olive brown. The slate facies till forms a thin (<4 m) sheet over polished slate bedrock.
Beaver River Till - metasandstone faces
29 The metasandstone facies till (formerly quartzite till of Stea and Fowler 1981) is light bluish grey and contains loose, angular metasandstone and metasiltstone clasts, largely cobble sized, set in a silt-sand matrix. The till sheet averages 3 m in thickness but can be up to 20 m thick in drumlins.
Lawrencetown Till
30 The Lawrencetown Till is distinct from the Beaver River Till because it is a distally derived till unit that is characterized by its generally high clay and clast content. This till was derived from tens of kilometers up-ice, and does not reflect the underlying bedrock geology; it has a distinct brick red to crimson-ochre red color. The Lawrencetown Till has a higher effective cohesion and tends to retain moisture compared to Beaver River Till (Lewis et al. 1998). The Lawrencetown Till is commonly found in drumlins up to 25 m thick.
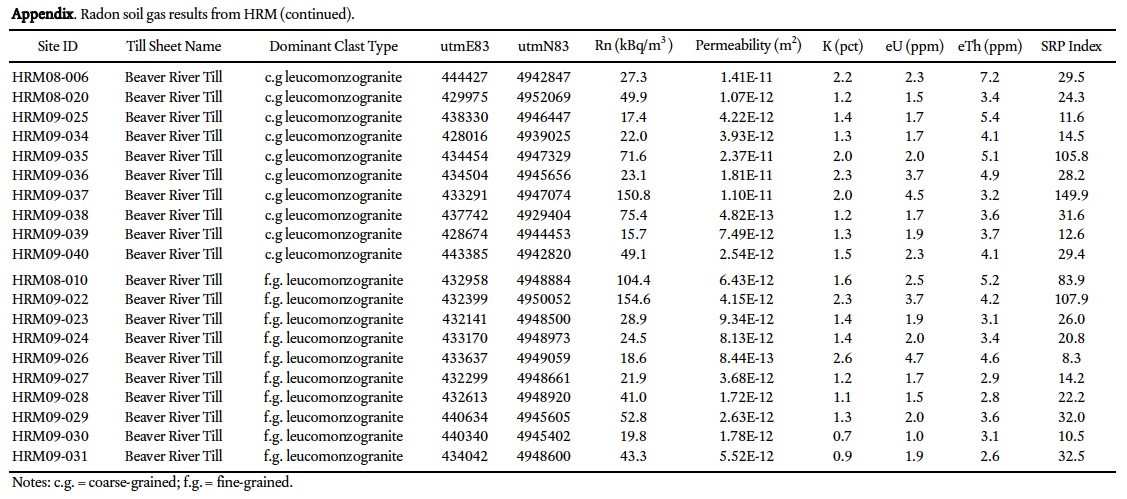
RESULTS
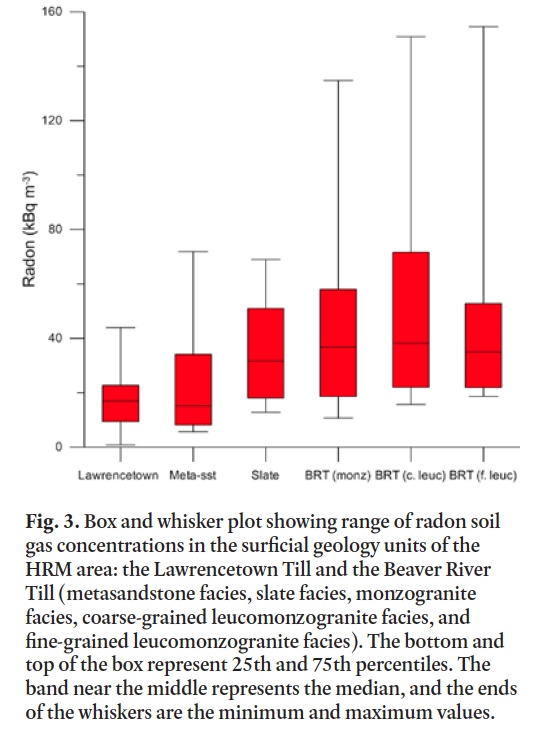
31 All field sites sampled had measurable radon soil gas present in kBq m-3 (detection limit of 0.02 kBq m-3); raw data are available in the appendix. The radon concentrations collected for the HRM surficial geology units are highly variable (Fig. 3). The highest variability is in the BRT granite facies. This could be due, in part, to soil heterogeneity, exemplified in the unsorted nature and large variable size and composition of the clasts in the granite till.
 Display large image of Figure 3
32 The highest concentrations of mean radon soil gas based on field results (Fig. 4) are generally found in till developed over the South Mountain Batholith. This includes the BRT monzo-granite, and the coarse-and fine-grained leucomonzogranite.
 Display large image of Figure 4
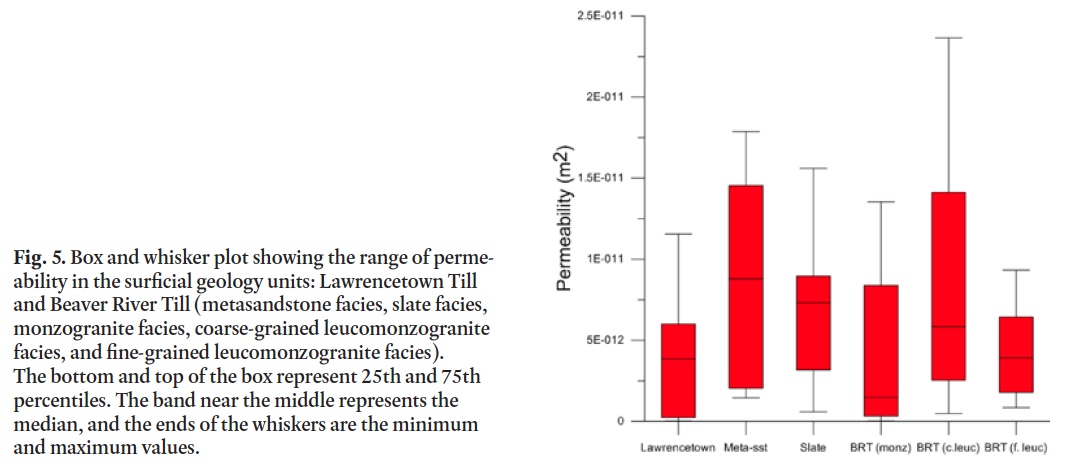
33 A box and whisker plot (Fig. 5) shows one of the most important aspects of the permeability data: the high variability within units. Large differences in permeability values were noted from within a single site. At some sites, five probes within 10 m of each other produced five drastically different values. One possible explanation for the variability in Lawrencetown Till may be due to the presence of sand pockets within the clay rich till.
 Display large image of Figure 5
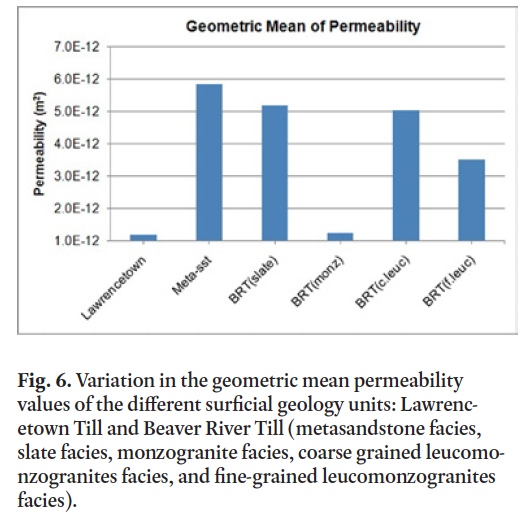
34 The permeability values presented in the box and whisker plot (Fig. 5) represent all the data (i.e., 5 probes from each site, total 200), and show the trends and variability. The geometric mean is typically used to estimate effective permeability from small-scale samples (Jensen 1991). The geometric mean was chosen to determine if there was a large discrepancy between the mean values and the geometric mean values. Although the absolute values were different between the two, overall, the geometric mean values in Figure 6 follow the same trend as shown by the arithmetic mean values in Figure 5. Lawrencetown Till had the lowest permeability followed by the granite facies, slate facies, and finally the metasandstone facies had the highest permeability. Subdividing the granite facies the monzogranite has a low geometric mean, similar to Lawrencetown Till. Conversely, the coarse-grained leucomonzogranite has the highest permeability of the granite-derived till, approximately equivalent to the permeability of the slate till facies. The stony metasandstone till facies has the highest permeability.
 Display large image of Figure 6
35 Figure 7 shows the eU concentrations measured for each surficial geology unit. As with the radon and permeability values, the radioactivity was measured at 5 probes at each site, and then averaged for each site. The eU values follow the same trend as increasing average radon, with the Lawrencetown Till returning the lowest average values, then the metasandstone and slate facies, and finally the granite facies with the highest uranium concentration.
 Display large image of Figure 7
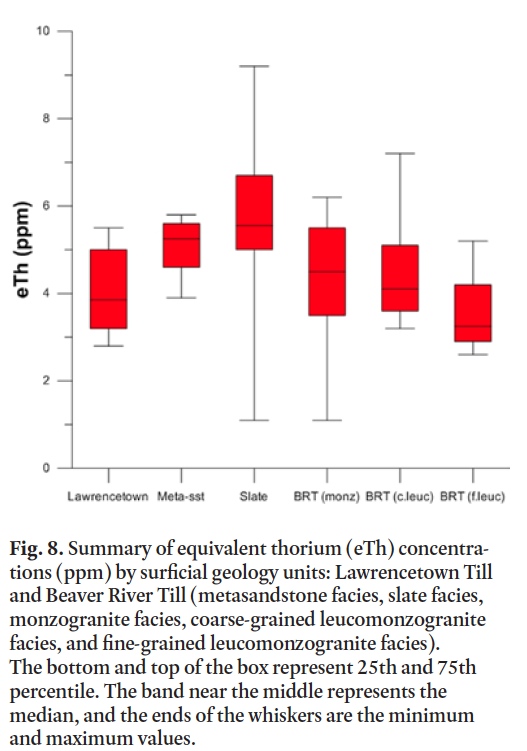
36 Figure 8 shows the eTh concentrations measured for each surficial geology unit. Again, the radioactivity was measured from 5 probes at each site, and then averaged for each site. Equivalent thorium (eTh) follows a slightly different trend than eU (Fig. 7), with the Lawrencetown Till showing the lowest average values, followed by granite and metasandstone facies. The slate facies returns the highest average eTh concentrations.
 Display large image of Figure 8
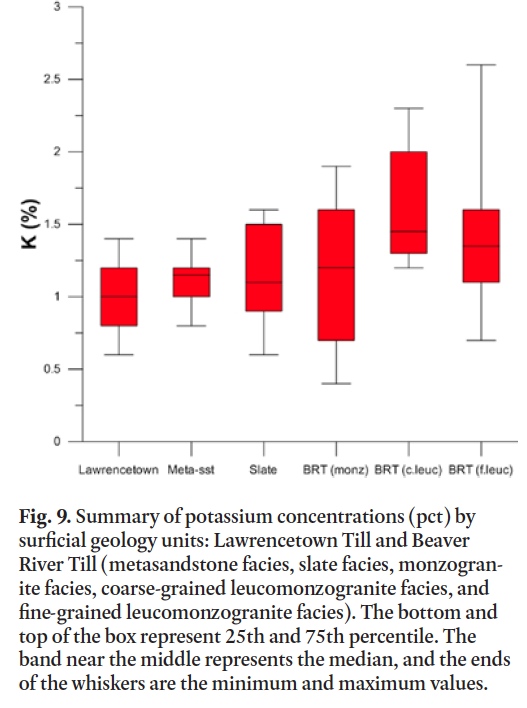
37 The potassium concentrations (Fig. 9) have the same general trend as eU. The lowest average concentrations were seen in Lawrencetown Till, and the highest associated with the granite facies. In relation to radon and radioactivity, the units are not statistically different, but the trends are still important. This result is not uncommon in radon soil gas studies; soil radon values are very erratic over short distances in the order of a few metres (Durrani and Badr 1995); however, statistical analyses have shown that the larger scale variations in radon soil gas are determined by the underlying geology.
 Display large image of Figure 9
38 Figure 10 presents the SRP value for each of the surficial geology units tested. The granite facies of Beaver River Till, which has the highest radon average, also has the highest SRP, and Lawrencetown Till, which has the lowest radon average (as well as the lowest permeability average), has the smallest SRP. A negative minimum SRP value (-0.1) is calculated for one Lawrencetown Till sample site. At this specific site, the permeability apparatus showed no movement aſter 10 minutes, and was assigned the ‘low permeability’ value of 2.0 × 10⁻¹⁴ m2. At the same site soil gas was also difficult to extract, and returned a low radon soil gas concentration of 0.3 kBq m-3. When these two values are put into the SRP equation, it yields a negative value. However, this does not show up at other sites where there is a ‘low permeability’ value assigned because the radon soil gas values are high enough to compensate for the ‘low permeability’ number. This negative site value was included in the average Lawrencetown Till SRP index, shown in Fig. 10, though the SRP does not change drastically if this negative site is excluded (from 9.6 to 10.6).
 Display large image of Figure 10
39 The analytical gas transport equation (equation 8) results for radon, using specific diffusivities (10-7 to 10-10 m2 s-1) and production rates (1 to 1000 Bq m-3) are presented in Table 1. It shows the diffusivities and production rates that are required to achieve the soil radon concentrations found, assuming gas transport from bedrock across 1 m of inert soil between production and detection depth.
DISCUSSION
Field Work
40 Determining the sensitivity of the SRP index is important in understanding the relative importance of permeability and radon production rate values. In equation 1, the radon concentration is linearly related to the SRP, and the permeability is related to the SRP by:
40 This shows that the SRP equation is ten times more sensitive to changes in concentration than permeability, meaning in the equation, permeability is a much less important determinant of SRP.
41 The permeability (Fig. 5) between units varies approximately one order of magnitude. Although the SRP equation is ten times less sensitive to permeability changes, there is an approximately ten times higher variation in permeability amongst the field sites making both variables yield approximate equal weighting in the SRP. Therefore, both seem roughly equal as determinants of SRP in Halifax Regional Municipality, and should both be considered important factors to measure.
42 One of the original hypotheses dealt with using eU values as a proxy for radon soil gas concentration. Based on the eU concentrations measured, this assumption is somewhat reasonable, but there will always be exceptions. The eU does follow the same trend as radon, the higher the eU at a site, the higher the radon soil gas concentration.
43 One of the main issues when collecting soil gas radon is site variance. Most of the variability is due to heterogeneity of the till; in particular the grain size. This study has shown that the till derived from the bedrock must contribute significantly more radon soil gas than the actual bedrock at depth. Generally within HRM, the surficial unit on top of the bedrock is thin, typically only a few meters thick; with the bedrock, even at 1 m below detection depth, the decay rate acts faster than the gas can realistically travel.
Soil gas modeling
44 In order to yield a concentration of ~10–60 kBq m-3 at 60 cm depth, a diffusivity of 10-7 m2 s-1 is needed over a wide array of productions (Table 1). The calculated concentrations are similar to the average concentrations in the granite facies till. The model allows the testing of the assumption of distant transport from the bedrock; assuming the soil does not emit any radon, the production of radon from the bedrock can be tracked through depth with different diffusivities. The till is assumed to be inert in order to test the transport and decay systems, which will not be complicated by local production of radon in the overlying till: transit time and decay time are the two major factors. As it is an analytical measurement, there is no error in these calculations.
45 For example, if 25 Bq m-3 s-1 was produced from the bedrock, a diffusivity of 4 × 10⁻⁷ m2 s-1 would be needed to detect a similar concentration of radon with 60 cm of overlying granite facies till. This is not measured data: it is a test of an assumption in a purely homogenous and perfect virtual setting as described by physical laws. The diffusivities calculated are reasonable for this till type, especially because they are partially saturated; water-filled pore spaces yield lower gas permeability (Fujiyoshi et al. 2005), and inhomogenous in a non-perfect setting. It is likely that the diffusivity values of 10-7 m2 s-1 are much too high for a granite-derived till in HRM, as it is very close to that of radon in free air (10-6 m2 s-1); therefore, the till would have to be extremely arid and open to the atmosphere. A probable diffusivity would be in the 10-8 to 10-10 m2 s-1 range, where till may be more saturated and less homogenous.
46 By testing the modeling process, it is unlikely that radon transport from depth alone (bedrock) can contribute to the concentrations measured at 60 cm. Therefore, radon soil gas must come predominantly from the till, near the site of sampling. The production of radon from within the till plays a bigger role than the transient time - it is unlikely that transport can allow radon to reach the surface from a bedrock source before it decays unless the glacially derived soil is extremely thin, or absent. Soil gas modeling work in this study concludes that soil is likely the major contributor of radon gas.
47 Overall, this study is useful to help understand the transport of radon soil gas in HRM and elsewhere in Nova Scotia. The SRP equation has been used to assess areas of potential risk. Radon is a daughter product of uranium and site specific spectrometer measurements show a broader estimate of radon potentials as well. Future soil gas modeling should concentrate on the rate of production and diffusivity of the various soil types within HRM.
CONCLUSIONS
48 The calculated SRP index indicates the BRT granite facies returned the highest mean value of 34.5, followed by the slate facies (27.2), and metasandstone (15.1). The distally derived clay-rich Lawrencetown Till shows very low permeability and radon soil gas concentrations, which is reflected in the lowest SRP index value of 9.1. Soil gas modeling was used to show the potential productivities and diffusivities needed to see the field concentration. Using a modified diffusivity equation, possible diffusivities and production rates of radon at a bedrock depth of 1.6 m were calculated. A diffusivity of 10-7 m2 s-1 was needed with a production of 10–1000 Bq m-3 at depth, in order to get radon concentrations similar to the arithmetic mean. This is very fast diffusivity, and highly unlikely in the granite facies. Large variations are seen in radon concentrations and permeability values within each unit. Further testing to potentially resolve some of the variability issues would be important in understanding more about the radon soil gas concentrations in HRM, and the health implications surrounding it.

This paper was the basis of a B.Sc. thesis at Saint Francis Xavier University by Kelsey O’Brien. Nick Nickerson is thanked for his knowledge and calculus manipulation in soil gas modeling. Geologists at the Nova Scotia Department of Natural Resources provided data, employment and experience. Earth Sciences Research Centre students at Saint Francis Xavier University are thanked for their help. Nova Scotia Department of Natural Resources Mineral Resources Branch, Health Canada, Geological Survey of Canada, and Natural Sciences and Engineering Research Council of Canada contributed funding for this study. We thank journal reviewers Michael Parkhill, Ken Ford, and co-editors Ian Spooner and Daniel Utting for their constructive comments and edits.