Articles
Very low- and low-grade metamorphism of mafic volcanic rocks of the Mira terrane (Avalonia), southeastern Cape Breton Island, Nova Scotia
David W.A. McMullinDepartment of Earth and Environmental Science, Acadia University, Wolfville, Nova Scotia B4P 2R6, Canada
Sandra M. Barr
Department of Earth and Environmental Science, Acadia University, Wolfville, Nova Scotia B4P 2R6, Canada
sandra.barr@acadiau.ca
Robert P. Raeside
Department of Earth and Environmental Science, Acadia University, Wolfville, Nova Scotia B4P 2R6, Canada
Date received: 01 January 2010 ¶ Date accepted: 12 April 2010 ¶ Date digitally published: 10 June 2010doi: 10.4138/atlgeol.2010.006
ABSTRACT
Late Neoproterozoic (680 Ma to 560 Ma) Avalonian rocks in the Mira terrane of southeastern Cape Breton Island have been metamorphosed inhomogeneously, at very low grade to low grade, as recorded in mafic volcanogenic rocks (metabasite). Local occurrences of higher grade (amphibolite-facies) rocks are limited to aureoles surrounding Devonian plutons. At the lowest grades, metabasite contains primary igneous textures and relict plagioclase and pyroxene. Chlorite, prehnite, and sporadically developed pumpellyite indicate that the rocks have reached prehniteactinolite facies conditions. Higher grade rocks contain actinolite and epidote indicative of greenschist-facies conditions. Pumpellyite was not observed to occur with actinolite, indicating that pumpellyite-actinolite facies was not attained. Relict pyroxene is diopsidic in composition, and along with mineral textures and chemographic projection analysis, suggests that clinopyroxene was an active participant in equilibria at the lowest grades. Calculation of the P-T position of equilibria involving diopside with chlorite, epidote, prehnite, and pumpellyite yields P-T values consistent with very low-grade conditions and with the P-T conditions determined using actinolite, chlorite, prehnite, and pumpellyite. With the exception of the youngest (ca. 560 Ma) rocks, the samples show the full range of P-T conditions from prehnite-actinolite to greenschist facies. The ca. 560 Ma samples record only very low-grade (prehniteactinolite facies or lower).Prehnite-actinolite- to greenschist-facies assemblages suggest that metamorphism occurred at temperatures between 250 °C and 350 °C with pressures less than ca. 3 kbar (300 MPa). The P-T calculations indicate that pressures were somewhat lower, at about 2 kbar (200 MPa). These conditions imply relatively high geothermal gradients (at least 50 °C/km), consistent with burial metamorphism in a volcanic-arc setting. Metamorphism in the area as a whole was an ongoing process throughout the formation and amalgamation of the components of the Mira terrane, rather than the product of a discrete orogenic event.RÉSUMÉ
Les roches avaloniennes du Néoprotérozoïque tardif (680 à 560 Ma) dans le terrane de Mira, au sud-est de l’île du Cap-Breton, ont subi un métamorphisme hétérogène et produit des roches très faiblement à faiblement métamorphosées, comme l’attestent les roches volcanogéniques mafiques observées dans la région (métabasite). Les cas isolés de roches nettement plus métamorphosées (faciès amphibolitique) se limitent aux auréoles qui ceinturent des plutons du Dévonien. S’agissant des roches plus faiblement métamorphosées, la métabasite contient des roches à texture ignée primaire, des plagioclases reliques et du pyroxène. La chlorite, la prehnite et la pumpellyite minéralisée de façon éparse présentes, indiquent que les roches ont atteint le stade d’un faciès à prehnite-actinolite. Les roches plus métamorphosées contiennent de l’actinolite et de l’épidote, ce qui traduirait la présence d’un faciès à schistes verts. La pumpellyite observée ne semblait pas s’accompagner d’actinolite, ce qui indiquerait que le stade d’un faciès à pumpellyite-actinolite n’a pas été atteint. La composition du pyroxène relique présente un pôle diopsidique. Les textures minérales observées et l’analyse de projection chémographique portent à croire que le clinopyroxène a été un agent actif dans l’atteinte de l’équilibre aux stades de métamorphisme initiaux. Le calcul du point d’équilibre P-T (pression et température) faisant intervenir le diopside, la chlorite, l’épidote, la prehnite et la pumpellyite produit des valeurs de P-T qui correspondent à un état de roches très faiblement métamorphosées, tandis que les valeurs P-T ont été établies par l’analyse de la teneur en actinolite, chlorite, prehnite et pumpellyite. Sauf en ce qui a trait aux roches les plus récentes (environ 560 Ma), les roches présentent tout l’éventail des valeurs de P-T, soit celles correspondant au faciès à prehnite-actinolite jusqu’au faciès à schistes verts. Les roches dont la formation remonte à environ 560 Ma ne présentent qu’un métamorphisme très faible (faciès à prehnite-actinolite ou faciès moins développé).Les assemblages de faciès à prehnite-actinolite au faciès à schistes verts suggèrent que le métamorphisme est survenu à une température comprise entre 250 °C et 350 °C, et à une pression inférieure à environ 3 kbar (300 MPa). Le calcul des valeurs de P-T indique que la pression a été quelque peu plus faible, soit d’environ 2 kbar (200 MPa). Ces paramètres indiqueraient des gradients géothermiques relativement élevés (d’au moins 50 °C/km), ce qui serait caractéristique d’un métamorphisme d’enfouissement survenu dans un arc volcanique. Le métamorphisme dans l’ensemble de la région a été le fruit d’un long processus pendant toute la formation et le regroupement des éléments du terrane de Mira plutôt que le résultat d’un phénomène orogénique distinct.[Traduit par la redaction]INTRODUCTION
1 Like other parts of Avalonia in the northern Appalachian orogen (Fig. 1, inset), the Mira terrane of southeastern Cape Breton Island is characterized by Neoproterozoic volcanic, sedimentary, and plutonic rocks overlain by Cambrian sedimentary units (Williams 1979; Hibbard et al. 2006). The Late Neoproterozoic tectonomagmatic evolution of the Mira terrane has been documented previously (Barr et al. 1990, 1996, 1998; Barr 1993; Bevier et al. 1993), but none of these studies included a detailed examination of the metamorphic history of the area. Based on their field and petrographic observations, Barr et al. (1996) noted that the grade of metamorphism is very low to low (lower greenschist facies at most), with localized higher grade areas related to contact metamorphism by late Neoproterozoic and Devonian plutons. They made no attempt, however, to quantify the pressure-temperature conditions involved. A few other studies have focused on localized alteration associated with mineralization, both in Mira terrane and elsewhere in Avalonia (Lynch and Ortega 1997; Kontak 1998; Kontak et al. 2003; Sparkes et al. 2005), but not on regional metamorphism. Recent studies (Potter et al. 2008a, b) documented the existence of a pervasive oxygen isotope depletion event in the Mira terrane and elsewhere in Avalonia, apparently in the latest Neoproterozoic, but linked it to hydrothermal fluid migration rather than to regional metamorphism.
Fig. 1. Simplified geological map of the Mira terrane, showing volcanic-sedimentary belts, plutonic units, and Cambrian and Carboniferous cover units (after Barr et al. 1996). Inset map shows the location of Mira terrane within Avalonia (after Hibbard et al. 2006). Abbreviations: A, Avalonia; G, Ganderia; M, Meguma; L, Laurentia, PL, peri-Laurentian rocks; PG peri-Gondwanan arcs.
Display large image of Figure 1
2 This paper reports the results of an investigation of the regional metamorphic mineral assemblages and mineral chemistry in Neoproterozoic mafic volcanic rocks (metabasite) of the Mira terrane. The study of such low-grade metabasite is challenging because of the typically fine grain size of the meta-morphic minerals of interest, the common occurrence of nonequilibrated systems, and the typical presence of metastable phases (e.g., Robinson and Merriman 1999; Schiffman and Day 1999). Also, because the mineral assemblages in low-grade rocks are especially sensitive to composition (e.g., Powell et al. 1993; Beiersdorfer 1993), our study was necessarily restricted to a relatively small group of mafic rocks for which chemical analyses are available and which can be demonstrably shown in chemographic projections (such as ACF diagrams) to be compositionally equivalent to ensure that any change in assemblage is the result of change in P-T conditions, not the result of compositional differences. In spite of these constraints and limitations, we are able to document here the regional metamorphic P-T conditions in the Mira terrane, the first time such work has been done in this detail in Mira or elsewhere in Avalonia.
BACKGROUND: VERY LOW- AND LOW-GRADE METAMORPHIC FACIES
3 Very low-grade metamorphism corresponds to the zeolite, pumpellyite-actinolite, and prehnite-actinolite facies (Fig. 2), whereas low-grade metamorphism is broadly equivalent to the greenschist facies (e.g., Fettes and Desmons 2007). The specific position of the P-T “triple-point” between the prehnite-actinolite, pumpellyite-actinolite, and greenschist facies varies from study to study but is generally between 3 and 4 kb (300–400 MPa) and between 300 °C and 350 °C (e.g., Liou et al. 1985, 1987; Frey et al. 1991; Powell et al. 1993; Banno 1998; Miyazaki and Okumura 2002; Day and Springer 2005).
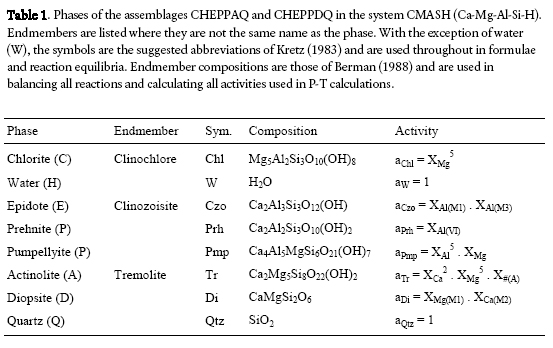
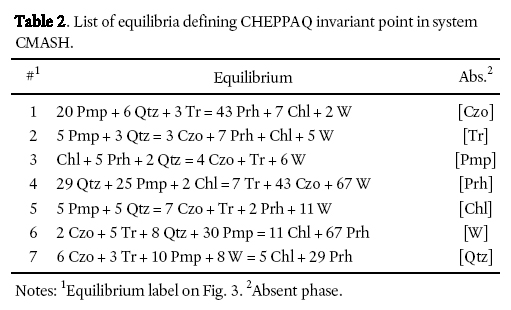
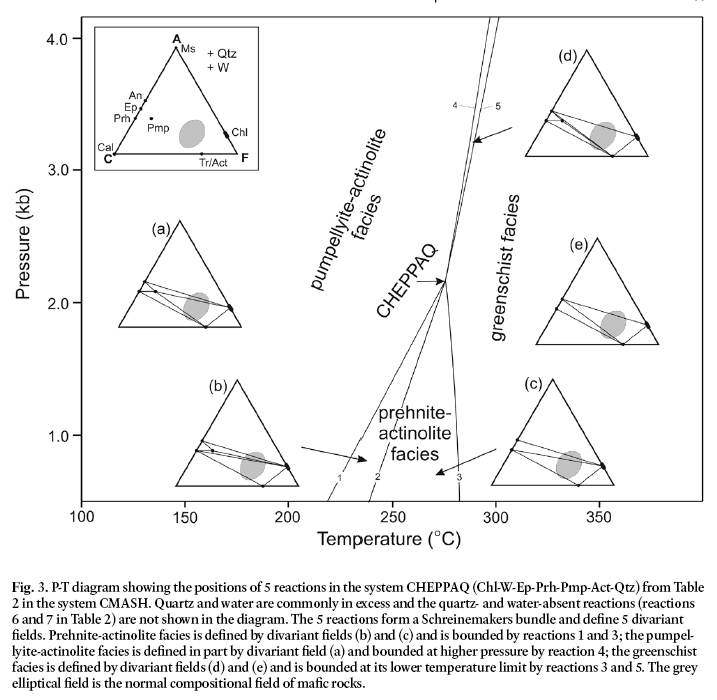
4 These particular metamorphic facies are characterized most effectively by specific assemblages unique to metabasite in the chemical system CaO-MgO-Al2O3-SiO2-H2O (CMASH; Table 1). Seven reactions can occur among the phases Chl-Ep-Prh-Pmp-Act-Qtz-W (H2O) in the CMASH system (Table 2). Five of these reactions define an invariant point labelled CHEPPAQ by Powell et al. (1993), as shown in Figure 3. Because quartz and water are always present, the Qtz- and W-absent reactions (6 and 7 in Table 2) need not be considered and are not shown on Fig. 3 (i.e., the system is projected from Qtz and W), and, for simplicity, Qtz and W are not listed in the assemblages in the following discussions.
Fig. 2. Terminology for metamorphic facies simplified from Liou et al. (1987) and Miyazaki and Okumura (2002).
Display large image of Figure 2
5 The CHEPPAQ invariant point is surrounded by 5 divariant fields, each characterized by a particular stable mineral assemblage as shown on the chemographic ACF plots included on Figure 3. It is important to note that felsic and pelitic rocks plot in the upper half of these plots (i.e., towards the A apex) and consist of the minerals that delimit that area: Ms-Chl-Ep. The plots illustrate the fact that felsic and pelitic rocks show no changes in mineralogy throughout the P-T range shown and therefore cannot be used to determine metamorphic grade. Likewise, calcic rocks show no change through the P-T range and consist of Cal-Tr-Prh. Only mafic rocks display changes and undergo various reactions in the CHEPPAQ system and these reactions typically are used as the bounding “isograds” between the greenschist, pumpellyite-actinolite, and prehniteactinolite facies, as shown on Fig. 3.
6 At lower temperatures (T below reactions 1 and 4 on Fig. 3) chemographic plot (a) on Figure 3 shows that most mafic rocks (the grey area) consist of Pmp-Chl-Tr, diagnostic of the pumpellyite-actinolite facies. Some calcic mafic rocks may contain prehnite instead of chlorite. The coexistence of Tr with Pmp is considered diagnostic of the pumpellyite-actinolite facies. At low pressure and moderate temperature (below the CHEPPAQ invariant point) most mafic rocks contain Prh-Chl-Act. This assemblage is diagnostic of the prehnite-actinolite facies (chemographic plots b and c). For most mafic rocks, there is no difference between the divariant fields labelled in chemographic plots (b) and (c) on Figure 3 because the reaction between these two divariant zones (reaction 2) involves the breakdown of pumpellyite, which is absent from most mafic rocks under these conditions. However, high-Al mafic rocks (upper edge of grey area) at temperatures lower than reaction 2 will have the assemblage Prh-Pmp-Chl (chemographic plot b). We follow the example of Miyazaki and Okumura (2002) in denoting this relatively rare assemblage as the prehnitepumpellyite subfacies of the prehnite-actinolite facies.
7 At higher T and P (chemographic plots d and e on Figure 3) most mafic rocks consist of the assemblage Ep-Act-Chl, the standard greenschist-facies assemblage. Again, for most rocks there is no difference in assemblage between plots d and e. Between reactions 4 and 5, a small percentage of mafic rocks (those with higher Ca content) will have Pmp which disappears with the breakdown of Pmp at reaction 5. The area between reactions 4 and 5 on Figure 3 is therefore a continuation of the pumpellyite-actinolite facies for a small subset of mafic rocks with high Ca.
8 In summary, at high geothermal gradients (i.e., P-T trajectories that pass below the invariant point) most mafic rocks show a progression from zeolite to prehnite-actinolite to greenschist facies (Figs. 2, 3). Most mafic rocks show no change in mineral-ogy when they pass over reaction 2 (Fig. 3), which defines the upper boundary of the prehnite-pumpellyite subfacies, as most mafic rocks do not contain prehnite and pumpellyite in this P-T range. At lower geothermal gradients (i.e., P-T trajectories that pass above the invariant point) most mafic rocks show a progression from zeolite or blueschist facies to pumpellyiteactinolite facies to greenschist facies. At high temperature gradients (lower P path) most rocks will not contain pumpellyite; at low temperature gradients (higher P path) most rocks will not contain prehnite.
Table 1. Phases of the assemblages CHEPPAQ and CHEPPDQ in the system CMASH (Ca-Mg-Al-Si-H). Endmembers are listed where they are not the same name as the phase. With the exception of water (W), the symbols are the suggested abbreviations of Kretz (1983) and are used throughout in formulae and reaction equilibria. Endmember compositions are those of Berman (1988) and are used in balancing all reactions and calculating all activities used in P-T calculations.
Display large image of Table 1
Table 2. List of equilibria defining CHEPPAQ invariant point in system CMASH.
Display large image of Table 2
Display large image of Figure 3
9 A potential complicating factor in studying metamorphic rocks is the presence of compositional sub-domains where the effective bulk compositions of some areas in the rock are different from that of the rock as a whole. An obvious example in metabasite is where amygdales contain a variety of individual minerals or mineral assemblages. However, even the ground-mass of a volcanic rock may behave differently in small areas, probably because of subtle shifts in composition and/or permeability, the latter of which controls the transport of mobile components. The presence of such “chemical sub-domains” shows up on ACF chemographic plots in two main ways. First, too many phases may be present in the rock as a whole, each sub-domain having its own stable assemblage. Second, even if only one phase polygon is identified on the ACF diagram, the bulk composition may not project within it. Both of these phenomena occur in the lowest grade rocks from the Mira terrane, but can be dealt with by careful identification of equilibrium assemblages (touching phases), especially assemblages that are diagnostic of a particular facies.
GEOLOGICAL SETTING OF THE MIRA TERRANE
10 Previous mapping, petrological studies, and radiometric dating identified five Late Precambrian volcanic-sedimentary belts in southeastern Cape Breton Island (summarized in Barr et al. 1996) (Fig. 1): (i) Stirling, (ii) East Bay Hills, (iii) Coxheath Hills, (iv) Sporting Mountain, and (v) Coastal. The Stirling belt contains sedimentary and volcanic rocks of the Stirling Group, dated at 681+6/-2 Ma (Bevier et al. 1993), intruded by ca. 620 Ma, ca. 575 Ma, and Devonian granitoid plutons (Fig. 1). The Stirling Group consists dominantly of andesitic to basaltic lapilli tuff, litharenite, and siltstone, with subordinate basaltic flows and breccias, rhyolitic lapilli tuff, and rhyolite porphyry (Macdonald and Barr 1993; Barr et al. 1996). In addition, texturally varied gabbroic dykes, sills, and small plutons are abundant, and probably comagmatic with the host volcanic rocks (Barr 1993).
11 The East Bay Hills, Coxheath Hills, and Sporting Mountain belts (Fig. 1) consist mainly of subaerially erupted volcanic and volcaniclastic rocks which have yielded ages of ca. 620 Ma (Bevier et al. 1993; Barr et al. 1996; White et al. 2003). The volcanic rocks are primarily andesitic and dacitic in the East Bay Hills and Sporting Mountain belts, whereas basalt and rhyolite are more abundant in the Coxheath Hills. They are intruded by comagmatic dioritic to granitic plutons which have also yielded ages of ca. 620 Ma (Barr et al. 1990; Bevier et al. 1993).
12 Volcanic and sedimentary rocks of the Coastal belt are the youngest in the Mira terrane, having given ages of ca. 575 and <560 Ma (Bevier et al. 1993). On the basis of age and lithology, these rocks are divided into two major units, the Fourchu and Main-à-Dieu groups (Barr et al. 1996). The Fourchu Group consists primarily of dacitic lapilli and ash tuff and rare flows; basaltic, andesitic, and rhyolitic tuff and flows are minor components. In contrast, the Main-à-Dieu Group consists dominantly of tuffaceous sedimentary and epiclastic rocks with subordinate basaltic and rhyolitic flows and tuff. Although now everywhere separated by faults, the two groups may be, in part, lateral facies equivalents. The upper part of the Main-à-Dieu group is overlain, perhaps conformably, by Cambrian sedimentary rocks (Barr et al. 1996). The Fourchu Group is intruded by ca. 575 Ma and Devonian (ca. 380 Ma) granitoid plutons, and the Main-à-Dieu Group by gabbroic plutons of uncertain but likely late Neoproterozoic age (Fig. 1).
13 The Mira terrane has a pronounced northeast “grain” shown by faults, folds, and variably developed foliation. The area is dissected by numerous northeast-striking faults, the largest and most important of which are the boundaries between the belts. The northeast-striking faults have a predominantly strike-slip component and abundant evidence of shear over wide areas (100 m-scale). The faults/shear zones appear to dip steeply to the northwest or southeast and most have Carboniferous and younger motion (Bradley and Bradley 1986; Barr et al. 1996). Their older histories are poorly constrained. Folding is somewhat cryptic, although small-scale folds are developed locally in fine-grained volcaniclastic and sedimentary units. Larger scale folding is suggested by variations in bedding orientation but kilometre-scale folds cannot be traced across the terrane because of limited outcrop away from the coast, major faults, and Cambrian and Carboniferous cover units. Fold axes trend toward the northeast and have low to moderate plunge (up to 30°) also to the northeast (Barr et al. 1996).
14 Where developed, foliations generally strike northeast and dips steeply to the southeast or northwest and resulted from both folding and faulting. Foliation interpreted as axial planar to folds varies in intensity both within and between belts and is at least partly controlled by composition. Basaltic flows, volcanic breccia, and coarse-grained clastic rocks show only a crude foliation commonly defined by alignment of flattened clasts and/or lapilli (Barr et al. 1996). Finer grained rocks, such as tuff and fine-grained sedimentary rocks, display a more pronounced cleavage defined by parallelism of muscovite/sericite and/or chlorite (Barr et al. 1996). Strike-slip motion on the northeast-striking faults has also produced foliation in adjacent rocks which varies with proximity to shear zones from none to mylonitic.
15 Despite the apparent consistency of the structural fabric, the range in age of more than 100 m.y. between the Stirling and Coastal belts and the cross-cutting relationships within the individual belts suggest that the tectonic events that imparted the structural elements had a protracted and/or episodic developmental history over tens of millions of years. Barr et al. (1996) noted that contact metamorphism of folded strata of the Stirling belt by the Chisholm Brook suite implies that folding of the Stirling belt can be bracketed between ca. 680 and 620 Ma. Barr et al. (1996) also noted that, although it is the oldest, the Stirling belt is in general the least foliated of the belts. Rocks of the East Bay Hills belt are pervasively sheared and folding is enigmatic. The only folds observed by Barr et al. (1996) were late minor folds and kinks in highly schistose (sheared?) rocks. Nonetheless, the folds cannot be any older than ca. 620 Ma, the depositional age of the rocks in the belt (Barr et al. 1996). If folding (and/or metamorphism) of the Stirling and East Bay Hills belts was coincident it must have occurred in a narrow time window around 620 Ma, the age of unfoliated granitoid plutons in both belts. In the Coastal belt, the Fourchu Group gives the impression of being the most deformed unit in southeastern Cape Breton Island, a feature that led many of those who first mapped the area (e.g., Weeks 1954) to infer that those rocks were the oldest in the area. In contrast to the Fourchu Group, rocks of the Main-à-Dieu Group, in addition to being the youngest units and those with the least volcanic aspect, are only weakly deformed. Minor folds are mainly absent but variations in the orientation of bedding imply that the rocks of the Main-à-Dieu Group are deformed into a broad open anticline.
16 Overlying all these belts is a sequence of clastic rocks of late Neoproterozoic to early Paleozoic age. The lowermost part of the clastic sequence is relatively coarse grained and immature, and was named the Morrison River Formation by Weeks (1954) and Hutchison (1952), but renamed as the Kelvin Glen Formation in the Stirling belt and the Bengal Road Formation in the Coastal and East Bay Hills belts by Barr et al. (1996). These units are overlain by a sequence of relatively mature and fine-grained units of Cambrian age. The common Cambrian stratigraphy implies that if the belts were separate from one another during their formation, which is unclear, they likely formed a single basement block by the Cambrian. Like the Main-à-Dieu Group, the Neoproterozoic to Cambrian rocks are weakly deformed, with no penetrative foliation; bedding orientations imply the presence of broad open folds with northeast-trending axes with shallow plunge to the northeast or southwest (Barr et al. 1996).
17 Barr et al. (1996) proposed that the Stirling, East Bay Hills, and Coastal belts represent amalgamated volcanic arcs with a change in subduction polarity between the docking of the Stirling and East Bay Hills belts (subduction to the current southeast) and the subsequent amalgamation of these conjoined belts with the Coastal belt (subduction to the current northwest). Although such a change in polarity might have involved a hiatus in deformation, it is not necessarily so. Either subduction polarity would require a northwest-southeast compressive regime that would produce the observed structural elements over the requisite protracted time period. Indeed, the compression of the Cambrian strata into northeast-trending folds suggests that northwest-southeast compression persisted after subduction ceased.
SAMPLE SELECTION
18 Samples used in this study were part of an archive of almost 2400 samples collected throughout the Mira terrane by Barr et al. (1996), Sexton (1988), and Thicke (1987). Although the samples are not evenly distributed due to limited exposure in some areas (especially in the southwestern part of the Stirling belt and in the inland parts of the Coastal belt), they provide a reasonably representative sampling of the rock units identified by Barr et al. (1996).
19 From this archive, we examined 550 thin sections of volcanic, volcaniclastic, and epiclastic rocks representing all of the Neoproterozoic units in the Mira terrane. Detailed petrographic analysis was done on a subset of over 100 mafic (metabasite) samples for which geochemical analyses were available (Barr et al. 1996; this study). From that subset, seventeen samples (Appendix Table A1) were selected for mineral analysis by electron microprobe to delimit the conditions of metamorphism further, including quantitative estimates of the pressure and temperature of metamorphism. These samples were chosen so as to give as wide a spatial distribution as possible, representing all five volcanic-sedimentary belts of the Mira terrane and containing well-developed relevant mineral assemblages.
PETROGRAPHY
20 Most samples contain relict igneous minerals, variably replaced by fine-grained metamorphic minerals dominated by chlorite, epidote, actinolite, prehnite, pumpellyite, quartz, and opaque minerals. Sericite is common in more felsic samples. Most samples contain albitic plagioclase, and relict pyroxene is common in mafic rocks. Many samples preserve relict igneous or sedimentary textures, such as intergranular and trachytic textures in mafic flows, eutaxitic banding in felsic flows, fragmental texture in tuffaceous rocks, and bedding in epiclastic rocks. Where present, the foliation is typically defined by chlorite and sericite. Protomylonitic fabrics occur in many samples, especially in the East Bay Hills and Fourchu groups. Overall, pyroclastic rocks appear to have better defined foliation than flow rocks.
Fig. 4. (a) Unfoliated fragment of amygdaloidal basalt and (b) foliated fragment of crystal lithic lapilli tuff, both in lapilli tuff sample FS88-1040b from the Fourchu Group. Both images were taken in plane polarized light; field of view is 2.5 mm in both cases.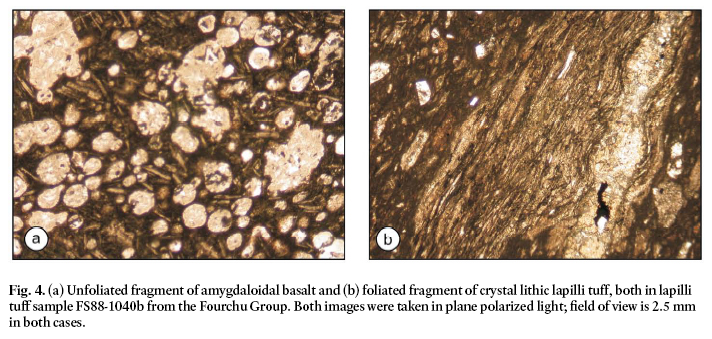
Display large image of Figure 4
21 Textural features indicate that deformation and metamorphism were long-lived phenomena. Samples containing lapilli with broken metamorphic mineral grains and truncated metamorphic textures are relatively common (particularly in the younger rocks of the Coastal belt). For example, Figure 4 shows two different lapilli from a tuffaceous sample from the Coastal belt; one of the lapilli is not foliated (Fig. 4a) whereas the other is foliated (Fig. 4b). The common occurrence of this phenomenon in these younger rocks suggests that the cycle of eruption-deposition-metamorphism was relatively continuous, with younger volcanic eruptions entraining fragments of the older, deeper, metamorphosed volcanic layers.
Fig. 5. Samples illustrating (a, b) prehnite-actinolite facies (prehnite-pumpellyite subfacies), (c, d) prehnite-actinolite facies, and (e, f) greenschist facies assemblages. Each pair of photomicrographs shows the same field of view in plane-polarized light (ppl) on the left and crossed polars (xpl) on the right. (a, b) Sample FC88-1513a from Main-à-Dieu Group showing angular vug containing Chl-Ep-Pmp (+Qtz), a characteristic assemblage of the Prehnite-pumpellyite sub-facies. Pumpellyite is present as randomly oriented fine (ca 20 µm) apple green grains (ppl) with bluish-green anomalous interference colours (xpl). Chlorite is present as pale green (ppl) mats of very fine laths with brownish interference colours. Epidote is coarser grained (up to 0.1 mm) yellow (in ppl) xenomorphic grains in the vug (near edge). Epidote is also evident in the groundmass of very fine-grained dark material (altered glass?) and plagioclase laths. (c and d) Sample FS-1116 from the Main-à-Dieu Group showing a rounded amygdale (right side of each image) containing Prh-Ep-Chl(+Qtz), characteristic of the Prehnite-actinolite facies. Prehnite is nearly colourless in ppl with anomalous yellow-pink interference under xpl, somewhat lower order than the intense yellow-green-blue interference colours of epidote. Relict felted texture is clearly visible in the basalt groundmass to the left of each image. Plagioclase is altered to very fine-grained sericite, and/or prehnite with interstitial Chl-Op-Ep (after glass?). (e and f) Sample FS88-1335 from the Stirling Group containing Act-Ep-Chl(+Qtz). Chl is not abundant and is very fine grained. The Act-Ep(-Chl) assemblage is unique to green-schist facies. Randomly radiating needles of actinolite are indicative of metamorphism without deviatoric stress.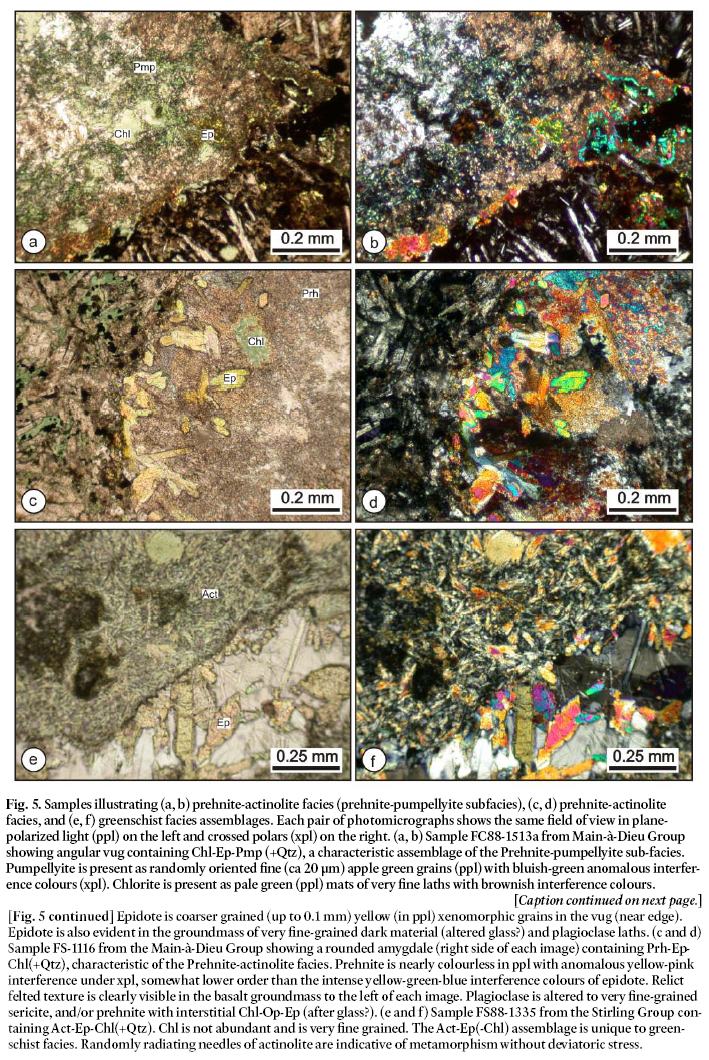
Display large image of Figure 5
22 Figure 5 shows typical examples of the mafic samples used in the detailed facies analysis presented below. Figures 5a and 5b show a typical prehnite-pumpellyite subfacies assemblage in amygdaloidal basalt. The mineral grains are extremely small (10–20 µm is not unusual) and easiest to identify in vugs, veins, and amygdales. The groundmass is typically little altered (meta-morphosed) and relict igneous minerals can be clearly identified. Figure 5c and 5d show the diagnostic prehnite-actinolite facies assemblage, Prh-Chl-Ep(+Qtz+W). Subtle features indicate somewhat higher grade than the sample in Figs. 5a and 5b: the grain size is slightly larger and the mineral phases are a little easier to distinguish. Also, the groundmass is more noticeably altered/metamorphosed, with the plagioclase laths clearly more replaced and the minerals in the interstitial groundmass more recrystallized and identifiable. Figures 5e and 5f show the diagnostic greenschist-facies assemblage of Act-Ep. Very fine-grained chlorite also is present in small amounts. The grain size is somewhat coarser than in either of the other examples. Also, the original igneous texture is obliterated, further evidence of the achievement of higher temperatures and, potentially, for longer time. However, one should note that all examples lack foliation, indicating that metamorphism occurred without deviatoric stress.
METAMORPHIC FACIES AND CHEMOGRAPHIC DIAGRAMS
23 All of the mafic rocks collected from southeastern Cape Breton Island were examined to determine the stable mineral assemblage(s) and those with chemical analyses (about 100 in total) were plotted on ACF plots appropriate to the determined facies (based on mineral assemblage). In order to plot whole rock analyses on the ACF diagrams, which require a value for both ferric and ferrous iron, the iron analyses (mostly Fe2O3T) were recalculated as 10% total iron as ferric, 90% as ferrous. In each pair of plots in Fig. 6, the left hand plot shows all the samples of that facies, the right hand plot shows the composition of only the specimens in which minerals were analyzed by electron microprobe (Appendix Table A1). Two of the latter samples, 11 and 12, are not shown in Fig. 6. Sample 11 has an under-determined assemblage, consisting only of Ep-Chl. This binary assemblage is common to all the facies and thus cannot be assigned to any one in particular. However, sample 11 is from the southernmost part of the Coastal belt where all other samples are in the prehnite-pumpellyite subfacies; sample 11, when plotted on Fig. 6b, falls exactly on the Chl-Ep line, in agreement with its observed assemblage indicating that equilibrium has been achieved. The other missing sample (12) cannot be plotted on these diagrams because it is at amphibolite facies as a result of contact metamorphism by a Devonian intrusion, as discussed below.
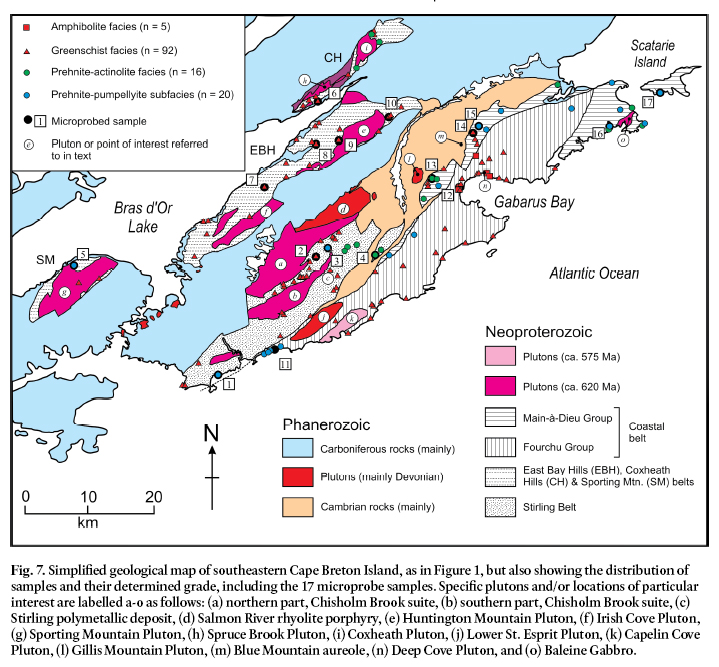
24 Figure 7 shows the areal distribution of the mafic volcanic samples for which the metamorphic facies were determined. The overall characteristics of each belt are described below.
Stirling belt
25 Samples from the Stirling belt (Fig. 7) are dominantly at greenschist facies and contain the diagnostic assemblage Tr(Act)-Ep-Chl (Fig. 6 e, f). Somewhat lower grade prehniteactinolite facies and/or prehnite-pumpellyite subfacies rocks (including microprobed samples 3 and 4) occur in the northeastern part of the belt, farther away from the plutons. This distribution suggests that heat-flow/temperature was highest closer to the plutons and/or to the southwest. The distribution of mineral assemblages shows little change with proximity to plutons, indicating that the metamorphism is not generally of “contact” origin, even though the plutons are younger than the volcanic rocks by 60 m.y. or more (Bevier et al. 1993; Barr et al. 1996). Clear contact metamorphic effects are seen only adjacent to the Devonian Lower St. Esprit Pluton (unit “j”, Fig. 7), where garnet-bearing calc-silicate rocks occur locally. The other Devonian intrusion in the Stirling belt, the Salmon River Rhyolite Porphyry, is not in contact with the Stirling Group. Stirling Group rocks in the septum between the northern and southern parts of the Chisholm Brook suite (“a” and “b” on Fig. 7) demonstrate some hornfelsic, splintery felted textures but no high-grade (amphibolite-facies) assemblages were noted in that area. The Chisholm Brook Suite contains many of the same greenschist and sub-greenschist facies minerals noted in the surrounding volcanic rocks, such as chlorite, epi-dote, sericite, and actinolite (McMullin 1984). These observations imply that the Stirling belt, particularly in the south, was more deeply buried than the other belts. A further implication of these data is that the Stirling belt was possibly subjected to the peak of metamorphism after 620 Ma, the date of intrusion of the Chisholm Brook Suite (Barr et al. 1990). However, it should be noted that this does not preclude the occurrence of lower grade metamorphism prior to 620 Ma.
Fig. 6. Chemographic (ACF) plots of phase stabilities under (a, b) prehnite-actinolite facies, (prehnite-pumpellyite subfacies), (c, d) prehnite-actinolite facies, and (e, f) greenschist facies. Plots a, c, and e show all geochemical specimens; plots b, d, and f show only those samples for which microprobe data were obtained (Appendix Table A1). Samples 1–4 from the Stirling Belt, 5–10 from the East Bay Hills, Sporting Mountain, and Coxheath belts, 11–12 from the Fourchu Group (Coastal Belt), and 13–17 from the Main-à-Dieu Group (Coastal Belt). Abbreviations: A=Al2O3+Fe2O3-Na2O-K2O; C = CaO-3.3P2O5; F=FeO+MgO+MnO (all in molecular proportions).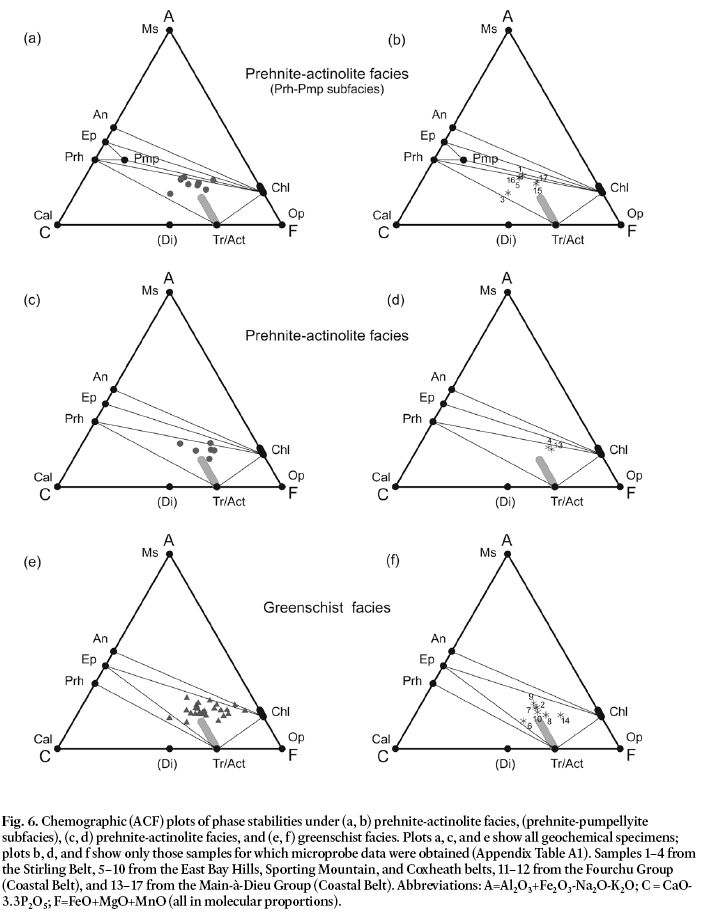
Display large image of Figure 6
Display large image of Figure 7
26 No relationship was found between the pattern of metamorphism and the Zn-Pb-Cu-Ag-Au deposit at Stirling (location “c”, Fig. 7) or other known mineral occurrences in the Stirling belt (e.g., Macdonald 1989; Kontak 1998).
East Bay Hills, Coxheath Hills, and Sporting Mountain belts
27 In contrast to the Stirling belt, volcanic and plutonic rocks in East Bay Hills, Coxheath Hills, and Sporting Mountain belts are demonstrably penecontemporaneous at about 620 Ma (Bevier et al. 1993). As in the Stirling belt, however, the rocks of these belts are dominantly at greenschist facies (Fig. 7), although in some cases the greenschist-facies assemblages have overgrown lower grade assemblages that are incompletely replaced.
28 In the East Bay Hills belt, the overprinting diminishes with distance from plutons, for example in samples 7 and 8 compared to 9 (Fig. 7), suggesting that heat from the intrusion was a factor. Although the metamorphism shows little dynamic influence (i.e., no foliation) the rocks are too hot and too far away from the plutons to suggest that the intrusion caused the metamorphism. Furthermore, pluton emplacement in the East Bay Hills belt was essentially coeval with volcanism (Bevier et al. 1993; Barr et al. 1996). Therefore it is suggested that the metamorphism in the East Bay Hills belt was a concomitant and continuous process and that eruption of magma, emplacement of plutons, and alteration/metamorphism were all part of a single tectonothermal event over a short span of time at ca. 620 Ma.
29 Few samples were studied from the Sporting Mountain belt, which is dominated by the Sporting Mountain Pluton and felsic volcanic rocks of the Pringle Mountain Group and not well represented in the sample collection (Barr et al. 1996; White et al. 2003). Two mafic samples have greenschist-facies assemblages similar to those of the East Bay Hills belt. A single sample (5) with a prehnite-pumpellyite subfacies assemblage was found near a faulted contact with the pluton (Fig. 7).
30 The Coxheath Hills belt has a somewhat higher proportion of mafic rocks than the Sporting Mountain belt, and yielded more results (Fig. 7). Samples from the southern part of the belt near the Spruce Brook Pluton (unit “h”, Fig. 7) are at green-schist facies, whereas samples from the northern part of the belt near the Coxheath Pluton (unit “i”, Fig. 7) include both greenschist facies and prehnite-actinolite facies. The four samples from northeast of the Coxheath Pluton (Fig. 7) lie within the propylitic zone of Lynch and Ortega (1997), but appear to have been minimally affected by the propylitic alteration, as none contain muscovite and only one contains calcite, in veins. However, some other samples examined from this area contain muscovite and/or calcite, minerals characteristic of the propylitic alteration associated with the Coxheath porphyry system. Our samples are not from the areas of pyrophyllite occurrences described by Kontak et al. (2003).
Coastal belt
31 In contrast to the older belts to the west, the Coastal belt is almost devoid of Neoproterozoic granitoid plutons. The exception is the Capelin Cove Pluton (unit “k”, Fig. 7) which is coeval with the volcanic rocks of the Fourchu Group at 574 ± 3 Ma (Bevier et al. 1993; Barr et al. 1996). The Coastal belt has a number of relatively large gabbroic plutons, of uncertain age, of which the Baleine Gabbro (unit “o”, Fig. 7) is the largest. Also present are Devonian granitoid plutons which show pronounced contact metamorphic effects. Hornfels and skarn developed mainly in Cambrian units indicate the presence of unexposed plutons in the Blue Mountain area (location “m”, Fig. 7) (Macdonald 1989; Barr and Macdonald 1992). The cluster of greenschist- and amphibolite-facies samples in the Main-à-Dieu and Fourchu groups to the north and west of Gabarus Bay (Fig. 7), including microprobe sample 12 (Appendix Table A1) are considered to be largely of Devonian origin, and are not investigated here.
32 Metamorphic effects in the Coastal belt are more varied than in the other belts. The Fourchu Group contains mostly greenschist-facies rocks (Fig. 7) except in the southwest (in the vicinity of sample 11). In contrast, the Main-à-Dieu Group appears to have been metamorphosed only to prehnite-actinolite facies, even around the Baleine Gabbro (unit “o”, Fig. 7). Rocks of the Main-à-Dieu group (Fig. 7) are the clearest examples of the lowest grades in the area (Fig. 5a-d). Perhaps the absence of coeval plutons means the absence of the pluton-associated heat pulse that seems to have occurred in the other belts. The Main-à-Dieu Group is clearly the coolest, shallowest, and least deformed and metamorphosed unit in southeastern Cape Breton Island.
MINERAL CHEMISTRY
33 Microprobe analyses focussed on minerals in the CMASH chemical system (Tables A2-A7). Other phases analyzed include plagioclase (which is mainly albitic), K-feldspar, muscovite-sericite, magnetite-ilmenite, titanite, and apatite. Those data are not presented here because none of these minerals is used in the interpretation of metamorphic facies and P-T conditions.
34 The structural formula for various phases that involve ferrous and ferric iron was calculated using the approach recommended by Schumacher (Appendix 2 of Leake et al. 1997). This method, which calculates a minimum Fe3+ content, permits a better estimate of the site occupancy of octahedral Al3+ and the Mg/(Mg+Fe2+) ratio, both of which are essential in calculating activity of end-member phases used in P-T calculations presented below. An estimate of Fe3+ is also critical in calculating the AF* factors and Mg# used in petrogenetic projections (see below). Schumacher’s approach is used to ensure charge balance and appropriate site occupancy for amphibole, pumpellyite, and clinopyroxene. Iron in epidote and prehnite substitutes for Al and hence is assumed to be ferric.
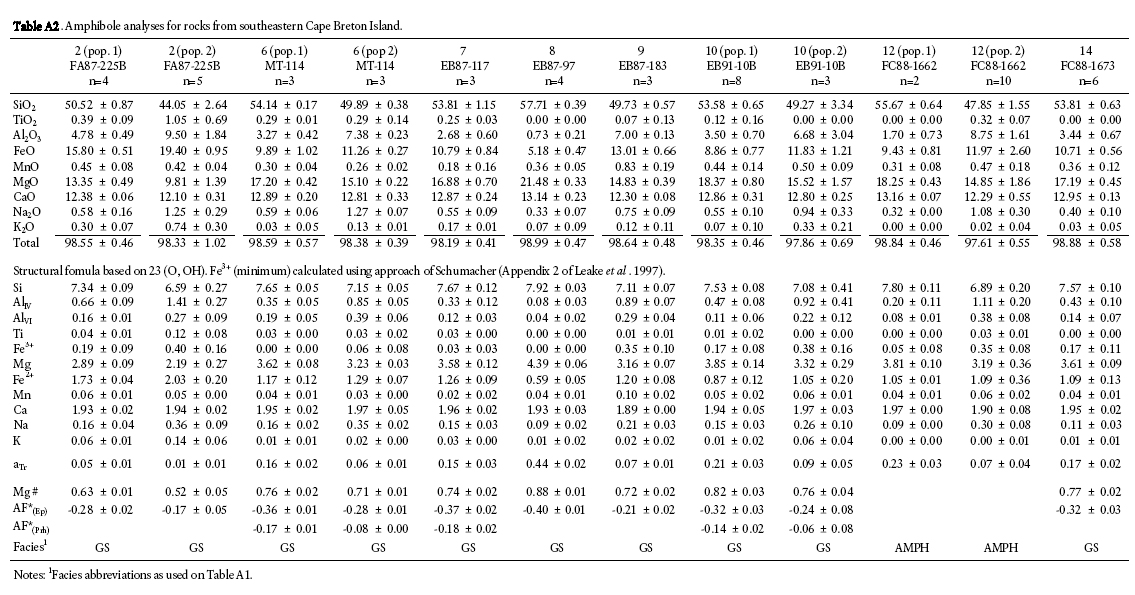
Amphibole
35 Appendix Table A2 shows the results of 54 amphibole analyses from 8 samples. Four of the samples (2, 6, 10, and 12) have two populations of amphibole distinguished mainly on the basis of Al content. Amphibole analyses in population 2 contain at least twice the Al content of those in population 1, and also show greater compositional variability. Population 2 amphibole is best classified as hornblende or actinolitic horn-blende with ≥ 1 Al per unit formula. The presence of a horn-blende or actinolitic hornblende component seems to coincide with higher grade and possible contact metamorphic effects. All the samples with hornblendic amphibole come from near plutons (sample 2 from near Chisholm Brook granodiorite; sample 6 from near the Spruce Brook Pluton, sample 10 from the Huntington Mountain Pluton, and sample 12 from the cluster of Devonian plutons/aureoles near Gabarus Bay (Fig. 7). Population 1 amphibole and amphibole from samples with a single amphibole composition shows low Al content and much smaller ranges in composition; they are classified as tremolite-actinolite amphiboles (< 1 Al per unit formula). All appear to be in greenschist-facies rocks.
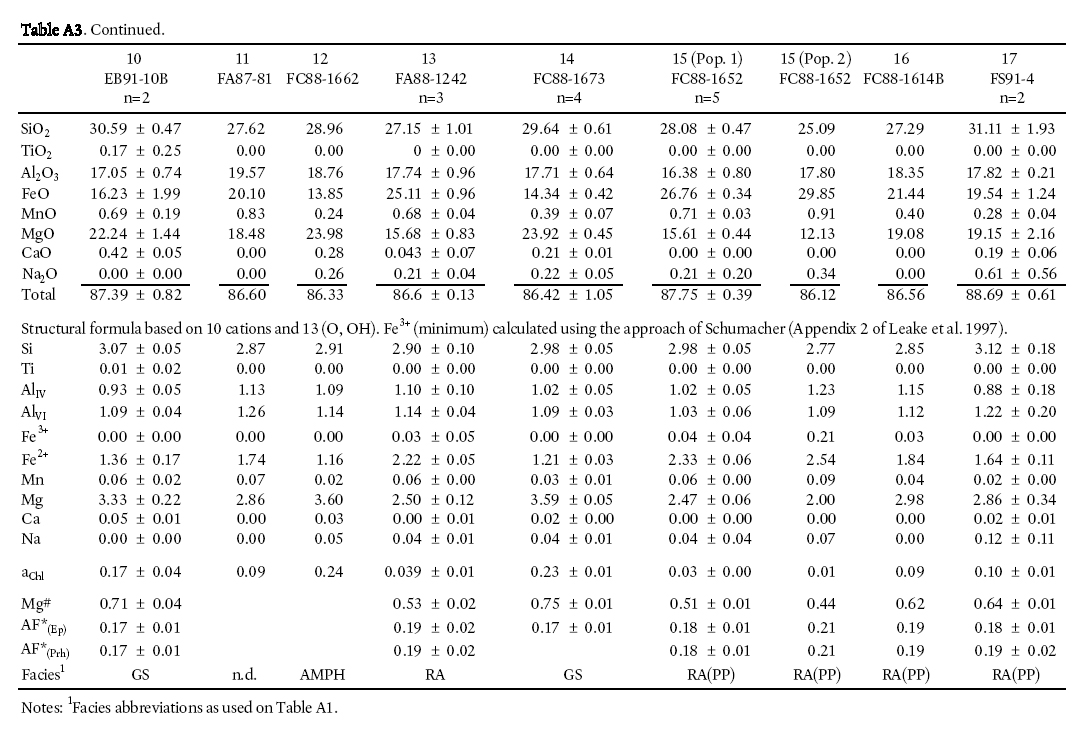
Chlorite
36 Chlorite compositions are close to the ideal clinochlore composition (Mg5Al2Si3O10(OH)8), with 3 (±0.1) Si, 2 (±0.1) Al, and 5 (±0.2) divalent (R2+) ions per unit formula (Appendix Table A3). In most cases, a slight excess of Al leads to deficiency in the number of divalent (R2+) ions (ca. 4.8 per unit formula). Calculated ferric iron content is near zero, but it is important to calculate it as it has an effect on the Fe2+ content and thus the Mg/(Mg+Fe2+) ratio, the most important factor in calculating clinochlore activity for P-T estimates below. Fe3+ content is also important in calculating the AF* factors and Mg# that are used in the petrogenetic projections below. Samples of lowest grade show the greatest deviation from ideal clinochlore formula. Sample 11, one analysis from sample 15, and sample 16 show significant Al content (between 2.27 and 2.4 Al ions per unit formula).
37 Chlorite appears to be absent from sample 3 and present in very small amounts in sample 6. In both of these cases the chemographic projections agree with the observed absence or near-absence of chlorite: on Fig. 6b sample 3 plots near the Prh-Act join and away from the Chl apex and on Fig. 6f, sample 6 plots near the Ep-Act join and away from the Chl apex. This is further evidence that the assemblages present in the rocks of the study area are at or near equilibrium.
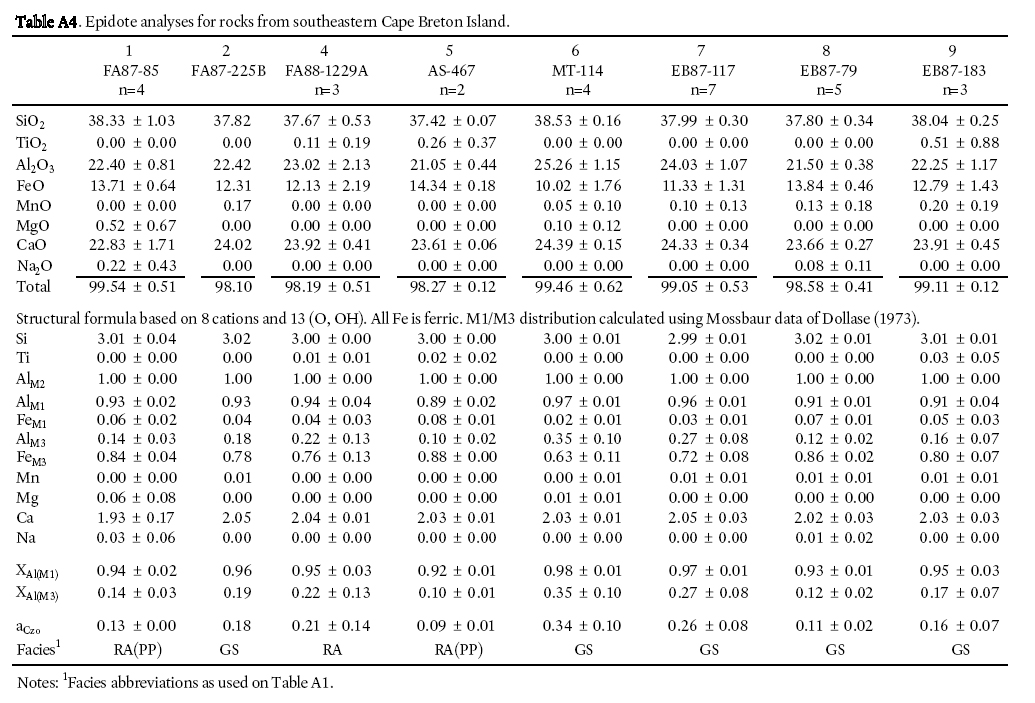
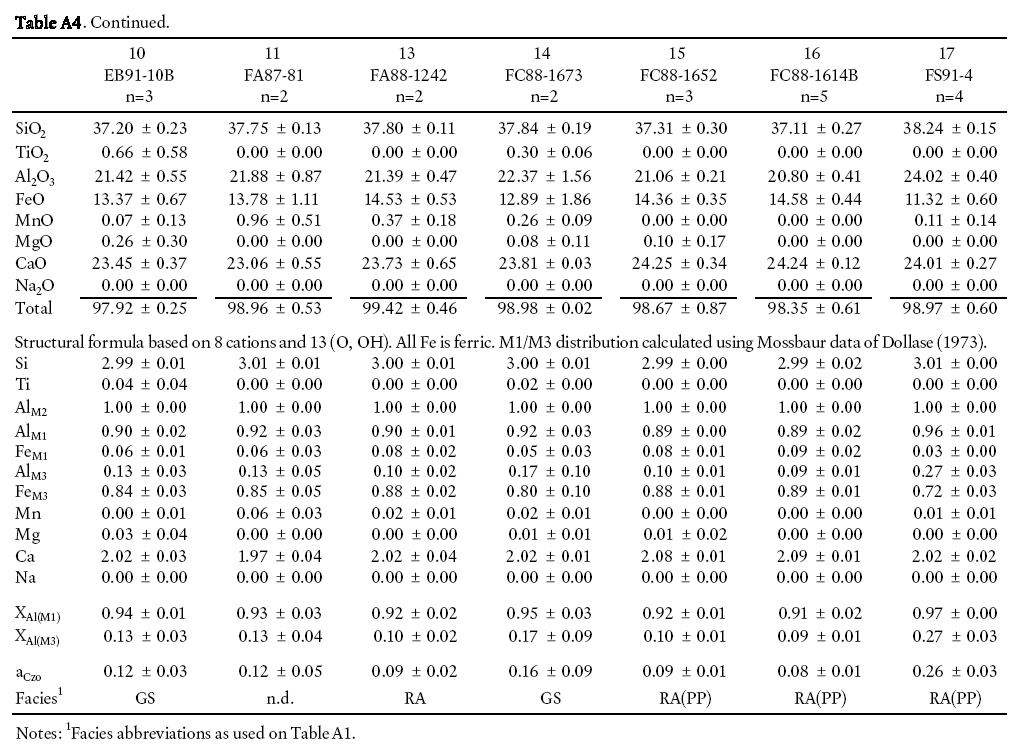
Epidote
38 Epidote compositions appear to be relatively homogeneous, with some variation in the Al3+ and Fe3+ contents (Appendix Table A4). The slight variation from sample to sample does not appear to be related to grade. Structural formulae are calculated on the basis of 8 cations and that all Fe present is ferric (Deer et al. 1986). The structural formula of epidote-clinozoisite has 3 distinct octahedral sites (Deer et al. 1986) with different Al/Fe3+ affinities. Dollase (1973) determined, using Mossbauer data, that the M2 site is universally filled by Al, but systematic partitioning of Al and Fe3+ occurs between the M1 and M3 sites, with Al dominant in the M1 site and Fe3+ dominant in the M3 site. Dollase (1973) determined a site distribution coefficient KD = (Fe/Al)M1/(Fe/Al)M3 with a range of 0.1 to 0.2. A value of KD = 0.1 was used to determine the M1 and M3 site occupancy shown in Appendix Table A4. These data aid in the calculation of an activity for clinozoisite (Czo) in the P-T calculations below.
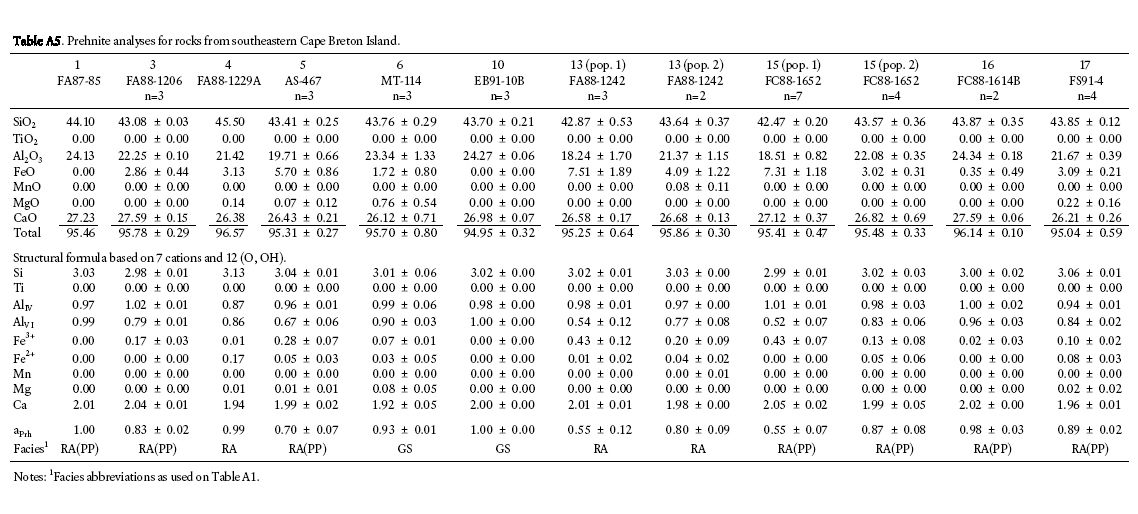
Prehnite
39 Most prehnite analyses, with the exception of sample 4, show good agreement with the ideal formula, (Ca2Al2Si3O10(OH)2), and three samples (1, 10, and 16) contain nearly pure end member prehnite (Appendix Table A5). However, in sample 10 prehnite is present only in veins and hence may be hydro-thermal in origin and not part of the equilibrium assemblage. Compositions vary somewhat both within and between samples, as a result of Fe3+ substitution for Al in octahedral coordination (Al/(Al+Fe) = 0.7–1.0). The analysis from sample 4 is somewhat anomalous, with slightly higher Si and lower Al and Ca compared to most other analyses.
40 Samples 13 and 15 contain two populations of compositions, one about 55% and one about 80% Ca2Al2Si3O10(OH)2. This heterogeneity can be seen in a secondary electron image (Fig. 8), in which variation in grey level indicates differing mean atomic number. Light grey portions have high Fe, darker portions are rich in Al. Interlayering of structural types (though not necessarily compositional variants) has long been evoked as the reason for the anomalous optical properties of this mineral including anomalous interference colours and incomplete extinction (Deer et al. 1992). The simplest explanation for the compositional lamellae, which are too fine to be seen optically, is two phases of growth of prehnite via two different reactions, as discussed later in this paper.
41 Correlation between prehnite composition and grade is not apparent in our data. Although some workers have suggested either an increase in Fe with increasing grade (e.g., Liou et al. 1983; Terabayashi 1988), or a decrease (e.g., Cho et al. 1986), our results are consistent with those (e.g., Cho 1991; Digel and Gordon 1995) who have reported no relationship between Fe content in prehnite and metamorphic grade.
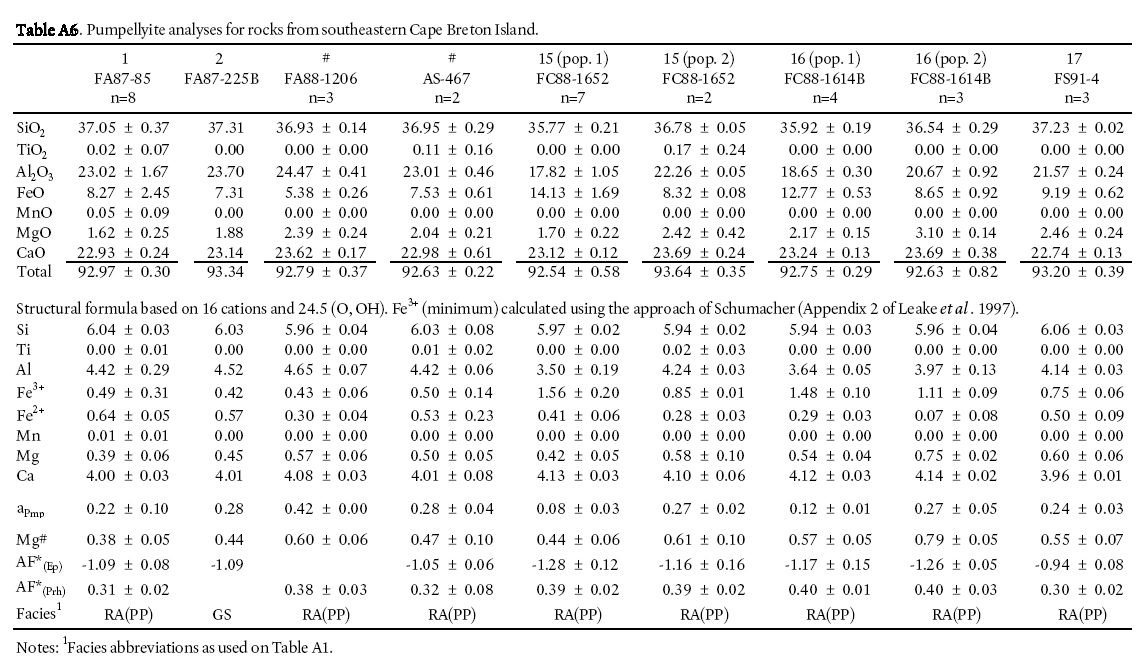
Pumpellyite
42 The ideal end-member composition of pumpellyite is Ca4Al5MgSi6O21(OH)7. Analyses from the study area are “well-behaved”, with 6 Si and 4 Ca (Appendix Table A2). The major substitutions are Fe3+ for Al and Fe2+ for Mg2+. As with amphibole and prehnite, some samples, in this case samples 15 and 16, contain multiple populations of pumpellyite. The remaining samples have what appear to be average compositions with about 0.5 of the 5 octahedral Al ions replaced by Fe3+ (i.e., XAl = 0.9) and about equal amounts of Fe2+ and Mg2+. Deer et al. (1986) noted that, although natural pumpellyite appears to have a complete solution from pumpellyite to julgoldite (the Fe analogue), only a few documented occurrences have XAl less than 0.90. Samples 15 and 16 are thus highly unusual in having XAl ≈ 3.5/5.0 (≈0.7). As with prehnite noted above, compositional variation occurs on the µm scale. In sample 15, for example, grains of pumpellyite 10s of µm apart give the full range of pumpellyite composition shown in Appendix Table A6.
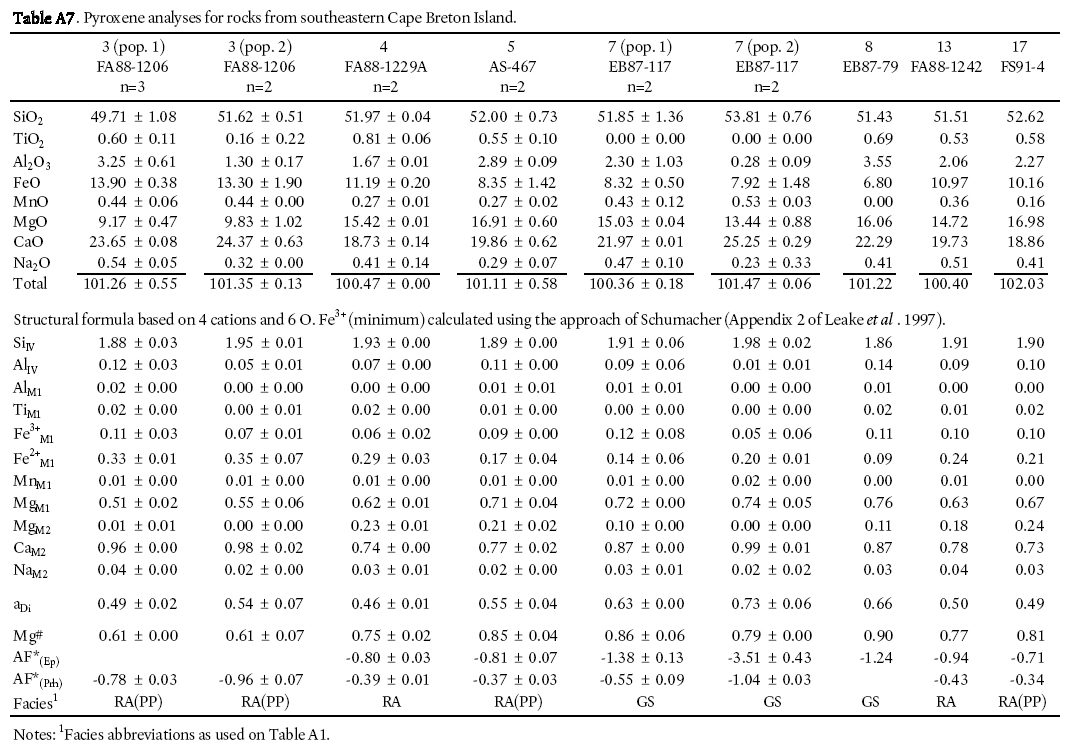
Clinopyroxene
43 Clinopyroxene is present in 7 of the mafic samples analysed by microprobe (Appendix Table A7). A small amount of Fe3+ is necessary for charge balance. All the analyses have close to 2 Si and 2 R2+ ions per unit formula. Pyroxene is commonly reported from rocks of this grade and is usually dismissed as “relict” and/or “metastable” with the inference that it is a left over from the protolith igneous assemblage. However, the limited set of pyroxene analyses reported here show subtle features which suggest that pyroxene was an active participant in the low-grade metamorphism. Most of the pyroxene analyses contain more Ca and less Al (i.e., are more diopside-rich) than is usual for volcanic clinopyroxene (Deer et al. 1997). Analyses from samples 3 (two populations), 7 (two populations), and 8 all plot in the diopside field (Fig. 9).
Fig. 8. (a) Photomicrograph of prehnite + epidote filled amygdale in sample15 (FC88-1652). Box shows area of figure (b). (b) Secondary electron image of prehnite and epidote from area shown in (a). Shade of grey is related to Fe content. Epidote, with highest Fe content is palest. Note the mm-scale intergrowth of prehnite of different compositions. High-Fe prehnite is light grey, Al-rich prehnite is dark grey.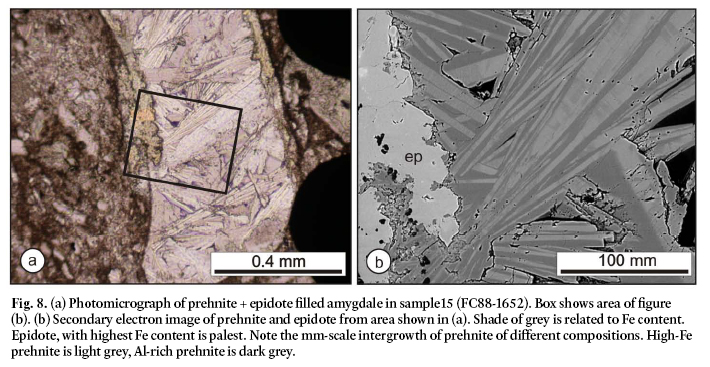
Display large image of Figure 8
44 Samples 3 and 7 contain a wide range of compositions (shown on Appendix Table A7 as two populations). The variation is mostly in the Al content. Both populations in samples 3 and 7 are high Ca (>85% Ca in M2 site) as is the pyroxene in sample 8. The remaining samples (4, 5, 13, and 17) have compositions that are more typical of igneous clinopyroxene though the amount of Al, at 1.67–2.89 wt%, is low to very low for igneous pyroxene (Deer et al. 1997). Based on structural formulae most of the pyroxenes lack Al in the M1 site and the maximum value (0.02 ions per unit formula) is at the low range for igneous augite (Deer et al. 1997). These analyses show that the pyroxene present in these rocks is likely not of original igneous composition, and indicates that diopside-forming equilibria may be involved. This possibility is reinforced by the fact that the most diopsidic pyroxenes are in samples of higher grade (based on other minerals in the assemblage). For this reason, equilibria involving diopside were investigated in the evaluation of P-T conditions.
ROLE OF CLINOPYROXENE
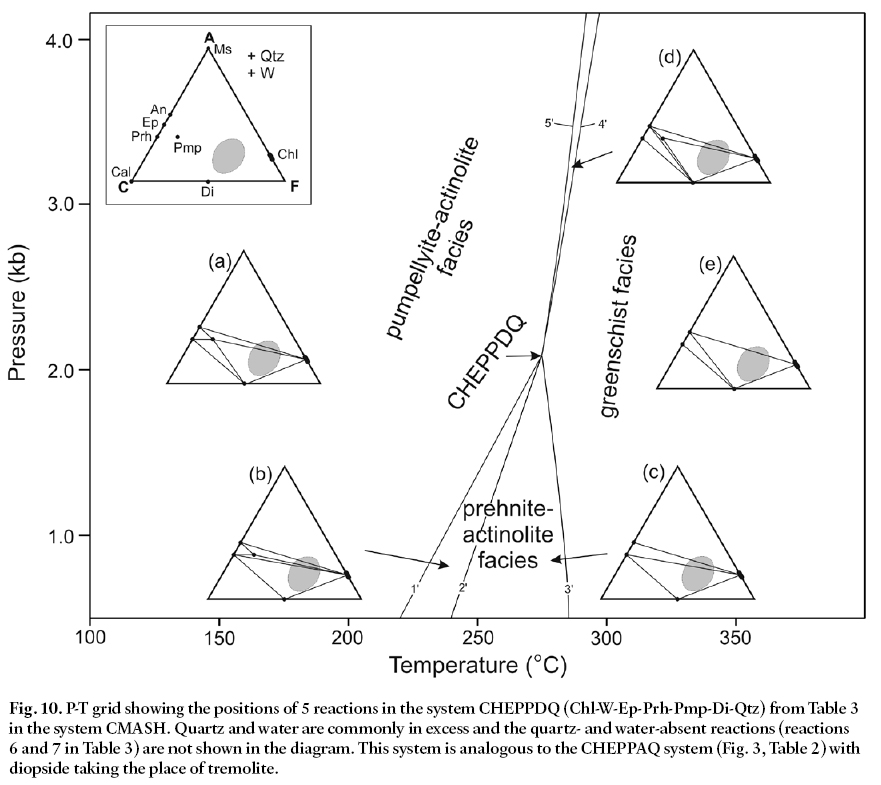
45 As described above, pyroxene in the samples used in this study tends to be more Ca-rich than typical igneous clinopyroxene, and several are diopside (Fig. 9). Clinopyroxene (diopside) plots on or near the CF side of the ACF diagram (Figs. 6, 10). Although we would not suggest that the diopside (Di) was actively formed by metamorphic processes, the destruction of the Fe-Mg components of augite will make the remaining pyroxene more calcic. Furthermore, we surmise that once formed (by whatever method), Di can participate as a phase in the assemblage. If correct, then equilibria (assemblages) involving Di should be stable in this P-T region. To test this hypothesis we calculated the position of the equilibria of the Tr-absent assemblage Chl-W-Ep-Prh-Pmp-Di-Q which we abbreviate as CHEPPDQ (Table 3, Fig. 10). This assemblage is the Di-bearing equivalent of the CHEPPAQ assemblage used in Fig. 3. Using an average Di activity from those found in the samples from the study area (Table 3) and the same activities for the other phases that we used to calculate the CHEPPAQ diagram (Fig. 3), we calculated a CHEPPDQ equilibrium net (Fig. 10). Because Di and Tr have very similar compositions (i.e., Di and Tr plot near one another on the ACF plot) the reactions involved in CHEPPDQ are nearly identical to those of CHEPPAQ (Table 3), and hence the diagrams in Figs. 3 and 10 are similar. The chemographic plots (a-e on Fig. 10) have nearly identical topology to those of Fig. 3. One difference is that Pmp lies to the right of the Di-Ep join (Fig. 10) but to the left of the Tr-Ep join (Fig. 3). This difference results in a change in the order of the two high-pressure equilibria (i.e., equilibria 4 and 5, Fig. 3 and Table 2 compared to 4’ and 5’, Fig. 10 and Table 3).
Fig. 9. The pyroxene quadrilateral diagram showing compositions of clinopyroxene in samples from the study area (data from Appendix Table A7).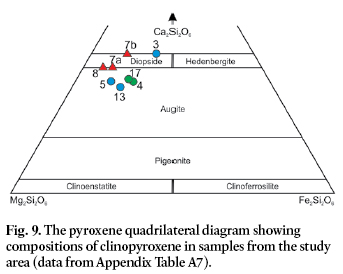
Display large image of Figure 9
Table 3. List of equilibria defining CHEPPDQ invariant point in system CMASH.

Display large image of Table 3
Display large image of Figure 10
46 Di occurs on the low-T side (i.e., is a reactant in the prograde sense) of equilibrium 1’. Hence, if Di is present (as a relict igneous phase) in rocks of this grade the reaction can proceed. Equilibrium 1’ generates Prh-Chl from Pmp-Di. Equilbirum 2’ will not affect most mafic rocks (grey area) which will already have lost all of their Pmp by equilibrium 1’. The most significant result is that Di will persist in low-grade rocks, particularly if it is a reactant (in the prograde sense). Note that on Fig. 4, equilibria 3’ and 4’ involve Di as a product, generating a Di-Ep-Chl assemblage, the diopside equivalent of the standard Tr-Ep-Chl assemblage.
47 At the lowest grades in the study area, equilibria 1’ and 2’ (Fig. 10) were active (favouring the diopside-bearing assemblages represented by chemographic plots “b” and “c” on Fig. 10) but as the temperature increased, equilibrium 3 (Fig. 3) operated, generating Tr (assemblage “e” on Fig. 3). The participation of diopside at the lowest grades, albeit in a reactant role, followed by the appearance of tremolite as a product at the higher temperatures, generated assemblages in the order Prh-Chl-Di (+Pmp) (prehnite-pumpellyite subfacies of the prehnite-actinolite facies), Prh-Chl-Di (prehnite-actinolite facies), and finally Tr-Chl-Czo (greenschist facies). As a result, most mafic rocks will not show the assemblage Tr-Prh. Only greenschist-facies rocks with high Ca (lowermost part of the grey oval on Fig. 3, plot “e”) will contain Tr-Prh-Ep. Among the samples from this study, only one (# 6) contains Tr-Prh.
PETROGENESIS
48 A simple comparison of phase compositions cannot be used to elucidate similarities or differences among samples because bulk rock composition plays a significant role in the changing compositions of phases. Furthermore, it is important to consider also the coexisting phases and their compositions. The most powerful technique in common use for dealing with such data is that of projections of phase relationships in multi-dimensional composition space onto simplified 2-D planes (Thompson 1957; Greenwood 1975). If samples to be compared have similar overall compositions and have identical phases present, samples can be “projected from common phases” and compared.
49 The AF*-Mg# projection, first proposed by Harte and Graham (1975), is the one most commonly used today in comparing very low-grade metabasite (Springer et al. 1992; Beiersdorfer 1993; Bevins and Robinson 1993; Beiersdorfer and Day 1995; Robinson and Bevins 1999; Schiffman and Day 1999; Day and Springer 2005). The projection factors are slightly different depending on the assemblage present. For samples projected from Qtz-Ab-W-Ep, the AF*(Ep) factor is (Al2O3 + Fe2O3 - 0.75 CaO - Na2O) / (Al2O3 + Fe2O3 - 0.75 CaO - Na2O + FeO + MgO). For samples projected from Qtz-Ab-W-Prh, the AF*(Prh) factor is (Al2O3 + Fe2O3 - 0.5 CaO -Na2O) / (Al2O3 + Fe2O3 - 0.5 CaO - Na2O + FeO + MgO). The Mg# is MgO/(MgO + FeO).
50 Figure 11 shows the projection from Qtz-W-Ab-Ep (a, b, and c) and from Qtz-W-Ab-Prh (d, e, and f) of coexisting mineral pairs in samples from the study area. Samples 1, 2, 5, 15, 16, and 17 contain Chl-Pmp pairs (and Ep) and Fig. 11a shows the projected relationships between the pairs from the Ep projection. Though the Chl-Pmp pairs show a consistently positive slope (i.e., Chl is always more magnesian than Pmp), there appear to be two populations of Chl-Pmp pairs based on the slope of the joins: (1) samples 1, 5 and 17 show shallower slopes on the projection (i.e., Chl has a proportionally higher Mg# than Pmp) and (2) samples 2, 15, and 16 have steeper slopes (i.e., Chl has a Mg# closer to the Pmp value). This difference may represent the progress of one or more equilibria. On the basis of mineral-ogy discussed above, 1, 5 and 17 are the lowest grade samples in the area with the classic prehnite-pumpellyite assemblage of Prh-Pmp-Chl (+Qtz+W+Ep+Pl+Px) and the complete absence of actinolite, which appears in the prehnite-actinolite and greenschist facies. Sample 2 is at greenschist facies on the basis of the diagnostic mineral assemblage Act-Chl-Ep. The pumpellyite that remains in the sample appears relict.
51 Samples 15 and 16 are unusual in that they both contain 2 different compositions of pumpellyite, the less magnesian of which is displayed on the diagrams. The more magnesian compositions produce negative slopes for the Chl-Pmp pairs on Fig. 11a. It appears that the progress of equilibria 1 and/or 2 (Fig. 3, Table 2) will produce this effect. Both these reactions involve the removal of Pmp and the production of Chl. The Feend-member ferromagnesian minerals are typically the first to disappear, thus the progress of reactions 1 and/or 2 (or 1’ and 2’) would preferentially react out Fe-Pmp and generate Fe-Chl. Partial progress (i.e., continuous reaction) of these equilibria will result in gradually more Mg-rich Pmp and more Fe-rich Chl. That is exactly what is seen on Fig. 11. The Pmp-Chl joins on Fig. 11a show a steepening of the slopes for samples 15 and 16. The mechanism could lead to joins that have a negative slope. As mentioned above there are two populations of Pmp in samples 15 and 16 and in both cases the second population (not shown on Fig. 11) has Mg# higher than coexisting Chl (which shows no variation) and, if plotted, produce tie lines with negative slope. Because Pmp projects above Chl on Fig. 11d, the situation is reversed on that diagram; the slopes start as negative (lower grades) and gradually become steeper and eventually positive.
Fig. 11. Projections from epidote (a, b, c) and prehnite (d, e, f) of mineral pairs in mafic samples from the study area. Chlorite-pumpellyite pairs (samples 1, 2, 5, 15, 16, and 17) are shown in (a) and (d), chlorite-actinolite (tremolite) pairs (samples 2, 7, 8, 10, 14) in (b) and (e) and chlorite-diopside pairs (samples 4, 5, 7, 8, 13, 17) in (c) and (f).
Display large image of Figure 11
52 The above mechanism evoked to explain the steepening of the Pmp-Chl joins on Fig. 11a, d also has an effect on the composition of coexisting prehnite. The progress of reactions 1 and then 2 (Fig. 3, Table 2) or 1’ and 2’ (Fig. 10, Table 3) consumes Pmp and generates Prh. Reaction 1 or more likely reaction 1’ (Fig. 10, Table 3) consumes Pmp and Di and generates Prh and Chl. Pumpellyite contains significant Fe3+, but chlorite does not, thus the destruction of ferric Pmp (by reaction 1’) has the potential to generate Fe3+-rich Prh, the only phase in the product assemblage that can contain ferric iron. Reaction 2 (Fig. 3, Table 2) which is also reaction 2’ (Fig. 10, Table 3) involves the ultimate breakdown of pumpellyite to chlorite, prehnite and epidote. In this case the product assemblage contains two phases that can contain the Fe3+, epidote and prehnite, and the former is more commonly ferric. Because epidote can contain some (if not all) of the ferric iron prehnite generated by reaction 2 (2’) will be aluminous. Since the progress of reaction 1’ will already have depleted Pmp of Fe3+, the remaining Pmp just before its ultimate breakdown (reaction 2) will be at its most magnesian and aluminous. Thus the products will also be aluminous. Thus, the mechanism that explains the steepening Pmp-Chl joins shown on Fig. 11a also explains early Fe-rich Prh (a product of reaction 1’) followed by Al-rich Prh (a product of reaction 2’). The secondary electron image of prehnite from sample 15 (Fig. 8b) shows exactly this relationship; bright (Fe-rich) cores, with darker (Al-rich) overgrowth.
53 Figure 11d shows chlorite-pumpellyite pairs in most of the same samples as projected from prehnite (sample 2 does not contain prehnite and is omitted). As with the epidote projection samples 1, 5, and 17 show parallel tie lines, samples 15 and 16 show the same steeper slope suggesting a different reaction involved in their stability.
54 Figures 11b and 11e show the chlorite-actinolite pairs projected from both epidote (Fig. 11b) and prehnite (Fig. 11e). Samples 2, 8 and 14 do not contain prehnite and are not shown on Fig. 11e. As noted above, prehnite may not be part of the stable assemblage in sample 10 but this does not show up as an obvious discrepancy on this diagram. In both Fig. 11b and 11e the chlorite-actinolite lines are close to parallel, suggesting that the samples have equilibrated under similar conditions. Only sample 14 on Fig. 11b shows a different slope suggesting that a different process/reaction may be involved in equilibration. This discrepancy between sample 14 and others in the area may be the result of later (Devonian) contact metamorphism. Sample 14 comes from the general area of the Devonian Blue Mountain aureole (Fig. 7).
55 Figures 11c and 11f show projections for diopside-chlorite pairs. Sample 8 does not contain prehnite and is therefore not included in Fig. 11f. In contrast to the other mineral pair projections in Fig. 11, the diopside-chlorite pairs are present over the full range of metamorphic facies. Comparison of the rocks of different facies reveals a slight and systematic variation in Mg# with increasing grade with chlorite become more magnesian with respect to diopside as grade increases. In Fig. 11c (epidote projection) the chlorite-diopside tie lines in the low-grade samples (4, 13, and 17) have identical and somewhat low slopes, sample 7 is somewhat steeper and sample 8 is steepest (i.e., chlorite and diopside have much closer Mg# values). The variation is less visible in the prehnite projection (Fig. 11f) because sample 8 cannot be shown. As with other lines of evidence this well behaved smooth variation in the projected ties lines for diopside support the suggestion that diopside is an active participant in equilibrium processes in these rocks, and that the behaviour gradually shifts as grade increases.
Fig. 12. P-T values calculated using TWEEQU (Berman 2007) plotted on the facies grid of Fig. 2. Most of the assemblages are univariant and require a “known” pressure in order to calculate a temperature. In this case, for univariant samples, T values are calculated using a set pressure of 2 kb (200 MPa).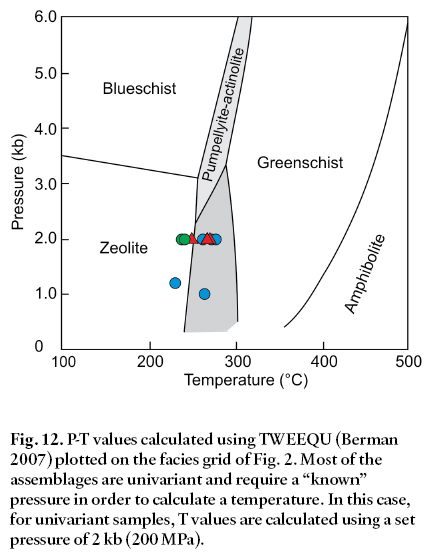
PRESSURE-TEMPERATURE ESTIMATES
Qualitative estimates from mineral assemblages
56 The mineralogies of the samples in this study indicate prehnite-actinolite to greenschist facies. Using the facies diagram of Liou et al. (1987) and their suggested P-T ranges, metamorphic temperatures lay between 250 °C and 450 °C. The absence of clear pumpellyite-actinolite facies assemblages suggest that pressures did not exceed 3 kb (300 MPa). Furthermore, the dominance of prehnite over pumpellyite suggests that the fluids were water-rich. Liou et al. (1987) reported that pumpellyite is normally dominant and that CO2-rich fluids lead to the formation of calcite instead of prehnite. Taken together, these observations suggest that metamorphism in southeastern Cape Breton Island occurred at pressures less than 3 kb, temperatures between 250 ° and 350 °C and fluids relatively poor in CO2. These conditions indicate a metamorphic gradient between 25 °C/km and 50 °C/km, conditions best labelled burial metamorphism (Smulikowski et al. 2007).
Pressure-temperature calculations
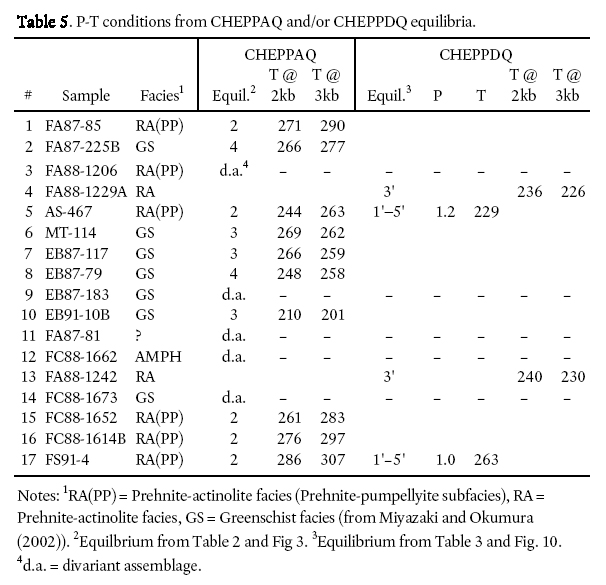
57 Using the analyses presented in Tables A2-A7, the positions of the relevant equilibria in the CHEPPAQ or CHEPPDQ systems (as appropriate) were calculated using the TWEEQU software of Berman (1991, 2007), thermodynamic properties of Berman (1988) for all phases except pumpellyite (Evans 1990), and the ideal solution models as given in Table 4. Quartz and water are presumed to be pure (unit activity). Because ideal activities are used it was important to ensure that the recalculated mineral formulae (Tables A2 to A7) are realistic. In particular it was important to make some estimates of iron oxidation state, particularly for minerals with significant amounts of both ferrous and ferric forms, such as tremolite (Tr) and pumpellyite (Pmp) (Tables A2 and A6). For tremolite (Tr) and pumpellyite (Pmp) the distribution of Fe into Fe3+ and Fe2+ states is critical in calculating both the octahedra site occupancy of Al (XAl) and the Mg/Mg+Fe2+ ratio (XMg) and hence the activities. In both these phases, activity is proportional to one of these site occupancies to the fifth power. Thus, even small errors resulting from ignoring iron oxidation state and occupancy will lead to significant errors in activity. Ferrous/ferric issues are considerably less important in other phases. In the case of chlorite and diopside, ferric content was calculated but is typically insignifi-cant or has little effect on activity for computational reasons. In chlorite, ferric iron content is commonly <1% of the ferrous content. Therefore, though activity is XMg5, the ferric content is so small that it has little effect. In diopside, ferric content may be larger, but because the activity is proportional to a single site occupancy (i.e., XMg is not raised to a large power) the ferric content has little effect. Indeed, despite showing wide ranges in ferric iron content, diopside has the smallest range of activity of all the phases studied. In the case of epidote and prehnite, all iron is considered ferric (Deer et al. 1997). The calculated pressures and temperatures for the selected samples are tabulated in Table 5.
58 Five of the samples, 3, 9, 11, 12, and 14, have divariant assemblages and thus no P-T determinations could be made. The remaining samples are univariant in either CHEPPAQ or CHEPPDQ and two of them are invariant in CHEPPDQ. For invariant assemblages TWEEQU defines a single pressure and temperature. For univariant assemblages one must choose a pressure to determine a temperature, or vice versa. The P and T were determined for the invariant assemblages and temperatures determined for the univariant assemblages at both 2 and 3 kbar (Table 5).
59 The invariant P-T and the temperatures at 2 kbar (except sample 10) are shown on Fig. 12. Sample 10 is excluded from further discussion because it appears that the assemblage used to calculate the T reported on Table 5 is not in equilibrium. Using equilibrium 2, sample 10 yields a temperature of 210 °C, probably 100 °C too low for a greenschist-facies rock. To calculate this value we used the pure end-member prehnite that is found in veins in the rock. This anomalous temperature supports the interpretation that the prehnite is a later, possibly hydrothermal, phase and is not in equilibrium with the rest of the assemblage. Excluding prehnite from sample 10 makes the assemblage divariant and no temperatures can be calculated.
DISCUSSION
60 The temperatures determined using TWEEQU and the CHEPPAQ assemblages form a tight cluster between 244° (sample 5) and 286°C (sample 17) (at 2 kbar). Note from Table 5 that only the prehnite-pumpellyite or greenschist samples yielded temperatures using the CHEPPAQ assemblages, as shown on Fig. 12 as the red triangles and blue circles at 2 kbar. The remaining points were calculated using the CHEPPDQ equilibria.
61 Regarding the temperatures determined using the CHEPPAQ assemblages, it is important to note that there is no overall difference in the temperatures determined for the prehnite-pumpellyite vs. the greenschist-facies samples (the average for both clusters is 268 °C). Also, whereas this temperature is in perfect agreement for the prehnite-pumpellyite samples, it is too low (by at least 50 °C) for the greenschist-facies samples. This inconsistency is likely the result of the choice of ideal activity models for the phases. Temperatures for the prehnite-pumpellyite-facies samples are all based on equilibrium 2 (Table 2), which is tremolite-absent. The temperatures for the greenschist-facies rocks were determined using either equilibria 3 or 4 (Table 2), both of which involve Tr on the high-T side. Any underestimation of the activity of tremolite will lower the temperatures determined using both of the equilibria. If one assumes that equilibrium has been reached in these rocks, then the above results suggest that tremolite requires a slightly non-ideal activity (higher than ideal). However, it should be emphasized that the temperatures determined are remarkably close to the conditions suggested by the mineral-ogy. In general, P-T determinations have not been done on rocks of this grade elsewhere, probably because they generally are considered to show disequilibrium among phases and thus are intractable to this approach. These data show that the assumption is likely false.
62 Because some of the samples collected contained diopside and, as described earlier, evidence exists for active participation of diopside in equilibria, we also calculated P-T for the CHEPPDQ equilibria, using the TWEEQU software and the activities given in Tables A2 to A7. Two of the samples (5 and 17) are invariant in CHEPPDQ and two (4 and 13) are uni-variant. Note that the invariant CHEPPDQ assemblages also have one equilibrium in common with CHEPPAQ (equilibrium 2). Therefore, we calculated CHEPPAQ temperatures for those samples above. The P-T conditions determined using CHEPPDQ should not be significantly different.
63 The two univariant CHEPPDQ assemblages (samples 4 and 13) are prehnite-actinolite facies and should yield temperatures between those of the prehnite-pumpellyite- and greenschistfacies samples. In fact, the temperatures determined are lower (by about 30 °C). The invariant CHEPPDQ assemblages also yielded lower temperatures than those determined using CHEPPAQ, as well as pressures that are unrealistically low (1 and 1.2 kbar corresponding to 3 to 4 km of burial).These shallow depths would require geothermal gradients of at least 80 °C/km, which is probably too high for a burial metamorphic environment. More likely, the low temperatures and very low pressures are the result of using diopside activities that are somewhat too low. However, it should be noted that although these calculated pressures are somewhat too low, they are still close (within usual accepted P-T errors) to the expected values based on assemblage and again suggest that diopside can be considered an active participant in equilibria in these rocks.
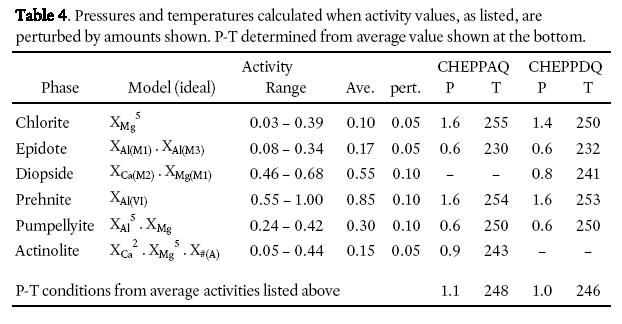
Table 4. Pressures and temperatures calculated when activity values, as listed, are perturbed by amounts shown. P-T determined from average value shown at the bottom.
Display large image of Table 4
Table 5. P-T conditions from CHEPPAQ and/or CHEPPDQ equilibria.
Display large image of Table 5
64 The good P-T results demonstrated here suggest that an equilibrium thermodynamic approach in calculating P-T conditions in very low-grade assemblages can be productive. We further investigated the systematic variation shown by the CHEPPAQ and CHEPPDQ invariant points by using average values for the phases to calculate an “average” P-T and then examined the variability in P-T determined when input activities were perturbed by the range in values seen in these rocks. Table 4 shows the average activity values chosen. These values generated a CHEPPAQ invariant point at 248 °C and 1.1 kbar, and a CHEPPDQ point at 246 °C and 1.0 kb. The average values used were lowered by between 20 and 50% (the amount of each perturbation is listed in Table 4) and the position of the invariant points were recalculated. The results in each case are similar to the results calculated from the average values; temperature variation was ≤ 18 °C, pressure variation was ≤ 0.6 kb (Table 4). This important result demonstrates that the position of the invariant point is relatively insensitive to the value of the activities of the phases involved. This result has a number of interconnected implications.
65 First, the insensitivity of the determined P-T conditions to the activity of the phases involved suggests that the choice of ideal activity models for the phases does not lead to gross errors in P-T. Second, it also suggests that the samples we analyzed can be considered to be in equilibrium and that an equilibrium thermodynamic approach to calculating P-T conditions for rocks of this grade is not futile. Third, any reasonable input activities yield a narrow band of temperatures — the narrow range shown on Fig. 12 for the prehnite-actinolite facies. Fourth, the close agreement between the position of the CHEPPAQ and CHEPPDQ invariant points using the activities shown in Table 4 indicates that diopside is part of an equilibrium assemblage in rocks of this kind. Pyroxene should not be dismissed as “relict” or “metastable”. Lastly, although our P-T calculations showed no significant variation in T between grades/facies in this study, this can be ascribed to issues surrounding the use of ideal activity models, albeit ones that take careful account of the iron oxidation state. A more sophisticated approach, using non-ideality, particularly for tremolite and diopside, may yield temperatures that distinguish one grade/facies from another. This is a potentially fruitful avenue for further investigation.
CONCLUSIONS
66 Our work on metamorphism of the Mira terrane has demonstrated that the ca. 680, ca. 620, and ca. 575–560 Ma volcanic and sedimentary rocks all have experienced low pressures and moderate temperatures typical of burial metamorphic environments in volcanic arc settings. The work followed a classical equilibrium thermodynamic approach using detailed mineralogical analysis, and elucidates some important (and heretofore undocumented) features of rocks of this grade. First, very low-grade rocks are amenable to P-T calculations. Second, “relict” phases are relict only in the sense that they owe their ultimate origin to the primary depositional process. We have clearly shown that clinopyroxene, in particular, was an active and well-behaved (in the thermodynamic sense) participant during the metamorphic processes. This role has been suggested before (e.g., Carmichael 2005) but not documented previously to the degree shown here.
Table A1. Bulk rock geochemistry of 17 samples chosen for microprobe analysis. Analyses from Barr et al. (1996) except where noted otherwise (starred samples).

Display large image of Table 6
Table A2. Amphibole analyses for rocks from southeastern Cape Breton Island.
Display large image of Table 7
Table A3. Chlorite analyses for rocks from southeastern Cape Breton Island.

Display large image of Table 8
Table A3. Continued.
Display large image of Table 9
Table A4. Epidote analyses for rocks from southeastern Cape Breton Island.
Display large image of Table 10
Table A4. Continued.
Display large image of Table 11
Table A5. Prehnite analyses for rocks from southeastern Cape Breton Island.
Display large image of Table 12
Table A6. Pumpellyite analyses for rocks from southeastern Cape Breton Island.
Display large image of Table 13
Table A7. Pyroxene analyses for rocks from southeastern Cape Breton Island.
ACKNOWEDGEMENTS
The geological mapping by S.M. Barr and colleagues in southeastern Cape Breton Island during which most of the samples for the present study were collected was funded by the Geological Survey of Canada through the 1984–1989 Canada - Nova Scotia Mineral Development Agreement and the 1990– 1992 Canada — Nova Scotia Cooperation Agreement, as well as by research grants to Sandra M. Barr from the Natural Sciences and Engineering Research Council of Canada. These sources also provided funding for the initial stages of this project. We thank journal reviewers Margaret Thompson and Joanne Potter for their insightful reviews, which helped considerably in clarifying this paper.REFERENCES
Banno, S. 1998. Pumpellyite-actinolite facies of the Sanbagawa metamorphism. Journal of Metamorphic Geology, 16, pp. 117–128. doi:10.1111/j.1525-1314.1998.00071.x
Barr, S.M. 1993. Geochemistry and tectonic setting of late Precambrian volcanic and plutonic rocks in southeastern Cape Breton Island, Nova Scotia. Canadian Journal Earth Science, 30, pp. 1147–1154. doi:10.1139/e93-097
Barr, S.M., and Macdonald, A.S. 1992. Devonian plutons in southeastern Cape Breton Island, Nova Scotia. Atlantic Geology, 28, pp. 101-113.
Barr, S.M., Dunning, G.R., Raeside, R.P., and Jamieson, R.A. 1990. Contrasting U-Pb ages from plutons in the Bras d’Or and Mira terranes of Cape Breton Island, Nova Scotia. Canadian Journal Earth Science, 27, pp. 1200–1208.
Barr, S.M., White, C.E., and Macdonald, A.S. 1996. Stratigraphy, tectonic setting, and geologic history of Late Precambrian volcanic-sedimentary-plutonic belts in southeastern Cape Breton Island, Nova Scotia. Geological Survey of Canada Bulletin 468, 84 p.
Barr. S.M., Raeside, R.P., and White, C.E. 1998. Geological correlations between Cape Breton Island and Newfoundland, northern Appalachian orogen. Canadian Journal Earth Science, 35, pp. 1252–1270. doi:10.1139/cjes-35-11-1252
Beiersdorfer, R.E. 1993. Metamorphism of a Late Jurassic volcano-plutonic arc, northern California, U.S.A. Journal of Metamorphic Geology, 11, pp. 415–427. doi:10.1111/j.1525-1314.1993.tb00158.x
Beiersdorfer, R.E., and Day, H.W. 1995. Mineral paragenesis of pumpellyite in low-grade mafic rocks. In Low-Grade Meta-morphism of Mafic Rocks. Edited by P. Schiffman and H.W. Day. Geological Society of America Special Paper, 296, pp. 5–27.
Berman, R.G. 1988. Internally‑consistent thermodynamic data for stoichiometric minerals in the system Na2O-K2O-CaO-MgO-FeO-Fe2O3-Al2O3-SiO2-TiO2-H2O-CO2. Journal of Petrology, 29, pp. 445–522.
Berman, R.G. 1991. Thermobarometry using multiequilibrium calculations: a new technique with petrologic applications. Canadian Mineralogist, 29, pp. 833–855.
Berman, R.G. 2007. winTWQ (version 2.3): a software package for performing internally-consistent thermobarometric calculations. Geological Survey of Canada, Open File 5462, 41 p.
Bevier, M.L., Barr, S.M., White, C.E., and Macdonald, A.S. 1993. U-Pb geochronologic constraints on the volcanic evolution of the Mira (Avalon) terrane, southeastern Cape Breton Island, Nova Scotia. Canadian Journal of Earth Science, 30, pp. 1–10. doi:10.1139/e93-001
Bevins, R.E., and Robinson, D. 1993. Parageneses of Ordovician sub-greenschist to greenschist facies metabasites from Wales, U.K. European Journal of Mineralogy, 5, pp. 925– 935.
Bradley, D.C., and Bradley, L.M. 1986. Tectonic significance of the Carboniferous Big Pond Basin, Cape Breton Island, Nova Scotia. Canadian Journal of Earth Science, 23, pp. 2000–2011.
Carmichael, D.M. 2005. Metabasite equilibria and the virtual stability of relict igneous clinopyroxene at low metamorphic grade. GAC-MAC-CSPG-CSSS Joint Meeting, Halifax, Nova Scotia, Abstracts Volume 30, pp. 24–25.
Cho, M. 1991. Zeolite to prehnite-pumpellyite facies meta-morphism in the Toa Baja drill hole, Puerto Rico. Geophysical Research Letters, 18, pp. 525–528. doi:10.1029/91GL00409
Cho, M., Liou, J.G., and Maruyama, S. 1986. Transition from the zeolite to prehnite-pumpellyite facies in the Karmutsen metabasites, Vancouver Island, British Columbia. Journal of Petrology, 27, pp. 467–494.
Day, H.W., and Springer, R.K. 2005. The first appearance of actinolite in the prehnite-pumpellyite facies, Sierra Nevada, California. Canadian Mineralogist, 43, pp. 89–104. doi:10.2113/gscanmin.43.1.89
Deer, W.A., Howie, R.A., and Zussman, J. 1986. Rock Forming Minerals. Volume 1B: Disilicates and Ring Silicates – Second Edition. Wiley and Sons, Inc., New York. 629 p.
Deer, W.A., Howie, R.A., and Zussman, J. 1992. An Introduction to the Rock Forming Minerals, Second Edition. Wiley and Sons, Inc., New York. 696 p.
Deer, W.A., Howie, R.A., and Zussman, J. 1997. Rock Forming Minerals. Volume 2A: Single-Chain Silicates – Second Edition. The Geological Society, London, 668 p.
Digel, S.G., and Gordon, T.M. 1995. Phase relations in meta-basites and pressure-temperature conditions at the prehnite-pumpellyite to greenschist facies transition, Flin Flon, Manitoba, Canada. In Low-Grade Metamorphism of Mafic Rocks. Edited by P. Schiffman and H.W. Day. Geological Society of America Special Paper 296, pp. 67–80.
Dollase, W.A. 1973. Mossbauer spectra and iron distribution in epidote-group minerals. Zeitschrift fur Kristallographie, 138, pp. 41–63.
Evans, B.W. 1990. Phase relations of epidote-blueschists. Lithos, 25, pp. 3–23. doi:10.1016/0024-4937(90)90003-J
Fettes, D., and Desmons, J. 2007. Metamorphic rocks. A classification and glossary of terms. Recommendations of the International Union of Geological Sciences Subcommission on the Systematics of Metamorphic Rocks. Cambridge University Press. Cambridge. 244 p.
Frey, M., De Capitani, C., and Liou, J.G. 1991. A new petrogenetic grid for low-grade metabasites. Journal Metamorphic Geology, 9, pp. 497–509. doi:10.1111/j.1525-1314.1991.tb00542.x
Greenwood, H.J. 1975. Thermodynamically valid projections of extensive phase relationships. American Mineralogist, 60, pp. 1–8.
Harte, B., and Graham, C.M. 1975. The graphical analysis of greenschist to amphibolite facies mineral assemblages in metabasites. Journal of Petrology, 16, pp. 347–370.
Hibbard, J.P., van Staal, C.R., Rankin, D., and Williams, H. 2006. Lithotectonic map of the Appalachian orogen (north), Canada-United States of America: Geological Survey of Canada Map 2041A, scale 1:1 500 000, 1 sheet.
Hutchinson, R. D. 1952. The stratigraphy and trilobite faunas of the Cambrian sedimentary rocks of Cape Breton Island, Nova Scotia. Geological Survey of Canada Memoir 263, 124 p.
Kontak, D.J. 1998, Geochemical profile of a carbonate-quartz alteration zone in footwall rocks of the Stirling VMS base metal deposit, Richmond County, Cape Breton Island. In Mineral Resources Branch, Report of Activities 1997, Nova Scotia Department of Natural Resources, Report 1998-1, pp. 25–37.
Kontak, D.J., DeWolfe, J., and Finck, P.W. 2003. The Coxheath plutonic - volcanic belt (NTS 11K/01). A linked porphyryepithermal mineralized system of Precambrian age. In Mineral Resources Branch, Report of Activities 2002, Nova Scotia Department of Natural Resources, Report 2003-1, pp. 69–87.
Kretz, R. 1983. Symbols for rock-forming minerals. American Mineralogist, 68, pp. 277–279.
Leake, B.E., and 21 others 1997. Nomenclature of amphiboles: Report of the subcommittee on amphiboles of the International Mineralogical Association, Commission on New Minerals and Mineral Names. Canadian Mineralogist, 35, pp. 219–246.
Liou, J.G., Kim, H.S., and Maruyama, S. 1983. Prehnite-epi-dote equilibria and their petrologic applications. Journal of Petrology, 24, pp. 321–342.
Liou, J.G., Maruyama, S., and Cho, M. 1985. Phase equilibria and mineral paragenesis of metabasites in low-grade metamorphism. Mineralogical Magazine, 49, pp. 321–333. doi:10.1180/minmag.1985.049.352.03
Liou, J.G., Maruyama, S., and Cho, M. 1987. Very low-grade metamorphism of volcanic and volcaniclastic rocks—mineral assemblages and mineral facies. In Low temperature metamorphism. Edited by M. Frey. Blackie and Son, London, pp. 59–113.
Lynch, G., and Ortega, J. 1997. Hydrothermal alteration and tourmaline-albite equilibria at the Coxheath porphyry Cu-Mo-Au deposit, Nova Scotia. Canadian Mineralogist, 35, pp. 79–94.
Macdonald, A.S. 1989. Metallogenic studies, southeastern Cape Breton Island. Nova Scotia Department of Mines and Energy Paper 89-1, 99 p.
Macdonald, A.S., and Barr, S.M. 1993. Geological setting and depositional environment of the Stirling Group of southeastern Cape Breton Island, Nova Scotia. Atlantic Geology, 29, pp. 137–147.
McMullin, D.W.A. 1984. Geology and Geochemistry of the Granitoid rocks of the Loch Lomond - Irish Cover Area, Cape Breton Island. Unpublished M.Sc. thesis. Acadia University, Wolfville, Nova Scotia, Canada, 239 p.
Miyazaki, K., and Okumura, K. 2002. Thermal modeling in shallow subduction: an application to low P/T metamorphism of the Cretaceous Shimanto Accretionary Complex, Japan. Journal of Metamorphic Geology, 20, pp. 441–452. doi:10.1046/j.1525-1314.2002.00380.x
Potter, J., Longstaffe, F.J., and Barr, S.M. 2008a. Regional 18O-depletion in Neoproterozoic igneous rocks of Avalonia, Cape Breton Island and southern New Brunswick, Canada. Geological Society of America Bulletin, 120, pp. 347–367. doi:10.1130/B26191.1
Potter, J., Longstaffe, F.J., Barr, S.M., Thompson, M.D., and White, C.E. 2008b. Altering Avalonia: oxygen isotopes and terrane distinction. Canadian Journal of Earth Sciences, 45, pp. 815–825. doi:10.1139/E08-024
Powell, W.G., Carmichael, D.M., and Hodgson, C.J. 1993. Thermobarometry in a subgreenschist transition in meta-basites of the Abitibi greenstone belt, Superior Province, Canada. Journal of Metamorphic Geology, 11, pp. 165–178. doi:10.1111/j.1525-1314.1993.tb00138.x
Robinson, D., and Bevins, R.E. 1999. Patterns of regional low-grade metamorphism in metabasites. In Low-Grade Meta-morphism. Edited by Martin Frey and Doug Robinson, Blackwell Science, London, pp. 143–168.
Robinson, D., and Merriman, R.J. 1999. Low-temperature metamorphism: an overview. In Low-Grade Metamorphism. Edited by Martin Frey and Douglas Robinson, Blackwell Science, London, pp. 1–9.
Schiffman, P., and Day, H.W. 1999. Petrological methods for the study of very low-grade metabasites. In Low-Grade Metamorphism. Edited by Martin Frey and Doug Robinson, Blackwell Science, London, pp. 108–142.
Sexton, A. 1988. Geology of the Sporting Mountain area, southeastern Cape Breton Island, Nova Scotia. Unpublished M.Sc. thesis. Acadia University, Wolfville, Nova Scotia, Canada, 215 p.
Smulikowski, W., Desmons, J. Fettes, D., Harte, B. Sassi, F., and Schmid, R. 2007. Types, grades, and facies of metapmorphism. In Metamorphic Rocks. A Classification and Glossary of Terms. Edited by D. Fettes and J. Desmons. Cambridge University Press, Cambridge, pp. 16–23.
Sparkes, G.W., O’Brien, S.J., Dunning, G.R., and Dubé, B. 2005. U-Pb geochronological constraints on the timing of magmatism, epithermal alteration and low sulphidation gold mineralization, eastern Avalon zone, Newfoundland. Current Research (2005), Newfoundland Labrador Department of Natural Resources, Geological Report 05-1, pp. 115–130.
Springer, R.K., Day, H.W., and Beiersdorfer, R.E. 1992: Prehnite-pumpellyite to greenschist facies transition, Smartville Complex, near Auburn, California. Journal of Metamorphic Geology, 10, pp. 147–170. doi:10.1111/j.1525-1314.1992.tb00076.x
Terebayashi, M. 1988. Actinolite-forming reaction at low pressure and the role of Fe2+-Mg substitution. Contributions to Mineralogy and Petrology, 100, pp. 268–280. doi:10.1007/BF00379738
Thicke, M.J. 1987. Geology of Late Hadrynian metavolcanic and granitoid rocks of the Coxheath Hills. Unpublished M.Sc. thesis. Acadia University, Wolfville, Nova Scotia, Canada, 300 p.
Thompson, J.B., Jr. 1957. The graphical analysis of mineral assemblages in pelitic schists. American Mineralogist. 42, pp. 842–858.
Weeks, F.J. 1954. Southeast Cape Breton Island, Nova Scotia. Geological Survey of Canada Memoir 277, 112 p.
White, C.E., Barr, S.M., and Ketchum, J.W.F. 2003. New age controls on rock units in pre-Carboniferous basement blocks in southwestern Cape Breton Island and adjacent mainland Nova Scotia. In Nova Scotia Department of Natural Resources, Minerals and Energy Branch, Report of Activities 2002, Edited by D.R. MacDonald. Report ME 2003-1, pp. 163–178.
Williams, H. 1979. The Appalachian Orogen in Canada. Canadian Journal of Earth Science, 16, pp. 792–807. doi:10.1139/e79-070
Editorial responsibility: Simon K. Haslett