Articles
A model of horse mussel reef formation in the Bay of Fundy based on population growth and geological processes
David J. WildishFisheries and Oceans Canada, Biological Station, 531 Brandy Cove Road, St. Andrews, New Brunswick E5B 2L9, Canada †Present address: Northern Harrier Science, 3595 Route 127, Bayside, New Brunswick E5B 2S9, Canada
<wildish@nb.sympatico.ca>
Gordon B.J. Fader
Atlantic Marine Geological Consulting Ltd., 2901 Parkdale Ave., Halifax, Nova Scotia B3L3Z2, Canada
D. Russell Parrott
Geological Survey of Canada (Atlantic), Natural Resources Canada, Bedford Institute of Oceanography, Box 1006, Dartmouth, Nova Scotia B2Y 4A2, Canada
Date received: 27 March 2009 ¶ Date accepted: 02 November 2009 ¶ Date Digitally Published: December 3 2009 doi:104138/atlgeol.2009.007
ABSTRACT
From a total of 14 geological sediment provinces recognized in the Bay of Fundy only five: sand with bioherms, gravel/cobble, gravel /scallop bed, mottled gravel and glacio-marine mud were found to have significant populations of the horse mussel, Modiolus modiolus. Valve increment measures of annual growth rings in the early years of life of populations of these Bay of Fundy horse mussels, suggest that growth rates vary with the geological province where they are found. Horse mussel populations grow fastest on sand with bioherms, closely followed by those growing on gravel/scallop bed; the slowest growing are found on gravel/ cobble and mottled gravel geological provinces.Multibeam bathymetry and backscatter data have been collected in an area of mussel reefs in the central part of the Bay of Fundy. The data indicates that the mussel reefs (bioherms) tend to occur on the eastern side of small, gravel covered, glacial ridges on the seabed and form a variety of single and multiple, long and short reefs that rise above the seabed up to 3 m high. They are always associated with sand in transport at the seabed in a variety of bedforms. A conceptual model of formation and location is presented that considers: current velocity and turbulence, well-mixed water masses, seabed morphology, sediment distribution and sediment transport, as causative factors.
RÉSUMÉ
D’un total de 14 classes de sédiments géologiques reconnues dans la baie de Fundy, seulement cinq (biohermes, gravier/galets, gravier/fond de pétoncle, gravier tacheté et boue glacio-marine) renfermaient des populations importantes de modiole Modiolus modiolus. Les mesures de l’augmentation valvaire des cernes d’accroissement annuels durant les premières années de vie des populations de modioles dans la baie de Fundy indiqueraient que les taux de croissance varient selon la classe de sédiment géologique où ils se trouvent. Les populations de modioles croissent plus rapidement dans le sable renfermant des biohermes, et la croissance est presque aussi grande chez les modioles présents dans les classes de sédiments composées de gravier/fond de pétoncles; la croissance la plus lente a été observée dans les classes de sédiments géologiques composées de gravier/galets et de gravier tacheté.Des données ont été recueillies au moyen de la bathymétrie par secteurs et de la rétrodiffusion dans une zone de récifs de moules de la partie centrale de la baie de Fundy. Les données indiquent que les récifs de moules (biohermes) semblent se former sur le côté est de petites crêtes glaciaires recouvertes de gravier sur le plancher sous‑marin, et qu’ils forment divers récifs uniques et multiples, longs et courts, qui s’élèvent sur le plancher sous-marin jusqu’à une hauteur de trois mètres. Ils sont toujours associés avec le sable déplacé sur le plancher sous-marin dans diverses morphologies de fond. On présente un modèle conceptuel de la formation et de l’emplacement qui considère comme facteurs de causalité les éléments suivants : la vitesse et la turbulence actuelles, les masses d’eau homogènes, la morphologie du plancher sous-marin, la répartition des sédiments et les transports sédimentaires. [Traduit par la redaction]
INTRODUCTION
1 We describe the surficial geology occurring in the mid to upper Bay of Fundy based on interpretation of side-scan sonograms, seismic reflection profiles, and multibeam bathymetry. In a preliminary earlier publication (Wildish and Fader 1998), we described five of the fourteen geological provinces recognized in the region through the interpretation of sidescan sonograms, seismic reflection data, and sample information (Wildish et al. 1998a).
2 Multibeam bathymetry data was collected in 1999, processed for morphology (Fig. 1) and backscatter (Fig. 2) over the horse mussel reef region, and has provided a more detailed understanding of seabed morphology, bedform development, sediment distribution, and insights regarding sediment transport.
3 A notable feature of the upper Bay of Fundy is the presence of unique long and narrow, flow parallel raised reefs formed by horse mussels (Wildish et al. 1998b). We prefer to use the term bioherm to describe these features as they are considered to be composed of trapped sediments and both living and dead bivalves, while others (Paull et al. 2000,) have used the term lithotherm for structures resulting from corals. During field studies, horse mussel populations were identified as present in five of the geological provinces. Our purpose was to test the null hypothesis that population growth rates of horse mussels was the same irrespective of their geological province of origin, and secondly to assess individual reef morphology, shape distribution, symmetry, relative age, erosion and provide a conceptual model for the process of reef formation and evolution.
Fig.1. A multibeam bathymetric map of the horse mussel study area from the central Bay of Fundy where they were first discovered. The image is coloured-coded to represent water depth and artificially shaded to enhance relief. Depth is coded from 45 to 90 metres as shown in the attached colour bar. A 5.0 km grid has been overlain on the image for scale. This multibeam bathymetric map is intended to show details of the regional morphology and not individual characteristics of the mussel reefs that occur in the upper area of the image.

Display large image of Figure 1

Display large image of Figure 2
Display large image of Figure 3
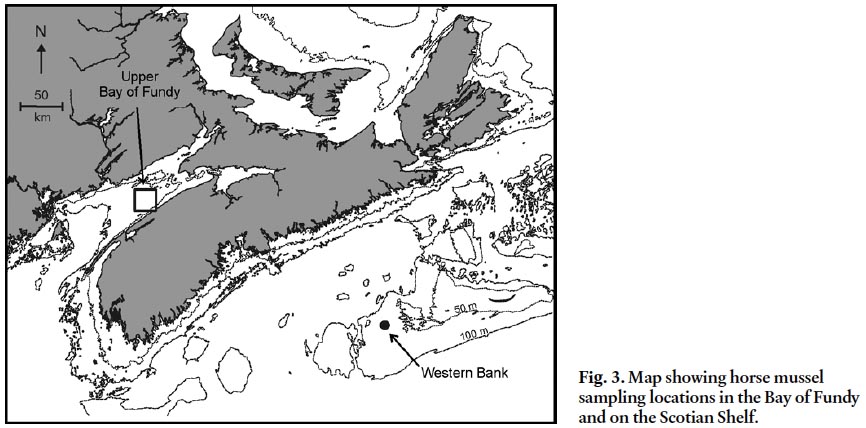
4 The horse mussel, Modiolus modiolus (Linnaeus 1857), is circum-boreally distributed in the northern hemisphere occurring intertidally to depths greater than 200 m (Jasmin and Brand 1989). It is usually a sublittoral species of polyhaline or euryhaline conditions, and is considered to be of little direct economic importance to man (Comely 1978), although in Norway, horse mussel meats have been used as bait for commercial long lining of cod (Wiborg 1946). Horse mussels in the Bay of Fundy (Fig.3) have been deduced to be a key ecosystem engineer species involved in pelagic-benthic coupling (Wildish and Fader 1998). This follows the initial finding by Dame et al. (1980) that bivalve reefs are ecologically important in recycling plant nutrients as excretory products after ingesting phytoplanktonic food.
METHODS
Field sampling of mussels
5 Two field sampling missions in the Bay of Fundy were undertaken from the CCGS Hudson on 17 to 22 June 1997 and CCGS J.L.Hart on 11 to 22 May 1998 (Fig. 3) Sampling from the Hudson was with a 0.5 m2 video grab (Schwinghammer et al. 1996) and collected 20 grab samples. The Hart mission used a 0.5m2 Van Veen grab, which did not have an acoustic positioning device on the grab, as did the video grab, which also provided a live video image during sampling. The video images were used to position the grab to sample on the bioherm. Forty-nine samples were obtained with the Van Veen grab. The 69 samples contained from one quarter to one-half of the full grab contents. The grab contents were passed through a 5 mm2 mesh sieve and only the mussels retained. A total of 673 individuals of Modiolus modiolus were collected during both missions. Each mussel was cleaned of epibiota, and opened with a knife so the soft tissue could be removed, stored in a plastic bag, and frozen at -20 °C. Both right and left valves, stored dry and soft tissue samples of each mussel, were given a unique identifying number, which also indicated the grab sample and thus position and geological province of origin.
6 Some 128 individuals of Modiolus modiolus, preserved in dilute formalin, were also available from the CCGS Alfred Needler mission of 27 September to 1 October 1997 (Fig.3). These mussels were obtained in an Engel 145 otter trawl during a field experiment to assess effects of trawling on benthos on Western Bank, Scotian Shelf (Kenchington et al. 2006).
7 For the 801 horse mussels examined from the Bay of Fundy and the Scotian Shelf during this study, the following biometric characters were measured on each mussel:
- soft tissue dry mass to the nearest 0.001g after drying at 85 °C for 48 hours.
- dry valve mass, to the nearest 0.01g, for cleaned right and left valves (separately) after drying in laboratory air to constant weight.
- left valve length, to the nearest 0.01mm.
- valve height, maximum of both valves to the nearest 0.01mm.
- valve width, maximum of both valves to the nearest 0.01mm.
The valve length represents the valve growth made in the first summer after settlement and during the first winter. Subsequent mean annual growth is shown as L2, L3, and L4.
8 Further details of sampling and biometric methods are available in Wildish et al. (1998a). Most of the valves examined are archived at Atlantic Reference Centre, Huntsman Marine Science Centre, Lower Campus Road, St. Andrews, New Brunswick, E5B 2L7, Canada.
Measuring growth and condition factor
9 Dried valves, both right and left, were viewed in good lighting conditions. Backlighting through the valve, viewed from the inner surface, often showed the denser rings observed by Anwar et al (1990) in radial sections of the valve and this was helpful in determining the measuring origins on the outer surface. The dense rings were laid down in winter and the summer ones were the diffuse, often purple space between them. Each pair of valves was checked to see whether the first four growth rings could be unambiguously recognized and those not meeting this criterion excluded from the analysis. Consequently, the first four major growth ring increments, for a range of valve sizes (and hence ages) in each population, were used to determine horse mussel growth rates. Measurements were made with electronic callipers to 0.01 mm. Straight-line distances between the major growth lines at the widest point were measured, with no allowance for the slight valve curvature. We presumed that major external growth rings were annual as confirmed in mark-recapture field growth experiments of Wiborg (1946) and Rowell (1967).
10 The static physiological condition factor, CF, recommended by Lucas and Beninger (1985) was calculated as:CF = (W/V)*100
where W is tissue dry mass in g and V is total dry mass of right and left valve in g.
11 Statistical tests employed were repeated measures to test the difference between valve length means for different populations at P = 0.05. Multiple t tests of valve length between habitats were used to determine whether mean valve lengths were the same (null hypothesis) or different (alternate hypothesis).
Geological interpretation of seabed morphology and sediments
12 Seabed geological provinces were first described by analysing only sidescan sonograms and high resolution seismic reflection profiles collected during reconnaissance surveys from the mid to upper Bay of Fundy (Wildish and Fader 1998). From 14 geological provinces identified in the Bay in this way (Wildish et al. 1998a) only five: sand with bioherms, gravel/cobble, gravel/scallop bed, mottled gravel, and glaciomarine mud were found to have significant populations of the horse mussel, Modiolus modiolus.
13 Since these first preliminary marine geological surveys using sidescan sonar systems and seismic reflection profilers, multibeam bathymetry has been collected in the mussel reef area in the central part of the Bay of Fundy with a Simrad EM 1002 mapping system. This data has been reprocessed to remove unwanted ship motions and for extracting backscatter information (proxy for sediment type) by John Hughes Clarke at the University of New Brunswick. It has produced the basis for a high-resolution understanding of the distribution of the horse mussel reefs and their relationship to the morphology, sediments and sediment transport at the seabed. The earlier studies and information on the characteristics of the mussel reefs was determined from survey control that was separated by a much wider spacing. The newer multibeam bathymetry and backscatter information have provided fresh insights into the relationships between seabed morphological features and sediment type that could not be interpreted from the sidescan sonar data alone.
14 The sidescan sonograms initially used in defining the 14 preliminary sedimentary provinces of the Bay of Fundy (Wildish et al. 1998a) are available from the Geological Survey of Canada (Atlantic). We have reassessed the distribution of the mussel reefs relative to subtle aspects of seabed morphology, sediment type and bedforms based on more recent multibeam bathymetry (Fig. 1) and backscatter data (Fig. 2).
15 Multibeam bathymetric data was collected on a survey of the CCGS Creed in 1999 from surveys in site-specific areas throughout the Bay of Fundy. Geological issues addressed included sea level history, glacial history and archaeological features. The survey of the mussel reefs was conducted in the central part of the Bay where they had been first discovered and previously interpreted based on sidescan sonar data. A comparison of the multibeam bathymetry (Fig. 1) with the backscatter information (Fig. 2) provides considerable insight into understanding the morphology of the seabed, its relationship to sediment type and sediment transport, as well as the relationship to the mussel reefs.
RESULTS
Valve increment at age
16 Horse mussel sampling results are summarized in Table 1. Sampling depth was 48–91 m with individual grab samples reaching a density of 160 mussels per m2. The reproducibility of repeated measures of horse mussel valve lengths was tested in a grab sample from each of the geological provinces (Table 2). Data were normally distributed and the repeated measures test between the first and second series of valve measurements at L4 suggested that in all four cases there was no significant difference between the means. Hence, we accept the null hypothesis that independently measured valve lengths from the same sample of valves give the same result. There were small differences between the first and second series in the number of valves (N in Table 2) which were considered readable. In the 97-03 sample the initial measurements were made on the right valves only and the final measurement was on the left valves only, with no significant difference in the result.
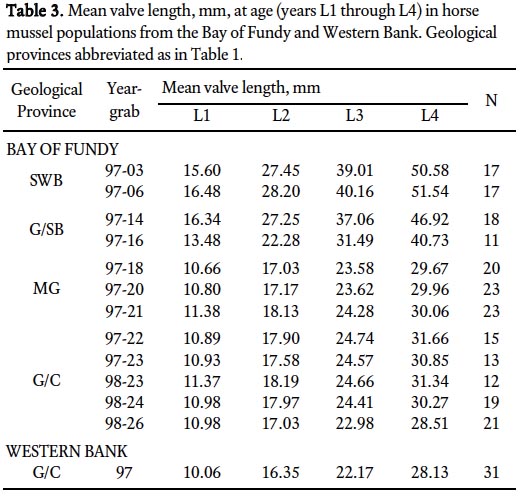
17 Valve length growth rates (Table 3) show that horse mussel populations from sand with bioherm and gravel/scallop bed geological provinces grow faster during the first 4 years of life. Growth rate in the first year is greater for horse mussels from gravel/scallop beds and mottled gravel and least for one population (98-23, Table 3) on gravel/cobble. The Western Bank data suggests that it follows the Bay of Fundy gravel/cobble pattern.
Condition factor
18 Whereas valve increments measure the long term growth environment, condition indices measure short term responses to the trophic environment. Individual population condition indices (Table 4) suggest that the main effect was a significant difference between sampling years. Comparing mottled gravel populations from 1997 (mean CF = 11.56, S.D. = 2.67, N = 208) with mottled gravel and gravel/cobble populations from1998 (mean CF = 7.71. S.D. = 1.95, N = 189) t = 16.52, d.f. = 378 and P = 0.000, supports the view that condition factor was significantly higher in 1997. This effect could be linked to the earlier sampling in 1998 (17–22 June,1997 versus 11–15 May,1998), because the 1998 mussels had yet to experience the boost to feeding/growth provided by the spring phytoplankton bloom in this part of the Bay of Fundy.
Multibeam bathymetric interpretation
19 The multibeam bathymetric map (Fig. 1) is sun-illuminated to enhance relief and shows a deeper region in the upper left of the image and several broad ridges in the southern and eastern areas. The southern linearity is parallel to the orientation of the Bay of Fundy (southwest to northeast). The backscatter for this region is dark-toned indicating that the seabed is largely gravel covered. These broad ridges are interpreted to represent large-scale fluting of till on the seabed that resulted from fast moving glacial ice streams that moved down the Bay during the late Wisconsinian glacial period. It produced an overlapping pattern of U-shaped till ridges that are open to the northeast and are widespread over the region. Several other broad ridges trend normal to this southwest-northeast pattern. These ridges are smoother than the southern set of ridges and the backscatter shows that they are partially covered with sand (light tone).
Table 1. Geological Provinces in the Bay of Fundy as interpreted by G.B.J. Fader based on sidescan sonograms and as listed in Wildish et al . (1998a). Total numbers and density of Modiolus modiolus collected in 1997 and 1998. Note: zeros are excluded in calculating the mean density.

Display large image of Table 1
Table 2. Repeated measures of horse mussel valve lengths. The null hypothesis (H0) is that the first and second means are equal. ND = not significantly different at P = 0.05. Geological provinces abbreviated as in Table 1.

Display large image of Table 2
Table 3. Mean valve length, mm, at age (years L1 through L4) in horse mussel populations from the Bay of Fundy and Western Bank. Geological provinces abbreviated as in Table 1.
Display large image of Table 3
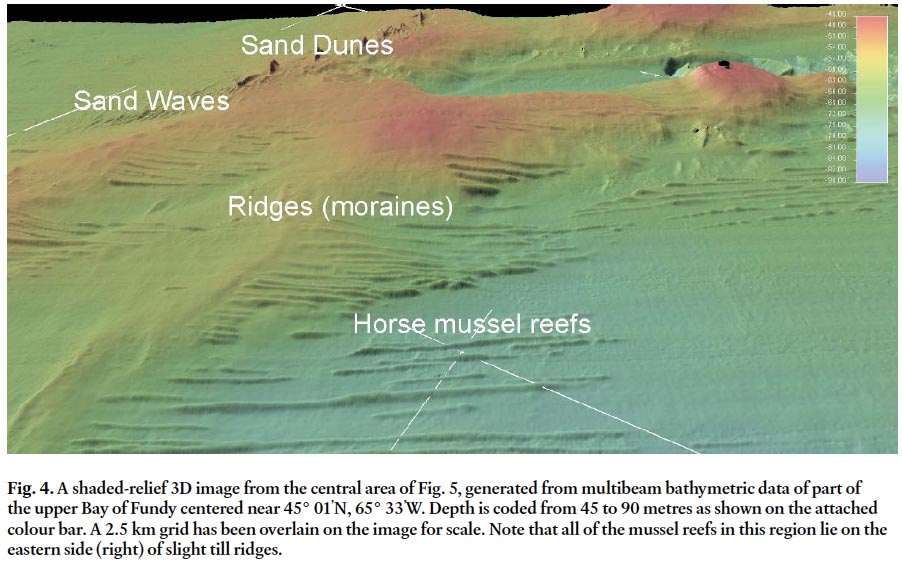
Display large image of Figure 4
20 The backscatter map (Fig. 2) shows that the deeper western region of Fig. 1 is dominated by sand (light tone). Other areas in slightly deeper depths between the ridges are sand covered. The sand does not appear as a continuous sheet but is formed into alternating patterns of light and dark tone indicating that the sand is formed as bedforms, mostly megaripples. The mussel reefs are found in areas dominated by sand as seen on the backscatter map (Fig. 2). An exception to this occurs in the southern region where the reefs appear to occur on gravel. However, these reefs are less distinct with less height and no sharp edges. The significance of this will be discussed later.
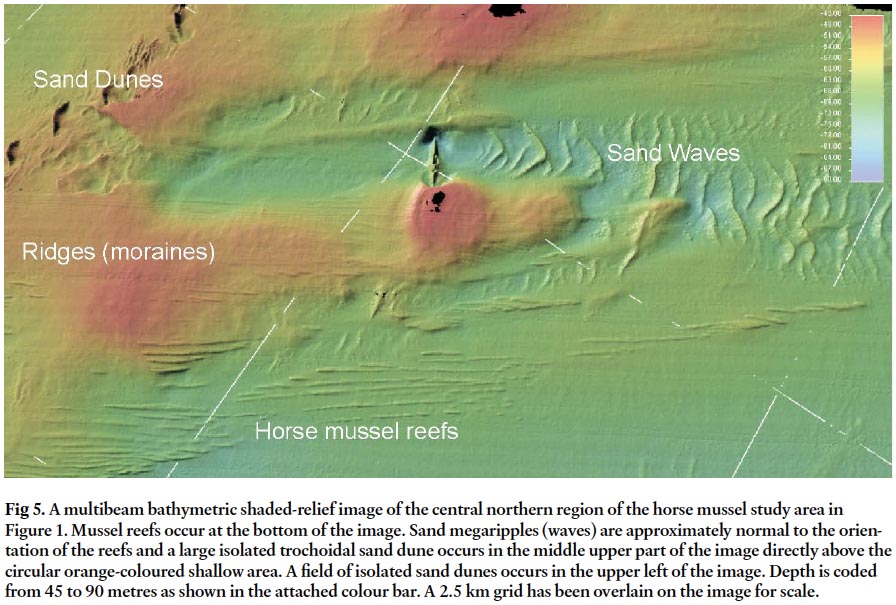
21 A few isolated trochoidal (symmetrical) sharp-crested sand-waves are oriented normal to the mussel reefs (Figs 4, 5). This is a slightly different orientation than the adjacent smaller sand waves that are aligned at an angle of approximately 20 degrees to the reefs. Farther up the Bay of Fundy to the north east in an area known as the Margaretsville Dunefield a large field of similar trochoidal sandwaves has been identified (Fader 1996). They are interpreted to occur in a region of strong currents, sand transport, and sand ribbons. Spill over sand deposits on the eastern flank evidenced by large sandwaves indicate that the strongest currents occur on the flood and that net bed-load sand transport is to the east up the bay. It is important to note that only a few horse mussel reefs have been found in the Margaretsville Dunefield area suggesting that the currents, as evidenced by the sand waves and seabed scour around large bedforms, may be too strong and a limiting factor.
Table 4. Mean condition factor for horse mussels taken by grab samples in different geological provinces in the Bay of Fundy. Geological provinces abbreviated as in Table 1.
Fig 5. A multibeam bathymetric shaded-relief image of the central northern region of the horse mussel study area in Figure 1. Mussel reefs occur at the bottom of the image. Sand megaripples (waves) are approximately normal to the orientation of the reefs and a large isolated trochoidal sand dune occurs in the middle upper part of the image directly above the circular orange-coloured shallow area. A field of isolated sand dunes occurs in the upper left of the image. Depth is coded from 45 to 90 metres as shown in the attached colour bar. A 2.5 km grid has been overlain on the image for scale.
Mussel reefs (SWB)
22 The mussel reefs appear on the multibeam bathymetric and backscatter maps as a field of raised linear, continuous to discontinuous narrow ridges on the seabed (Fig. 1, 4, and 5). Individual reefs range from single and very long features to short and discontinuous ones. The longest can represent one distinct reef that is uniform in height and width along its length. Other long reefs are composite and appear to consist of multiple linear ridges slightly offset to one another and at a slight angle to make the composite ridges slightly subparallel. Overall, the mussel reefs appear as if they are superimposed on the regional seabed and are independent of the dominant glacial, morphological features. The mussel reefs have a direct relationship to seabed morphology in that they are largely confined to slightly deeper water and lie to the east of the north – south and southwest – northeast trending ridges of the seabed. The one exception in the right central part of the image (Fig. 4) shows that the reef crosses one of the major ridges, however, it narrows on the crest of the ridge.
Reef shape and relationship to bedforms and sediment
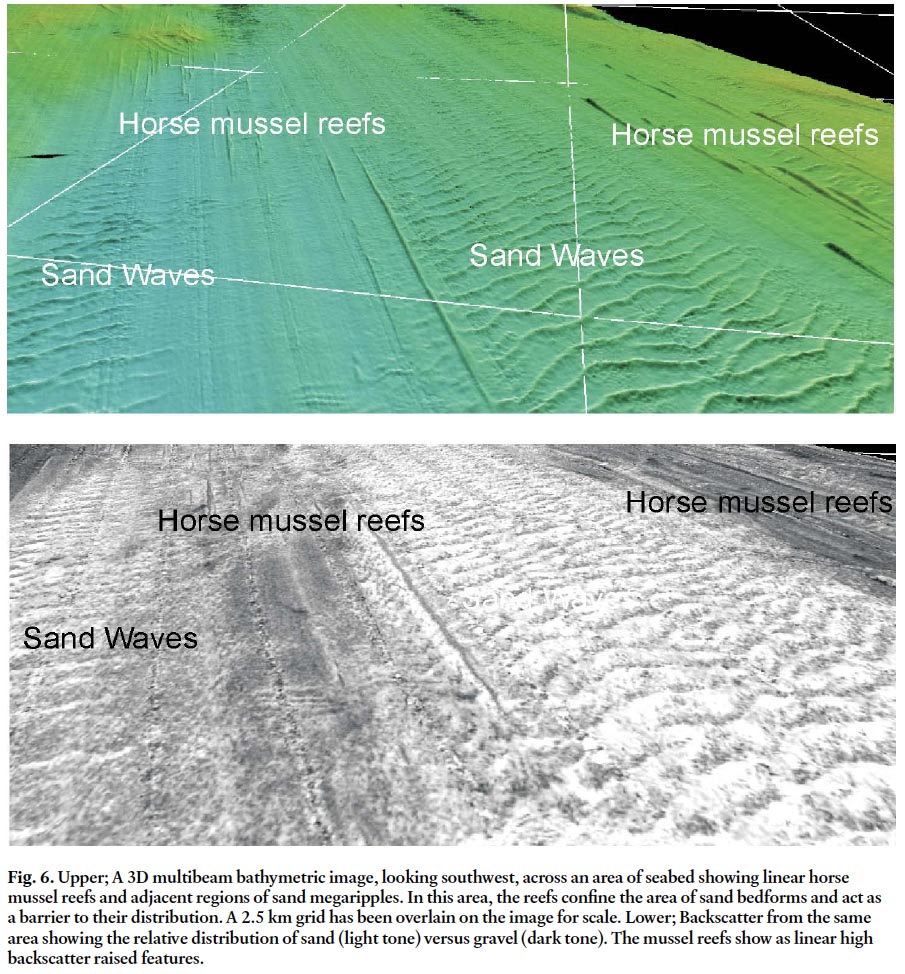
23 The general grain of the morphology of the seabed is southwest – northeast (glacial morainal grain) and the mussel reefs show a direct relationship to this orientation and morphology as they are generally confined to the east side of the ridges. The reefs also show an intimate relationship with both the sand and the bedforms in the sand. The reefs that lie on a dominantly gravel bottom appear muted without sharp edges and are lower in height as compared to those in the region of sand. This variance suggests that the proximity of sand in transport may be an essential control on the formation of the reefs. The morphology of the reefs in turn controls the distribution of the sand (Fig. 6). The bedforms in many areas butt up against the reefs and this indicates that the reefs are formed first and exert a control on sediment transport pathways and bedform genesis.
DISCUSSION
Horse mussel population growth varies with geological habitat
24 Differences in horse mussel population growth were found to be linked to the habitat in which they occurred, although how the geological provinces differ from one another in environmental characteristics is not well understood. We combined population L4 valve growth data for each habitat and compared pairs of them as shown in Table 5. The null hypothesis tested was that there was no difference in the mean valve lengths for each habitat. For the Bay of Fundy valve growth rates are SWB > G/SB > GC = MG. These growth results, which reflect long-term growth trends, are consistent with similar measurements made by Rowell (1967). Both sets of results suggest that the long-term growth of horse mussels is tightly linked to the geological setting of the mussel reef. The condition factor differences, which reflect shorter-term differences in phytoplankton availability, are probably artefacts of the sampling time differences we employed in 1997 and 1998.
25 Because our valve length growth measures are known to be subject to errors we provide a full discussion here. A first step in determining the growth of natural, discrete populations of bivalves is to determine the age of individuals from a sample. This is required because small size may be due to slow growth or that animals may be at an earlier stage of ontogeny than the population with which they are being compared. Four general methods for determining the age of individual bivalves are available, based on past growth or growth marks left in the valve, as follows:
- Counting all major external growth rings on the surface of the valve
- Accumulated growth increment measures of each external, annual growth ring
- Counting or growth increment analysis based on internal growth rings from radially cut sections of the valve
- Stable isotope analysis of small sub-samples from the presumed growth lines along the valve.
26 The two first methods are the oldest and require the minimum preparation time (just cleaning and drying valves), but suffer from a number of known problems which can distort back-ageing. These include: shell dissolution (Lutz and Clark 1984), “false” annual rings (Peterson and Ambrose 1985), the crowding of growth lines in older individuals (Anwar et al. 1990) and valve distortions due to growth anomalies and parasitism (Rowell 1967). Method 3 involves radial cutting of each valve and polishing or making acetate peels for light microscopy. Jones et al. (1978) introduced it as an improvement on methods 1 and 2, because the annual growth bands could be seen more clearly. It suffers from most of the same problems as the earlier methods. Method 4 uses the seasonal changes of 18O/16O established for seawater in general by Epstein et al. (1953). Incorporation of the seasonal pattern of oxygen isotope distribution as the valve is deposited indicates the seasonal temperature changes, from small valve sub-samples collected throughout an individual valve. Although this is the clearly superior method it has been relatively little used and often only as an independent validation of major rings being annual, on a limited number of individuals (e.g., Krantz et al. 1984). The reason for limited use is that only a few individual bivalves can practically be analyzed by this method, and the need for a mass spectrometer and chemical expertise to operate it. All methods require independent validation that growth lines are annual and often authors rely on previously published mark-recapture experiments and stable isotope analysis results for this (Peterson and Ambrose 1985).
Fig. 6. Upper; A 3D multibeam bathymetric image, looking southwest, across an area of seabed showing linear horse mussel reefs and adjacent regions of sand megaripples. In this area, the reefs confine the area of sand bedforms and act as a barrier to their distribution. A 2.5 km grid has been overlain on the image for scale. Lower; Backscatter from the same area showing the relative distribution of sand (light tone) versus gravel (dark tone). The mussel reefs show as linear high backscatter raised features.
Display large image of Figure 6
27 Modiolus modiolus growth by back-ageing was determined in previous studies by methods 1 and 2 by Wiborg (1946), Rowell (1967), Comely (1978), and Seed and Brown (1978). Anwar et al. (1990) used internal growth lines from the middle of the nacreous layer (Method 3) combined with von Bertalanffy growth model predictions to determine the asymptotic maximum attainable valve lengths. As far as we are aware there has been no conformation by stable isotope analysis (Method 4) that growth lines are periodic and that a major line indicates an annual ring in horse mussels. The earlier studies of growth in horse mussels by Wiborg (1946), Rowell (1967) included mark-recapture experiments that established that one major growth ring was annually deposited, following a winter of slow growth. Seed and Brown (1978) conducted caged mussel growth experiments of less than a year, which suggested valve growth increments less than predicted by Method 1. We found that the first 4 to 6 annual growth rings could be unambiguously detected in some individual mussels. Crowding of annual growth lines in many older mussels as well as variously misshapen valves, caused non-reproducible estimates of age by Method 1 (Wildish et al. 1998a). Consequently this method was discarded and all estimates of growth at age are based on valve growth increments (Method 2) for the first four years of growth in individual valves, where annual growth lines were clear, in agreement with the findings of Rowell (1967). We did not extrapolate these measures to obtain growth curves for a defined cohort by growth modelling, because we did not know the exact year class of each mussel used in the analysis. Our growth increments are thus the average of mussels of many, unknown age groups.
Table 5. Comparing habitat valve lengths at L4 in populations of horse mussels from the Bay of Fundy and Western Bank. The null hypothesis (H0) is that the mean of combined habitat valve lengths are equal. ND = not different from H0 and * = accept the alternative hypothesis (H1) at P = 0.05. Geological provinces abbreviated as in Table 1.
Causes of habitat-specific differences in horse mussel population growth
28 A suite of ecological factors, both physical and biological, affect aggregated distributions of mussels (Bertness and Grosholz 1985; Seed and Suchanek 1992). Limiting factors include suitable substrates for attachment, salinity, temperature, water movement, seston concentration and quality, and biotic factors such as competition, predation, parasitism, and disease. Besides such extrinsic factors, horse mussels have characteristic intrinsic responses with a probable genetic basis. We considered it unlikely that genetic differences caused habitat-related growth differences in horse mussels, because the slower and faster growing populations occur contiguously. Horse mussels are externally fertilized, so cross breeding should be the rule, making it difficult to obtain distinct local genetic strains of horse mussels.
29 As a preliminary approach to determining what we believe to be an extrinsic cause of the observed habitat differences we examined the effect of velocity, U, in limiting filtration/feeding in horse mussels. For blue mussels, Mytilus edulis, it was established that at a current velocity of U = 35 cm s-1 filtration/feeding rates are reduced to < 20% of that occurring at lower velocities (Wildish and Miyares 1990; Newell et al. 2001). Similar data for horse mussels is unavailable, although it is likely that this species is adapted to higher flows, as it is found in more energetic flow habitats than the blue mussel. Preliminary filtration experiments in a laboratory flume (D.J.Wildish, unpublished data) suggest that limiting flows are > 55 cm s-1, beyond which filtration/feeding is reduced to < 20%. We have used this limiting value in the simulation of field conditions for filtration/feeding described below.
Fig. 7. The solid line predicts depth-averaged tidal flow in cm.s-1 for one location (MG 97-20) at 44° 56.6200’N, 65° 33.7622’W in the upper Bay of Fundy, from Greenberg et al (2005). The dashed line predicts velocity at 6 cm above the sediment-water interface by equation below. The horizontal line suggests the limiting flow for horse mussels at 55 cm s-1.

Display large image of Figure 7
30 In the natural environment tidal velocity is variable with time, having a maximum tidal flow, Umax, of ~105 cm s-1 at one site (SWB97-03) in the Bay of Fundy, based on the finite element model of Greenberg et al. (2005). It was assumed that velocities would be higher on gravel/cobble and mottled gravel than on sand with bioherms. Consideration of data for a mottled gravel location, MG97-20 (Fig. 7), gives Umax = 112 cm s1 showing that the higher velocity assumption was only marginally valid. In comparing the predicted bulk velocities of Fig.7 with the ones actually experienced by the horse mussel inhal ant siphon within the benthic boundary layer, it is necessary to convert the bulk flow, depth integrated averages to that at 6 cm above the sediment –water interface by the method described in Wildish and Kristmanson (1993). Because of printers errors in this reference we give the equation used in full below:U6 = u*/ κ ln (Z6/Z0)
where U6 is the velocity at a specified height of 6 cm above the substrate in cm s-1; u* is shear velocity; κ is the von Karmans constant (= 0.4); Z6 is the height in cm above the bottom, and Z0 is the roughness length in cm of the mussel.
31 Tidal flows in the upper part of the Bay of Fundy, where the mussels were found, would prove to be growth limiting at SWB97-03 for 2 h 52 min. in every 12.4 h, and where Umax = 70 cm s-1. Similar data for MG97-20 are Umax = 75 cm s-1 and 3 h 26 min. in every 12.4 h. We conclude that the small differences in time when feeding was severely limited by flows does not support the observed large growth differences observed. Even if the limiting flow was much less than that shown in Fig.7 the differences between SWB and MG would be too small to account for the large differences in growth rate. In a few places in the Bay, e.g., Cape Split, where tidal forcing due to the narrow tidal channel produces velocities up to ~400 cm s-1, there will be velocity limitation of feeding in horse mussels. We conclude that velocity inhibition of filtration/feeding and consequent effects on growth is not a major limiting factor causing habitat-related Bay of Fundy horse mussel growth differences. Horse mussels appear to be well adapted to the energetic tides in most parts of the Bay of Fundy.
32 Another important limiting factor for horse mussels living on sand with bioherm habitats is the availability of a stable substrate for larval attachment. Once established on megarippled sands, mussels settle gregariously as do blue mussels (McGrath et al. 1988). The extensive byssus threads and dead mussel valves with persistent byssus, build and stabilize the up to 3 m high structures recognized as bioherms or mussel reefs (Wildish et al. 1998b). A firm substrate for larval attachment is readily available on gravel/cobble and mottled gravel, in these geological provinces the area occupied, and density of mussels is higher (Table 1). Therefore, it is hypothesized that the poorer growth of mussels on gravel/cobble and mottled gravel substrates is due to a more frequent occurrence of seston depletion effects (Wildish and Kristmanson, 1997). Such effects will be less common on the narrow, strip-like bioherms, where mussel densities are lower, and because the normal slight variations in tidal current direction reduce the possibility of downstream seston depletion.
Model of reef formation
33 The information provided by multibeam bathymetry and backscatter data provides a basis for the development of a conceptual model for horse mussel reef formation. Although the multibeam information does not yet cover the entire Bay of Fundy region, enough has been collected in a variety of environments within the Bay to determine that the reefs are largely confined to a region of intermediate energy where the horse mussel bioherms were first located. Horse mussels may occur in other smaller areas of the Bay that offer unique and similar dynamic conditions, sediment distributions and water properties.
34 Sample evidence confirms that the horse mussels are distributed across gravel lag areas of the Bay floor but it is the presence of limited amounts of sand in transport as well as the location of the minor morphological features (glacial ridges) that is critical for reef formation. The sand in the region of the reefs is not a continuous sheet and can be described as a zone of starved megaripples (Amos and King 1984). Where sand is moving as bedload across a seabed of gravel, the environment is not optimum for horse mussels attached to the gravel as they are periodically buried and subjected to abrasion. However such an environment is conducive to the entrapment of sand particles by the byssus threads of the horse mussels. As the horse mussels become gradually surrounded by sand in such an environment, upward growth is promoted and successive generations of horse mussels build on top of the older and dead shells. Growth is also enhanced in such an environment that shifts the benthic boundary layer upward away from micro turbulence generated near the rough gravel surface. Such a raised environment continues to increase the availability of seston to the horse mussels.
35 The location of most of the reefs on the east side of morainal ridges is hypothesized to be the result of ridge vortices that are formed during flood conditions on the eastern side of the ridges as spiral vortices with horizontal axis. The rotational velocity of the vortex would depend upon the horizontal current speed and the magnitude of the pressure drop on the lee side of the ridges. It would, provide increased seston to the back ridge regions and lower velocity water flows that would encourage the formation of horse mussel reefs. Over a long period the reefs would become elongated to the east in response to the net sediment transport direction as spat are preferentially transported to the inner bay in the east along the length of the reefs.
36 The megaripples in coarse sand associated with the mussel reefs are normally formed under flow conditions up to 60 cm s-1 (Amos and King 1984). Further up the Bay to the east where the large symmetrical sand waves occur in a region of sand ribbons, flow conditions range between 100 and 240 cm s-1. Based on the finite element model of Greenberg (1979), Wildish and Fader (1998) suggested that the current velocity was a controlling factor in limiting the potential distribution of mussel reefs. The distribution of sand bedforms throughout the Bay supports this interpretation and indicates that the likely area for large-scale mussel reef formation lies in the centre of the Bay in a rather narrow zone. The multibeam bathymetry further indicates that within this region there are micro-environments associated with the morphology of the seabed that ultimately control where the mussel reefs form and grow. Similar microenvironments may also occur in other areas of the Bay of Fundy.
37 Future research
38 One of the limitations of this study is a lack of subsurface information from within the reefs. Vibrocores collected through the reefs would provide an understanding of their age and sedimentological studies could represent a method of examining the history of tidally induced currents within the Bay. Such cores are not only hard to collect because of the strong currents but shelly sands are often difficult to penetrate.
39 New programs of the Geological Survey of Canada and the Canadian Hydrographic Service that are presently underway (2008) are collecting multibeam bathymetric data over the entire Bay of Fundy and will provide the basis for understanding the Bay wide distribution of mussel reefs. Detailed sampling programs can be based on such a data set. A comparison of the 1999 multibeam bathymetry with the 2007 data set will provide an understanding of mussel reef change during this period.
40 Further research is also needed to describe the full range of environmental differences and similarities between geological properties of benthic habitats. In order to estimate accurate spatial differences of secondary production of horse mussels, further work is also required to map completely the distribution of mussel populations in the Bay of Fundy. This can be achieved acoustically over the region SWB, by backscatter contrast mapping for mussel reefs, which form as a result of the interaction between tidally moved sand and the long-term anchoring effect of horse mussel byssus, but not for mussel populations in other geological provinces where backscatter contrasts are notably absent. Remotely operated video surveys could achieve quantitative estimates of horse mussel density where acoustic methods do not offer a solution.
41 In pursuing the possible causes of habitat-specific differences in horse mussel population growth we suggest that new ways to study seston depletion effects could be devised. We suggest that seston depletion effects within populations be considered as the most likely architect of the mussel growth differences between geological settings that we found in this study.
ACKNOWLEDGMENTS
Thanks to Hugh Akagi for technical help in all phases of this work, Dr. David Kristmanson for advice on hydrodynamics and Dr. David Greenberg, for Fig. 7. We thank Drs Julia Wildish, Hans Ulrich Riisgard, Barry Hargrave, and an anonymous referee for critically reviewing earlier versions of the manuscript. John Hughes Clarke and students of the University of New Brunswick are thanked for reprocessing the multibeam bathymetry data. Geological Survey of Canada contribution 20090290.REFERENCES
Amos, C.L., and King, E.L. 1984. Bedforms of the Canadian eastern seaboard: a comparison with global occurrences. Marine Geology 57, pp. 167–208. doi:10.1016/0025-3227(84)90199-3
Anwar, N.A., Richardson, C.A., and Seed,R. 1990. Age determination, growth rate and population structure of the horse mussel Modiolus modiolus. Journal of the Marine Biological Association of the United Kingdom 70, pp. 441–457. doi:10.1017/S0025315400035529
Bertness, M.D., and Grosholz, E. 1985. Population dynamics of the ribbed mussel, Geukensia demissa: the costs and benefits of an aggregated distribution. Oecologia 67, pp. 192–204. doi:10.1007/BF00384283
Comely, C.A. 1978. Modiolus modiolus (L.) from the Scottish west coast. I. Biology. Ophelia 17, pp. 167–193.
Dame, R.F., Zingmark, R.G., Stevenson, H., and Nelson, D. 1980. Filter feeding coupling between the water column and benthic subsystems. In Estuarine Perspectives. Edited by V.S. Kennedy. Academic Press, New York, pp. 521–526.
Epstein, S, Buchbaum, H.A., and Lowenstam, H.A.1953. Revised carbonate-water isotopic temperature scale. Geological Society of America Bulletin 64, pp. 1315–1326. doi:10.1130/0016-7606(1953)64[1315:RCITS]2.0.CO;2
Fader, G.B.J., 1996. Marine aggregate assessment and sediment transport. In Workshop Proceedings, Bay of Fundy Issues: a scientific overview, Wolfville, Nova Scotia, January 29 to February 1, 1996. Edited by J.A. Percy, P.G. Wells, and A.J. Evans. Environment Canada Report No. 8, pp. 30–33.
Greenberg, D.A. 1979. A numerical model investigation of tidal phenomena in the Bay of Fundy and Gulf of Maine. Geodesy 2, pp. 161–187. doi:10.1080/15210607909379345
Greenberg, D.A., Shore, J.A., Page, F.H., and Dowd, M. 2005. A finite element circulation model for embayments with drying intertidal areas and its application to the Quoddy region of the Bay of Fundy. Ocean Modelling 10, pp. 211–231. doi:10.1016/j.ocemod.2004.06.005
Jasmin, A.K., and Brand, A.R. 1989. Observations on the reproduction of Modiolus modiolus in Isle of Man waters. Journal of the Marine Biological Association of the United Kingdom 69, pp. 373–385. doi:10.1017/S0025315400029489
Jones, D.S., Thompson, I., and Ambrose,W. 1978. Age and growth rate determinations for the Atlantic surf clam Spisula solidissima (Bivalvia:Mactracea), based on internal growth lines in shell cross sections. Marine Biology 47, pp. 63–70. doi:10.1007/BF00397019
Kenchington, E.L.R., Gilkinson,K.D., MacIsaac, K.G., Bourbonnais-Boyce, C., Kenchington, T.J., Smith,S.J., and Gordon, D.C. 2006. Effects of experimental otter trawling on benthic assemblages on Western Bank, Northwest Atlantic Ocean. Journal of Sea Research 56, pp. 249–270. doi:10.1016/j.seares.2006.03.010
Krantz, D.E., Jones, D.S., and Williams, D.F. 1984. Growth rates of the sea scallop, Placopecten magellanicus determined from the O18/O16 record in shell calcite. Biological Bulletin 167, pp. 186–199. doi:10.2307/1541347
Lucas, A., and Beninger, P.G. 1985. The use of physiological condition indices in marine bivalve aquaculture. Aquaculture 44, pp. 187–200. doi:10.1016/0044-8486(85)90243-1
Lutz, R.A., and Clark, G.R. 1984. Seasonal and geographical variation in the shell microstructure of a salt-marsh bivalve (Geukensia demissa (Dillwyn)). Journal of Marine Research 42, pp. 943–956. doi:10.1357/002224084788520684
McGrath, D., King, P.A., and Gosling,E.M. 1988. Evidence for the direct settlement of Mytilus edulis larvae on adult mussel beds. Marine Ecology Progress Series 47, pp. 103–106. doi:10.3354/meps047103
Newell, C.R., Wildish, D.J., and MacDonald, B.A. 2001. The effects of velocity and seston concentration on the exhalant siphon area, valve gape and filtration rate of the mussel, Mytilus edulis. Journal of Experimental Marine Biology and Ecology 262, pp. 91–111. doi:10.1016/S0022-0981(01)00285-4
Paull, C.K., Newman, A.C., amEnde, B.A., Ussler III, W., and Rodriquez, N.M. 2000. Lithotherms on the Florida-Hatteras Slope. Marine Geology 166, pp. 83–101. doi:10.1016/ S0025-3227(00)00003-7
Peterson, C.H., and Ambrose,W.G. 1985. Potential habitat dependence in deposition rate of presumptive annual lines in shells of the bivalve Protothaca staminea. Lethia 18, pp. 257–260. doi:10.1111/j.1502-3931.1985.tb00702.x
Rowell, T. 1967. Some aspects of the ecology, growth and reproduction of the horse mussel (Modiolus modiolus). Unpublished M.Sc. Thesis, Queens University, Kingston, Ontario, 138 p.
Schwinghammer, P., Guigne J.Y.P., and Sui, W.G. 1996. Quantifying the impact of benthic habiatat structure using high resolution acoustics and chaos theory. Canadian Journal of Fisheries and Aquatic Sciences 53, pp. 288–296. doi:10.1139/cjfas-53-2-288
Seed, R., and Brown, R.A. 1978. Growth as a strategy for survival in two marine bivalves, Cerastoderma edule and Modiolus modiolus. Journal of Animal Ecology 47, pp. 283–292. doi:10.2307/3936
Seed, R., and Suchanek, T.H.1992. Population and community ecology of Mytilus. In The Mussel Mytilus: Ecology, Physiology, Genetics and Culture. Edited by E. Gosling. Elsevier, Amsterdam, pp. 87–169.
Wiborg, K.B. 1946. Investigations on the horse-mussel (Modiola modiolus (L.)). I. General biology, growth and economic importance. Fisheries Research Board of Canada, Ottawa, Ontario, Translation Series 644. (Original from Fiskeridirektoratets Skrifter Serie Havundersøkelser 8-5, 85 p.).
Wildish, D.J., and Fader, G.B. 1998. Pelagic-benthic coupling in the Bay of Fundy. Hydrobiologia 356/357, pp. 369–380. doi:10.1023/A:1017080116103
Wildish, D.J., and Kristmanson, D.D. 1993. Hydrodynamic control of bivalve filter feeders: a conceptual view. In Bivalve Filter Feeders. Edited by R.F. Dame. NATO ASI Series G, Ecological Sciences 33, pp. 299–324.
Wildish, D.J., and Kristmanson, D.D. 1997. Benthic Suspension Feeders and Flow. Cambridge University Press, New York. 409 p.
Wildish, D.J., and Miyares, M.P. 1990. Filtration rate of blue mussels as a function of flow velocity: preliminary experiments. Journal of Experimental Marine Biology and Ecology 142, pp. 213–220. doi:10.1016/0022-0981(90)90092-Q
Wildish, D., Akagi, H., Hatt, B., Hamilton, N., Brock, V., Dalum, M., Gjerulff, C., Henriksen, K., Hesselberg, K., Iversholt, M., Jensen, B., Johannesen, P., Kristensen,L., Mackenhauer, B., Madsen, T., Michelsen, L., Nielsen, K., Norgaard, H., Olesen, D., Pedersen, L., Rosenkrands, T., Sondergård, B., and Stottrup, L. 1998a. Population analysis of horse mussels of the inner Bay of Fundy based on estimated age, valve allometry and biomass. Canadian Technical Report of the Fisheries and Aquatic Sciences 2257, 43 p.
Wildish, D.J., Fader, G.B.J., Lawton, P., and MacDonald, A.J. 1998b. Acoustic methods for determining the spatial distribution of sublittoral bivalve reefs. Continental Shelf Research 18, pp. 105–113. doi:10.1016/S0278-4343(98)80002-2
Editorial responsibility: Simon K. Haslett