Mercury concentrations in the bedrock of southwestern Nova Scotia:a reconnaissance study
Krista D. PageDepartment of Earth Sciences, Dalhousie University, Halifax, Nova Scotia, B5H 4J1, Canada
J. Brendan Murphy
Department of Earth Sciences, St. Francis Xavier University, P.O. Box 5000, Antigonish, Nova Scotia, B2G 2W5, Canada
bmurphy@stfx.ca
Date received: December 5, 2003 ¶ Date accepted: February 15, 2005
ABSTRACT
Kejimkujik National Park in southwestern Nova Scotia contains an ecosystem affected by Hg contamination. Although the source of the Hg has been regarded as anthropogenic, it is unclear what role the underlying geology may play. In order to assess the possibility that Hg contamination might be, at least in part, from the underlying bedrock, we present Hg analyses of biotite-rich granitoid, muscovite-rich granitoid, and mafic rocks from the area in order to complement previous regional studies. A correlation matrix reveals significant positive correlations between Hg, Mg, Fe, and Ca, as well as with the trace elements Co, Fe, Ga, Mg, Mn, Mo, S, Sr, Te , and V. The highest Hg concentrations in the granitoid rocks are in samples from the Boot Lake Granodiorite, which contains up to 32% biotite. The muscovite-rich granitoid rocks yield consistently low concentrations of Hg. Taken together, we suggest a direct relationship between anomalous Hg concentrations in bedrock and the modal abundance of biotite. This study, together with previous work which reports correlations between high Hg concentrations in fish and areas that are underlain by biotite-rich granitoid rocks, suggests that the potential role of biotite-rich rocks as a contributor to the contaminated ecosystem at Kejimkujik National Park requires further investigation.RÉSUMÉ
Le parc national Kejimkujik dans le Sud-Ouest de la Nouvelle-Écosse abrite un écosystème affecté par une contamination de Hg. Même si on considère que le Hg provient d'une source anthropique, on ignore quel rôle la géologie sous-jacente pourrait jouer. Pour évaluer la possibilité que la contamination par le Hg puisse provenir, du moins en partie, du substrat rocheux sous-jacent, nous présentons des analyses du Hg de roches granitiques riches en biotite, de roches granitiques riches en muscovite et de roches mafiques du secteur qui compléteront les études régionales antérieures. Une matrice de corrélation révèle des corrélations positives déterminantes entre le Hg, le Mg, le Fe et le Ca, ainsi qu'avec les éléments traces de Co, Fe, Ga, Mg, Mn, Mo, S, Sr, Te et V. Les concentrations de Hg les plus élevées dans les roches granitiques se trouvent dans les échantillons de la granodiorite du lac Boot, qui renferme jusqu'à 32 % de biotite. Les roches granitiques à forte teneur en muscovite présentent constamment de faibles concentrations de Hg. Nous appuyant sur l'ensemble de ces données, nous avançons qu'il existe un lien direct entre les concentrations anomales de Hg dans le substrat rocheux et l'abondance modale de biotite. Cette étude, conjuguée aux travaux antérieurs faisant état de corrélations entre les concentrations élevées de Hg dans le poisson et dans les secteurs reposant sur des roches granitiques à forte teneur en biotite, laisse supposer qu'il faudrait une étude plus approfondie pour vérifier la contribution possible des roches riches en biotite à la contamination de l'écosystème du parc national Kejimkujik.[Traduit par la rédaction]INTRODUCTION
1 Kejimkujik National Park, located in southwestern Nova Scotia (Fig. 1), is a remote ecosystem in which fish and loon mercury (Hg) concentrations are anomalously high (Burgess et al. 1998). In most studies, Hg contamination of remote ecosystems is attributed to atmospheric sources (e.g., Lindqvist 1994). However, studies in the park have shown that Hg concentrations in the atmosphere are not high enough to account for those observed in the biota (Beauchamp et al. 1998a, b), indicating that the anomalous Hg levels may originate from another source (e.g., the underlying bedrock).
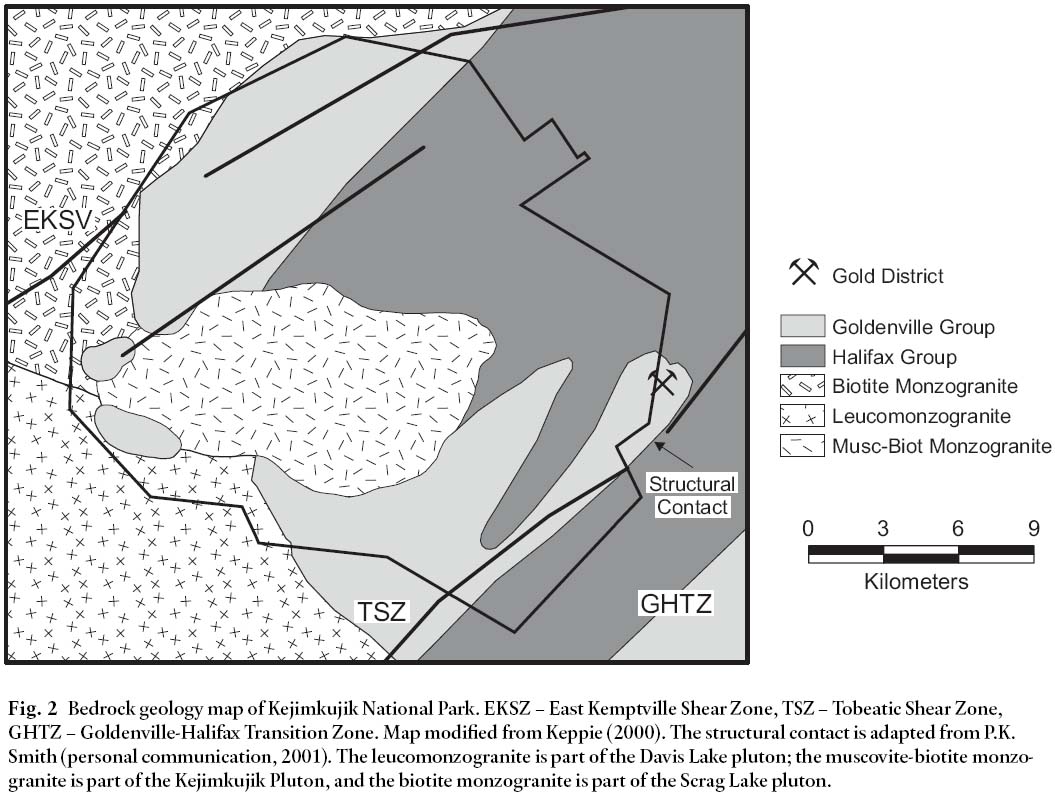
2 Kejimkujik National Park (KNP) is underlain by three types of granite (leucomonzogranite, muscovite-biotite monzogranite, and biotite monzogranite) and rocks from the Halifax and Goldenville groups (Fig. 2). Recent studies have shown that the highest Hg values are in the western-central part of the park (Page and Murphy 2003), an area underlain by biotite-rich granitoid rocks. Previous studies by Smith (2000) showed that biotite-rich granitoid and mafic rocks in Nova Scotia yield higher Hg values compared to other rocks in the province. Smith (2000) reported that Hg concentrations reach 23 ppb in granite and 25 ppb in mafic intrusions. Concentrations in biotite separates range in value from 6– 39 ppb (n=6; 5.7, 5.9, 6.7, 8.4, 17, and 39 ppb). These values are generally high in comparison to a regional average of 3.3 ppb (Smith 2000).
3 Smith (2000) and Page and Murphy (2003) suggested that mafic rocks and Fe-Mg minerals might play a role in the Hg concentrations in KNP. The study reported in this paper is an attempt to test the correlation of Hg concentrations with mafic rocks and Fe-Mg minerals. Samples could not be collected in KNP due to poor bedrock exposure. Instead, lithologies similar to those in the park were sampled from elsewhere in southwestern Nova Scotia.
Fig. 1 Location map for Kejimkujik National Park, Nova Scotia. Map coordinates are UTM NAD83.Fig. 2 Bedrock geology map of Kejimkujik National Park. EKSZ – East Kemptville Shear Zone, TSZ – Tobeatic Shear Zone, GHTZ – Goldenville-Halifax Transition Zone. Map modified from Keppie (2000). The structural contact is adapted from P.K. Smith (personal communication, 2001). The leucomonzogranite is part of the Davis Lake pluton; the muscovite-biotite monzo-granite is part of the Kejimkujik Pluton, and the biotite monzogranite is part of the Scrag Lake pluton.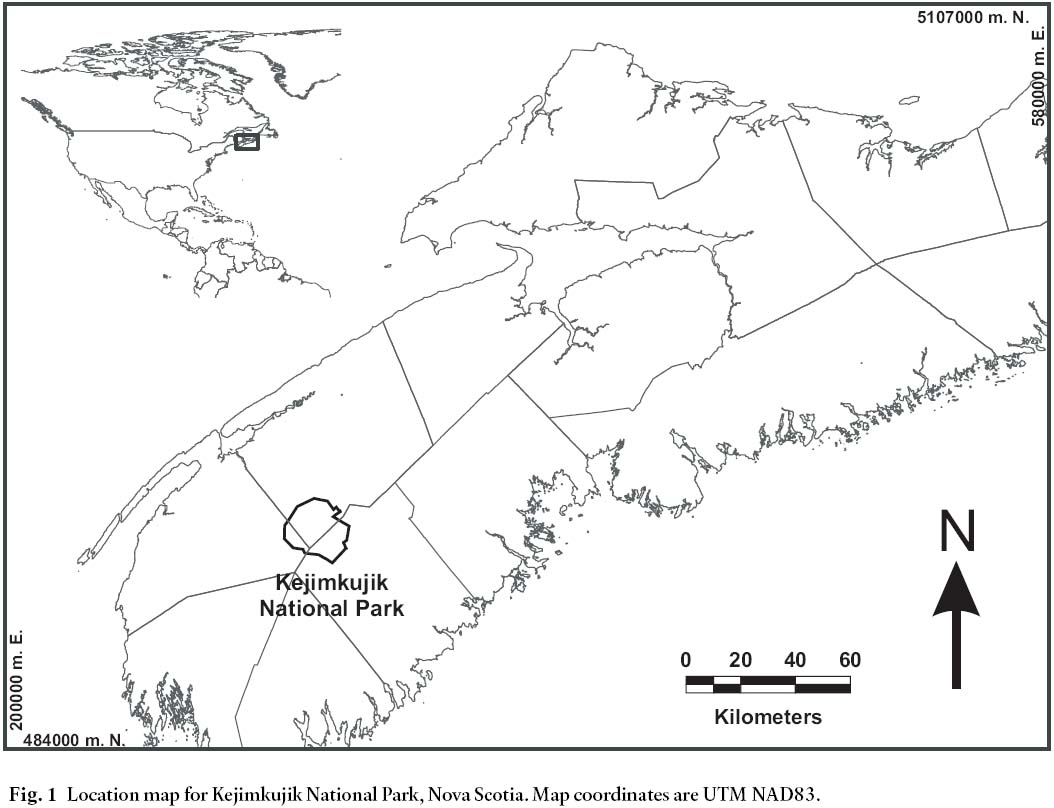
METHODS
Sampling Methodology
4 Ninety bedrock samples from 30 locations (three samples at each location) were collected in southwestern Nova Scotia during the summer of 2000 (Fig. 3). Samples 3– 5, 7, 9– 12, 29– 31, 42 are from mafic (gabbroic) intrusions. Samples 2, 24– 25, 33, 37– 38, 40– 41 are from biotite-rich granitoid units in the South Mountain Batholith (SMB). Samples 13– 15, 18, 20, 23, 26, 34– 35 are from muscovite-rich granitoid units in the SMB, and were collected for comparison with the biotite-rich samples. At each location, one sample was used for Hg and selected trace element analysis and the other two duplicate samples are stored at Dalhousie University in Halifax, Nova Scotia for future study if needed. An attempt was made in the field to collect only fresh samples with no visible signs of weathering.
Fig. 3 Maps showing sample locations. Abbreviations (e.g. 02 = R002; see Table 3). Note: The lithological units in this fi gure are based on a 1:500 000 scale digital map. Therefore, they do not correspond exactly to the rock unit descriptions in Table 2, which are based on the 1:50 000 maps cited in the text.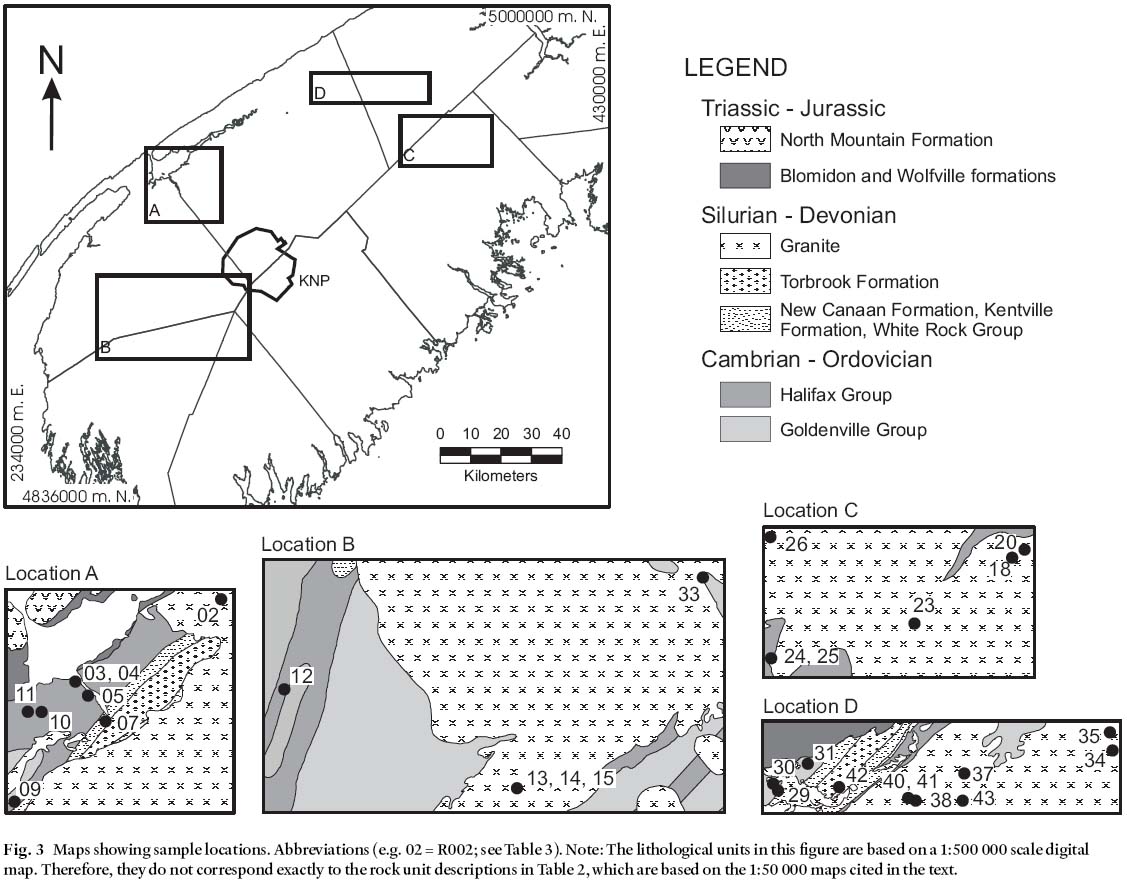
Analytical Methodology
5 All samples were crushed and pulverized (-200 mesh) at DalTech, Halifax, Nova Scotia. One vial was sent to Bondar Clegg Laboratories, Vancouver, British Columbia, for elemental analysis (Au-Ag-Cu-Pb-Zn-Mo-Ni-Co-Cd-Bi-As-Sb-Fe-Mn-Te-Ba-Cr-V-Sn-W-La-Al-Mg-Ca-Na-K-Sr-Y-Ga-Li-Nb-Sc-Ta-Ti-Zr-S) and another vial was sent to Acme Laboratories in Vancouver for Hg analysis. For Au analysis, samples were weighed into a fire assay pot and then analyzed by Inductively Coupled Plasma-Atomic Emission Spectrometry (ICP-AES). For the other elements (excluding Hg), samples were digested with a mixture of hydrochloric and nitric acids and analyzed using ICP-AES. For Hg analysis, the samples were digested in an aqua regia mixture of 1:1:1 H2O-HCl-HN03 and analyzed using a Cetac Hg Analyzer, as described by Page (2001).
Quality Assurance/Quality Control (QA/QC)
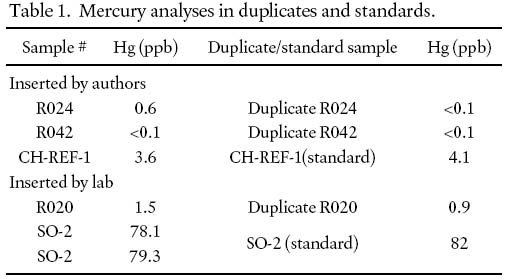
6 One standard (CH-REF-1) and two duplicates were included with the 30 rock samples sent to Acme and Bondar Clegg laboratories. Acme Laboratories inserted an additional duplicate and two additional internal standards for the Hg analysis. The results are presented in Table 1. The lower detection limit for Hg is 0.1 ppb.
Table 1. Mercury analyses in duplicates and standards.
LITHOLOGICAL DESCRIPTIONS
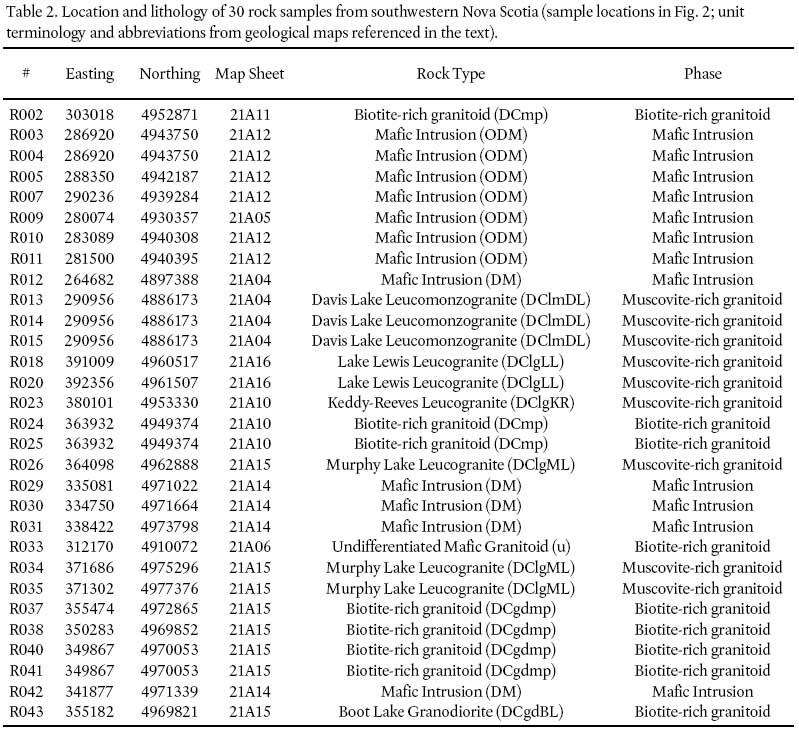
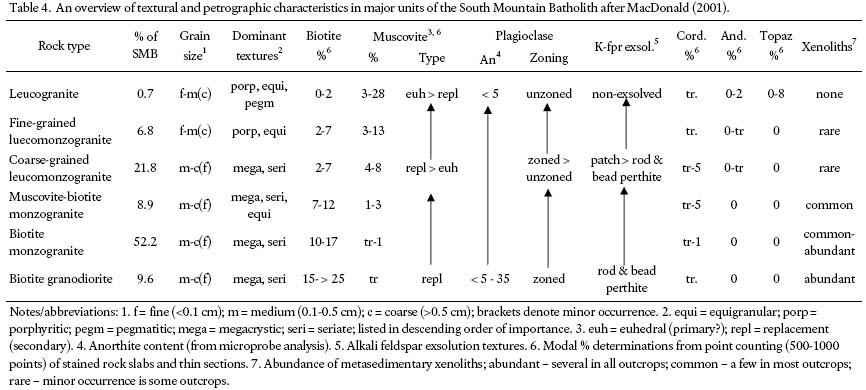
7 Tables 2 and 3 provide a summary of the lithology, location, and analytical results for each of the 30 analyzed rock samples. The rock types are based on the 1:50 000-scale geological maps of the South Mountain Batholith (SMB) published by the Nova Scotia Department of Natural Resources, specifically Ham (1991, 1994), Horne (1992), MacDonald and Ham (1992, 1994a, b), Corey and Horne (1994), Ham and MacDonald (1994), and Horne and Corey (1994). The SMB classification of MacDonald (2001) was used to categorize the granite lithologies into muscovite-rich and biotite-rich units. MacDonald (2001) divided the SMB into six dominant rock units based on (1) modal proportions of quartz, alkali feldspar, plagioclase, and mafic minerals (primarily biotite), (2) texture, and (3) grain size. From relatively muscovite-rich to biotite-rich, these units are (1) leucogranite, (2) fine-grained leucomonzogranite, (3) coarse-grained leucomonzogranite, (4) muscovite-biotite monzogranite, (5) biotite monzogranite, and (6) biotite granodiorite. A general textural and petrographic description for each of these units is shown in Table 4. In addition to these units, MacDonald (2001) also described "mafic porphyry", a granitoid rock that contains the highest percentage of biotite in the batholith.
8 In this study, muscovite-rich rocks include samples from the leucogranite and leucomonzogranite bodies of MacDonald (2001). Biotite-rich rocks include samples from the biotite granodiorite and mafic porphyry bodies of MacDonald (2001). Units designated as "Mafic intrusion" are primarily gabbroic sills.
Table 2. Location and lithology of 30 rock samples from southwestern Nova Scotia (sample locations in Fig. 2; unit terminology and abbreviations from geological maps referenced in the text).
Display large image of Table 2
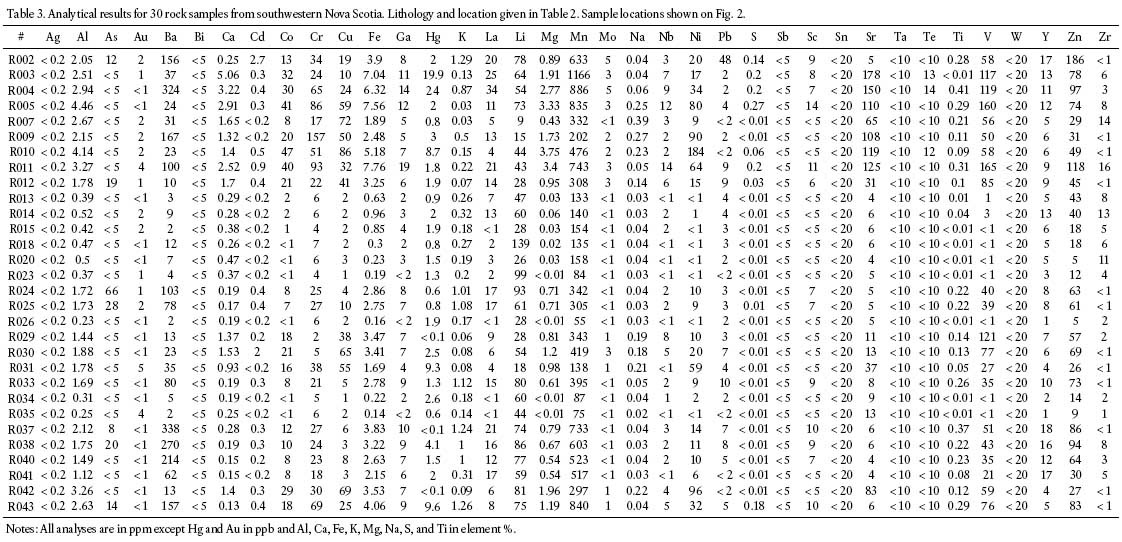
Table 3. Analytical results for 30 rock samples from southwestern Nova Scotia. Lithology and location given in Table 2. Sample locations shown on Fig. 2.
Display large image of Table 3
Table 1. Mercury analyses in duplicates and standards.
Display large image of Table 4
Muscovite-rich Granitoid Units
Leucogranite
9 Leucogranite is the most muscovite-rich unit in the batholith, and underlies 0.7% of the region mapped as SMB (Table 4). The leucogranite contains 0– 2% biotite, 3– 28% muscovite, 0– 8% topaz, 0– 2% andalusite, and trace amounts of cordierite (MacDonald 2001). Three leucogranite bodies were sampled: (1) Lake Lewis Leucogranite, (2) Murphy Lake Leucogranite, and (3) Keddy-Reeves Leucogranite.
10 The Lake Lewis Leucogranite (map sheet 21A16) is fine to medium grained and equigranular, with < 2% biotite, and 2– 3% muscovite (Ham 1991). This unit is a typical leucogranite of the SMB (MacDonald 2001), and is represented by sample R018 (Table 3). Aplite dykes are common throughout the unit, and are represented by sample R020.
11 The Murphy Lake Leucogranite (map sheet 21A15) shows a wide range of texture and mineralogy (MacDonald and Ham 1992). Most of the unit is leucogranite; however, some areas are leucomonzogranite. These rocks are characterized by 0– 5% biotite and 2– 8% muscovite. Most of the biotite in this unit has been altered to hematite (MacDonald and Ham 1992). Samples R026 and R034-35 were taken from this unit.
12 The Keddy-Reeves Leucogranite is best exposed in a quarry on map sheet 21A10. It has 0– 2% biotite, 1– 5% muscovite, and secondary hematite and clay minerals (Horne 1992). Sample R023 was taken from this unit.
Leucomonzogranite
13 The only leucomonzogranite unit sampled is the Davis Lake Leucomonzogranite (map sheet 21A04). It contains 4– 6% biotite, <1% muscovite, and very minor cordierite, fluorite, and quartz (Ham and MacDonald 1994). Samples R013-15 are greisen rocks that were collected from the unit near the Tobeatic Shear Zone and East Kemptville tin deposit.
Biotite-rich Granitoid Units
14 Three rock types fall under the broad category of "biotite-rich granitoids", which refers to granitoid rocks with relatively high (10– 30 modal %) mafic mineral content (predominately biotite) in the SMB. They include (1) mafic porphyry, (2) Boot Lake Granodiorite, which has the largest percentage of biotite in the entire SMB (up to 32%; MacDonald 2001), and (3) undifferentiated mafic granitoid rocks.
15 The mafic porphyry units, as described by MacDonald (2001), underlie about 0.07% of the entire SMB. They are generally small bodies that range in diameter from <100 m2 – 1 km2, and show a wide range of texture and mineralogy. They range in composition from granodiorite to monzogranite, and generally contain between 10– 20% biotite (with inclusions of apatite, zircon, monazite, and ilmenite), trace amounts of muscovite, and less than 2% garnet. The mafic porphyry samples collected for this study are all of granodiorite composition, dark grey, and fine to medium grained. Samples R024-25, 37– 38, and 40– 41 have 15– 20% biotite, whereas sample R002 has >20% biotite.
16 The Boot Lake Grandiorite (map sheet 21A15) is fine to medium grained, porphyritic (feldspar and quartz) to equigranular, and rarely megacrystic. It contains up to 32% biotite and is locally of tonalite composition (MacDonald and Ham 1992). Sample R043 was collected from this unit. These characteristics are different from those displayed by typical granodiorite bodies in the SMB, which are medium to coarse grained and megacrystic, have 15– 25% biotite (with accessory apatite, zircon, monazite, xenotime, and ilmenite), trace amounts of muscovite, cordierite, and garnet, and have high proportions of xenoliths derived from the Meguma Group (MacDonald 2001).
17 The undifferentiated mafic granitoid unit (map sheet 21A06), located in KNP, has been described as a mafic granitoid (Horne and Corey 1994). Although outcrop of this unit is not exposed in the area, Horne and Corey, (1994) identified a number of boulders that are believed to represent the unit. Sample R033 was collected from one of these boulders.
Mafic Intrusions
18 Mafic intrusions are common in the Paleozoic rocks along the northern part of southwestern Nova Scotia (MacDonald 1994). Most of the bodies are gabbroic sills that are fine to medium grained, with some peridotite and quartz gabbro (Smitheringale 1973; Barr et al. 1983; White and Barr 2004). The samples collected for this study are from units on NTS map sheets 21A04 (sample R012), 21A05 (sample R09), 21A12 (samples R03-5, 7, 10– 11), and 21A14 (samples R029-31, 42).
RESULTS
Hg Concentrations in Rocks
19 The minimum Hg value obtained is below the detection limit of 0.1 ppb and the maximum Hg value is 24 ppb (sample R004, mafic intrusion). The average value for the 30 samples is 3.7 ppb, with a standard deviation of 5.6. With the exception of two highly anomalous values (20 and 24 ppb), the values range from below the detection limit to 9.6 ppb (Table 3).
20 The average values (using 0.05 ppb for values below the detection limit) are 1.5 ppb (n = 9, range = 0.6 – 2.6 ppb) for the muscovite-rich granitoid samples, 2.4 ppb (n = 9, range = <0.1 – 9.6 ppb) for the biotite-rich granitoid samples, and 6.2 ppb (n = 12, range = <0.1 – 24 ppb) for the mafic intrusion samples.
21 Figure 4 shows the range in Hg values for each of the three rock categories (muscovite-rich, biotite-rich, and mafic intrusions). Most of the values for each of the rock types are at, or below, the average value of 3.7 ppb Hg. All of the muscovite-rich samples are below this value, two of the biotite-rich samples are above 3.7 ppb, and four of the mafic intrusion samples are above 3.7 ppb.
Fig. 4 Hg values for each of the three lithological categories (muscovite-rich granitoid, biotite-rich granitoid, and mafic intrusion). The muscovite-rich category consists of rocks from leucogranite and leucomonzogranite units and aplite dykes. The biotite-rich category consists of rocks from the mafic porphyry and the granodiorite. The mafic intrusions are primarily gabbroic sills. Average Hg value for 30 samples is 3.7 ppb.
Geochemical Correlations
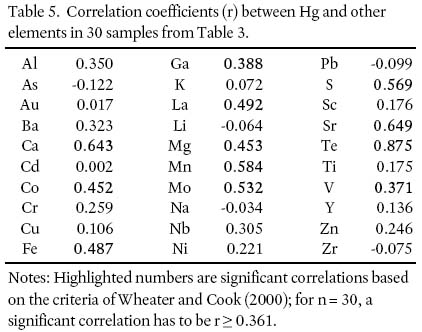
22 Pearson's product moment correlation coefficients between Hg and the other trace elements were generated for the 30 samples (Table 5). In order for a correlation (r) to be significant (at P = 0.05) for 30 samples, r must be ≥ 0.361 (Wheater and Cook 2000). Mercury has a significant positive correlation with Ca (0.643), Co (0.452), Fe (0.487), Ga (0.388), Mg (0.453), Mn (0.584), Mo (0.532), S (0.569), Sr (0.649), Te (0.875), and V (0.371). For comparison, Smith (2000) showed significant correlations between Hg and Ca, Cd, Co, Cr, Fe, Mg, Ni, Sb, Sr, and V.
Table 5. Correlation coefficients (r) between Hg and other elements in 30 samples from Table 3.
DISCUSSION
23 Most of the samples have Hg concentrations below the average value of 3.7 ppb (Fig. 4). However, on average the more mafic and biotite-rich rocks contain higher Hg concentrations.
24 The highest Hg concentration is from the Boot Lake Granodiorite (sample 43, 9.6 ppb Hg). This unit has the highest modal percentage of biotite (up to 32%; MacDonald 2001). This association, in addition to consistently low concentrations of Hg in the muscovite-rich granitoid samples, indicates a relationship between anomalous Hg concentrations and the abundance of biotite.
25 The correlation results show a positive correlation of Hg with Fe and Mg, consistent with the findings of Smith (2000). Studies in KNP indicate a correlation between Hg and Fe in lake sediment and between Hg and Fe and Al in lake water (Page and Murphy 2003). As biotite is the predominant Fe- and Mg-bearing mineral in these rocks, these positive correlations provide further evidence of a relationship between Hg and the abundance of modal biotite.
26 Few data are available in the literature about the location of Hg within the biotite crystal structure. However, the size (0.110 nm) of Hg2+ inhibits it from fitting in the tetrahedral or octahedral sites in the mineral. Cations must be between 0.034 - 0.056 nm (tetrahedral) or 0.056- 0.99 nm (octahedral) to fit inside these structures (Harter 1998). Hence Hg is likely to be preferentially located between the silicate sheets, either in the sites that normally contain potassium (the potassium sites generally accept cations between 0.75 – 0.145 nm (Harter 1998)), or in relatively high energy sites, such as along the cleavage planes or in crystal defects. In any of these locations, the Hg is readily available for transportation by secondary processes such as weathering.
27 The two highest Hg values (20 and 24 ppb) are from a mafic intrusion located in the Digby area (samples R003 and R004). Smith (2000) also reported high results from the same unit (23 and 25 ppb). The reason for these high Hg concentrations in this unit is unclear. More detailed work needs to be done in order to access the origin of this anomaly. However, it is interesting to note that Smith (2000) also found anomalously high Hg concentrations in slate and metasiltstone that host these intrusions.
CONCLUSIONS
28 The results from this study provide the following conclusions:
- Overall, biotite-rich granitoid units in the SMB have higher Hg concentrations than muscovite-rich granitoid units.
- The granitoid sample that yielded the highest Hg value is from the Boot Lake Granodiorite. This unit has the highest modal percentage of biotite (up to 32%) in the SMB.
- Mercury shows a significant positive correlation with Fe and Mg.
29 All of this evidence indicates a positive association between Hg and biotite. If this is the case, then the biotite monzogranite unit in KNP (Fig. 2) might be contributing elevated amounts of Hg to the surrounding environment.
ACKNOWLEDGMENTS
We would like to thank the Toxic Substance Research Initiative (TSRI) team for their financial support and significant intellectual contribution. In particular we thank Andy Rencz, Paul Smith, Terry Goodwin, Anne-Marie O'Beirne-Ryan, Al Sangster, and Tom Clair. We also thank the journal reviewers and editors for their suggestions for the improvement of the manuscript.REFERENCES
Barr, S.M., Doyle, E.M., & Trapasso, L.S. 1983. Geochemistry and tectonic implications of mafic sills in early Palaeozoic formations of southwestern Nova Scotia. Maritime Sediments and Atlantic Geology, 19, pp. 73– 87.
Beauchamp, S., Tordon, R., Schroeder, B., & Witte, J. 1998a. Ecological Monitoring and Assessment Network, and New Brunswick Department of the Environment. Total Gaseous Mercury. In Mercury in Atlantic Canada – A Progress Report. Edited by The Mercury Team. Chapter 3, Mercury in the Atmosphere. Environment Canada. pp. 17– 30.
Beauchamp, S., & Tordon, R. 1998b Ecological Monitoring and Assessment Network, Mercury Deposition Network, and New Brunswick Department of the Environment. 1998b. Mercury in Precipitation. In Mercury in Atlantic Canada – A Progress Report. Edited by The Mercury Team. Environment Canada. Chapter 3, Mercury in the Atmosphere. pp. 31– 35.
Burgess, N.M., Beauchamp, S., Brun, G.L., Clair, T.A., Roberts, C.G., Rutherford, L.A., Tordon, R., & Vaidya, O.C. 1998. In Mercury in Atlantic Canada – A Progress Report. Environment Canada – Atlantic Region.
Corey, M.C., & Horne, R.H. 1994. Geological Map of Milford, Nova Scotia. Nova Scotia Department of Natural Resources. Mines and Energy Branches. Map Sheet 21A/11. Map 94-06. Scale 1:50 000.
Ham, L.J. 1991. Geological Map of Windsor, Nova Scotia. Nova Scotia Department of Natural Resources. Mines and Energy Branches. Map Sheet 21A/16 and part of 21H/01. Map 90-10. Scale 1:50 000.
Ham, L.J. 1994. Geological Map of Digby, Nova Scotia. Nova Scotia Department of Natural Resources. Mines and Energy Branches. Map Sheet 21A/12. Map 94-07. Scale 1:50 000.
Ham, L.J., & MacDonald, M.A. 1994. Geological Map of Wentworth Lake, Nova Scotia. Nova Scotia Department of Natural Resources. Mines and Energy Branches. Map Sheet 21A/04 and part of 20P/13. Map 94-03. Scale 1:50 000.
Harter, R. (1998, January). [Online]. Building the Phyllosilicates. Department of Natural Resources. University of New Hampshire. <http://pubpages.unh.edu/~harter/crystal.htm>. (2001, July 20).
Horne, R.J. 1992. Geological Map of New Germany, Nova Scotia. Nova Scotia Department of Natural Resources. Mines and Energy Branches. Map Sheet 21A/10. Map 93-01. Scale 1:50 000.
Horne, R.J., & Corey, M.C. 1994. Geological Map of Kejimkujik Lake, Nova Scotia. Nova Scotia Department of Natural Resources. Mines and Energy Branches. Map Sheet 21A/06 and part of 21A/07. Map 94-05. Scale 1:50 000.
Keppie, J.D. 2000. [Online]. Digital Geological Map of the Province of Nova Scotia. Version 1. Nova Scotia Department of Natural Resources. Map D00-01. Scale 1: 500 000. <http://www.gov.ns.ca/natr/meb/pubs3.htm#maps>. [2001, May 20].
Lindqvist, O. 1994. Atmospheric Cycling of Mercury: An Overview. In Mercury Pollution - Integration and Synthesis. Edited by Carl J. Watras and John W. Huckabee. pp.181– 186.
MacDonald, M.A. 1994. Geological Map of the South Mountain Batholith. Nova Scotia Department of Natural Resources. Map 94-01. Scale 1: 250 000.
MacDonald, M.A. 2001. Geology of the South Mountain Batholith, Southwestern Nova Scotia. Nova Scotia Department of Natural Resources. Minerals and Energy Branch. Open File Report ME 2001-1.
MacDonald, M.A., & Ham, L.J. 1992. Geological Map of Gaspereau Lake, Nova Scotia. Nova Scotia Department of Natural Resources. Mines and Energy Branches. Map Sheet 21A/15 and part of 21H/02. Map 92-01. Scale 1:50 000.
MacDonald, M.A., & Ham, L.J. 1994a. Geological Map of Weymouth, Nova Scotia. Nova Scotia Department of Natural Resources. Mines and Energy Branches. Map Sheet 21A/05. Map 94-04. Scale 1:50 000.
MacDonald, M.A., & Ham, L.J. 1994b. Geological Map of Bridgetown, Nova Scotia. Nova Scotia Department of Natural Resources. Mines and Energy Branches. Map Sheet 21A/14. Map 94-08. Scale 1:50 000.
Page, K.D. 2001. An Examination of Mercury (Hg) Contamination in Kejimkujik National Park: The Role of Geological Sources. M.Sc. thesis. Dalhousie University. Halifax, Nova Scotia.
Page, K.D., & Murphy, J.B. 2003. The Geological sources of Hg contamination in Kejimkujik National Park, Nova Scotia, Canada: A GIS approach. Environmental Geology, v. 43, pp. 882– 891.
Smith, P.K. 2000. Mercury and Trace Element Geochemistry of Selected Bedrock Lithologies in the Kejimkujik National Park, Southern Nova Scotia. In Multi-Disciplinary Study of Metal Cycling, Primarily Hg, in Aquatic And Terrestrial Environments. Edited by N. O'Driscoll, A. Rencz, and T.A. Clair. First Workshop Proceedings of Kejimkujik Toxic Substance Research Initiative Work Group. Environment Canada-Atlantic Region, Occasional Report no. 15. Environment Canada. Sackville, New Brunswick. pp. 37– 45.
Smitheringale, W.C. 1973. Geology of Parts of Digby, Bridgetown, and Gaspereau Lake Map-Areas, Nova Scotia. Geological Survey of Canada Memoir 375.
Wheater, C.P., & Cook, P.A. 2000. Using Statistics to Understand the Environment. Routledge Introduction to Environment Series. Routledge Publishing, London.
White, C.E., & Barr, S.M. 2004. Age and petrochemistry of mafic sills of the northwestern margin of the Meguma terrane in the Bear River - Yarmouth area of southwestern Nova Scotia. In Mineral Resources Branch, Report of Activities 2003. Edited by D.R. MacDonald. Nova Scotia Department of Natural Resources, Report 2004-1, pp. 97– 117.
Editorial responsibility: Sandra M. Barr