Article
Investigation of the Cape Fear arch and East Coast fault system in the Coastal Plain of North Carolina and northeastern South Carolina, USA, using LiDAR data
doi: 10.4138/atlgeol.2021.015
Abstract
LiDAR data collected in the Coastal Plain of the Carolinas revealed numerous, mostly NW-SE-oriented lineaments that cross the Cape Fear arch, the longest of which are the 50- to 115-km-long, NW-SE-oriented Faison, Jarmantown, Livingston Creek, and White Marsh lineaments and the ~50-km-long, ENE-WSW-oriented Tomahawk lineament in southeastern North Carolina. Their interpretation is based mainly on locally incised channels, abrupt stream bends, topographic scarps, and linear areas of uplifted Coastal Plain sediments. The Precambrian to Paleozoic Graingers basin or synform in the pre-Cretaceous basement terminates to the southwest along the ~28-km-long, 3- to 7-km-wide Jarmantown high. The ~115-km-long Jarmantown lineament may be the surface expression of the previously reported Neuse fault, the location of which has been controversial. The Jarmantown and other lineaments crossing the Cape Fear arch suggest that the arch is structurally complex. Further investigation of the East Coast fault system (ECFS) along the west side of the Cape Fear arch in North Carolina revealed that it is located farther to the northwest than previously reported, thereby making it continuous with the ECFS in northeastern South Carolina where it forms a ~15° restraining bend. We postulate that the interpreted faults crossing the Cape Fear arch in southeastern North Carolina formed to compensate for the increased compression and change in volume from dextral motion along the fault bend. Holocene paleoliquefaction deposits near the coast, a vertically offset Pleistocene(?) beach ridge along the interpreted Faison fault, and Tertiary surface faults along the ECFS northeast of Smithfield, North Carolina, suggest that large Quaternary earthquakes may have occurred along the ECFS, the Faison and Neuse faults, and other interpreted faults that cross the Cape Fear arch.
Résumé
Des données LiDAR prélevées dans la plaine côtière des Carolines ont mis au jour de nombreux linéaments, principalement orientés du nord-ouest au sud-est, qui traversent l’arc de Cape Fear, parmi lesquels les plus longs sont les linéaments de 50 à 115 kilomètres de longueur orientés du nord-ouest au sud-est de Faison, de Jarmantown, de Livingston Creek et de White Marsh ainsi que le linéament d’une cinquantaine de kilomètres de longueur orienté de l’est-nord-est à l’ouest-sud-ouest de Tomahawk dans le sud-est de la Caroline du Nord. Leur interprétation est essentiellement basée sur des chenaux localement encaissés, des courbes abruptes de cours d’eau, des escarpements topographiques et des secteurs linéaires de sédiments de la plaine côtière soulevés. Le bassin ou pli synforme paléozoïque de Graingers dans le socle précrétacé prend fin au sud-ouest le long de la crête d’environ 28 kilomètres de longueur sur trois à sept kilomètres de largeur de Jarmantown. Le linéament d’environ 115 kilomètres de longueur de Jarmantown pourrait constituer le modelé de la faille précédemment signalée de Neuse, dont l’emplacement a fait l’objet d’une controverse. Le linéament de Jarmantown et les autres linéaments traversant l’arc de Cape Fear laissent supposer que l’arc est d’une forte complexité structurale. Une étude plus poussée du système de failles de la côte est (SFCE) le long du versant occidental de l’arc de Cape Fear en Caroline du Nord a révélé qu’il se trouve beaucoup plus au nord-ouest que précédemment signalé, ce qui en fait un membre continu du SFCE dans le nord-est de la Caroline du Sud, où il crée une inflexion de retenue d’environ 15 degrés. Nous postulons que les failles interprétées traversant l’arc de Cape Fear dans le sud-est de la Caroline du Nord se sont formées pour compenser la compression accrue et la variation du volume découlant du mouvement dextre le long de l’inflexion de la faille. Les dépôts de paléoliquéfaction de l’Holocène près de la côte, une crête de plage verticalement décalée du Pléistocène (?) le long de la faille interprétée de Faison et les failles superficielles du Tertiaire le long du SFCE au nord-est de Smithfield, en Caroline du Nord, permettent de supposer que des séismes importants pourraient être survenus au cours du Quaternaire le long du SFCE, des failles de Faison et de Neuse, ainsi que d’autres failles interprétées traversant l’arc de Cape Fear.
[Traduit par la redaction]
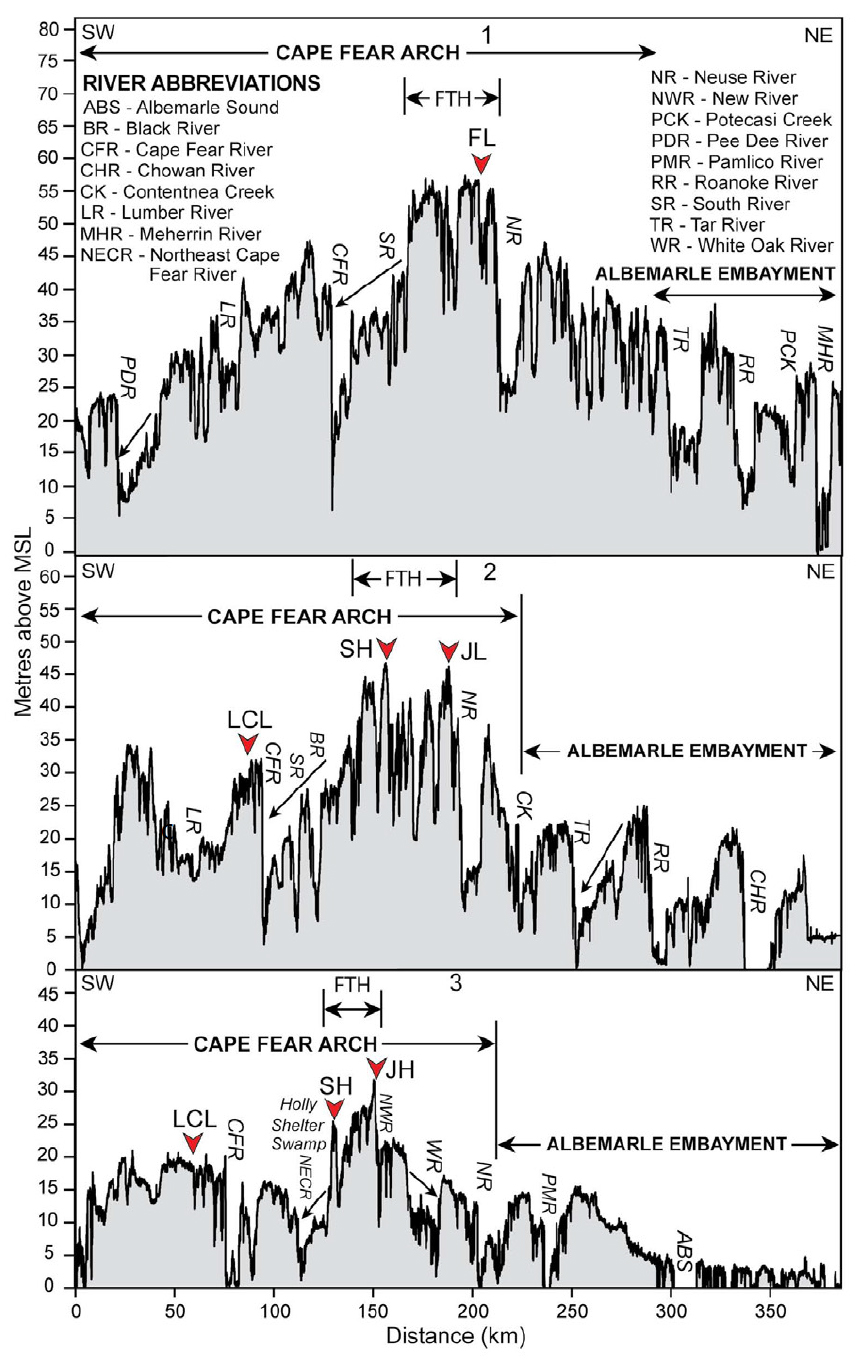
INTRODUCTION
1 The Cape Fear arch, also known as the Great Carolina Ridge, Mid-Carolina Platform High, and Wilmington Anticline (e.g., Dall and Harris 1892; LeGrand 1955; Riggs and Belknap 1988), is a major post-rift structural high beneath the Coastal Plain of the Carolinas and the continental shelf (Stephenson 1923; Gleason 1981; Gohn 1988) (Figs. 1 and 2). The arch spans ~350 km across the Coastal Plain and continues offshore at least 150 km (Fig. 1, index map) (Popenoe and Zietz 1977; Soller 1988). The arch is asymmetrical with the steeper flank to the northeast (Maher 1971). The axis of the arch is commonly placed along the lower Cape Fear River valley, roughly parallel to the South Carolina-North Carolina border. Topographic profiles and images generated from the LiDAR data suggest that the main axis of uplift is located farther northeast along the Cape Fear-Neuse River divide, approximately along the Faison and Jarmantown lineaments interpreted herein (Figs. 2, 3a, and 3b).
 Display large image of Figure 1
 Display large image of Figure 2
2 The arch appears to have a deep crustal origin, although its exact cause is unknown (Biryol et al. 2016). Thus, various hypotheses have been presented to explain its origin. Le Pichon and Fox (1971), for example, proposed that the arch is a structural lineament along which an oceanic fracture zone developed during the early opening of the Atlantic. Harris et al. (1979), in contrast, hypothesized that the Cape Fear arch represents Cenozoic uplift along a horst between the NWSE-oriented Cape Fear and Neuse faults. Morgan (1983) attributed the arch to the passing of the Bermuda Hot Spot beneath the area during the Paleocene, but fails to explain the ongoing uplift along the arch (Vogt 1991). Weems et al. (2011a) concluded that the Cape Fear arch is an upwarped dome limited to the Coastal Plain northwest of their NNESSW-oriented Fountains Creek fault (Fig. 3b). More recent studies suggest that some of the uplift along the Cape Fear arch might be from mantle upwelling (e.g., Rowley et al. 2013; Liu 2015; Rovere et al. 2015). Wagner et al. (2018) interpreted a downward deflection and delamination of the mantle lithosphere beneath the Cape Fear arch, but could not determine if this anomaly is causing the uplift along the arch. Our results suggest that late Cenozoic deformation along the interpreted Faison and Neuse faults may be largely responsible for Quaternary uplift along the Cape Fear arch, although past deformation along faults associated with the other LiDAR lineaments (e.g., Livingston Creek, White Marsh, and Tomahawk lineaments) and previously mapped Cenozoic faults in southeastern North Carolina may have also contributed to the formation of the arch.
 Display large image of Figure 3a
 Display large image of Figure 3b
Previously mapped faults across the cape Fear arch
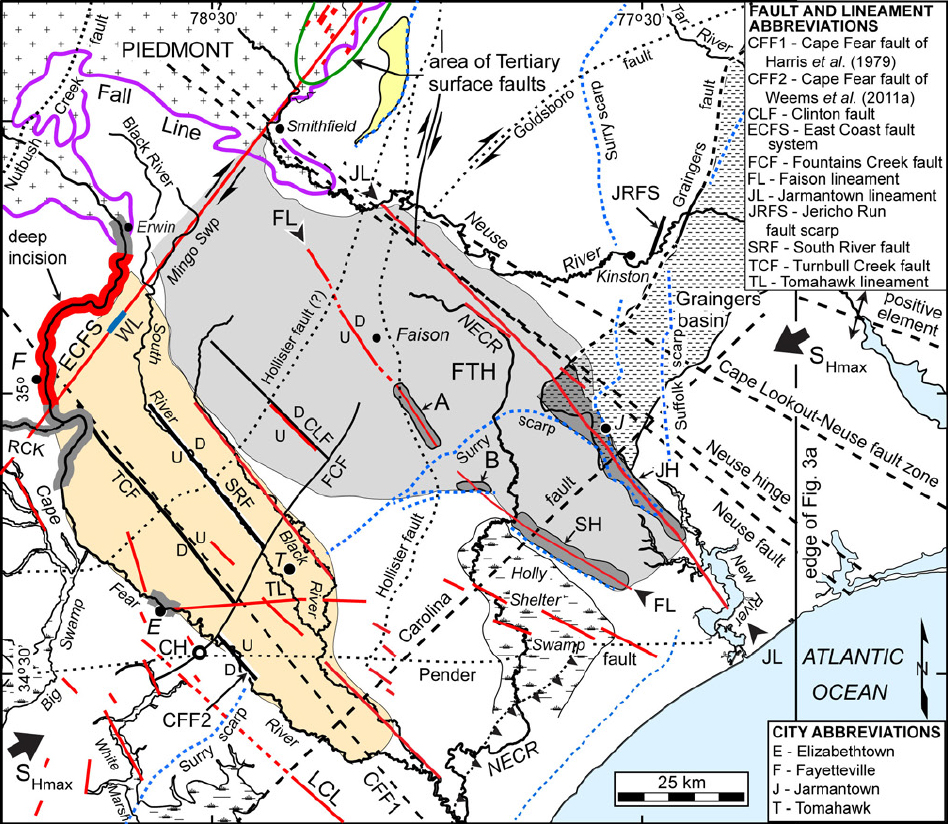
3 One of the most studied faults in eastern North Carolina is the NE-SW-oriented Graingers fault or wrench zone east of Kinston that coincides with the northwestern edge of the Precambrian to Paleozoic Graingers basin or synform in the pre-Cretaceous basement (Brown et al. 1977; Daniels and Zietz 1978; Fig. 3b). The Graingers fault zone consists of NE-SW-oriented sinistral en echelon wrench faults that bound a series of NE-plunging grabens, half-grabens, and a central horst (Brown et al. 1977). Lawrence and Hoffman (1993) interpreted the Graingers fault zone to be a splay of the Paleozoic Roanoke Island-Goldsboro dextral strike-slip fault in the basement (Fig. 3b). West of the Graingers fault zone is the ~10-km-long, east-facing Jericho Run fault scarp (Brown et al. 1977; Fig. 3b), which appears to have undergone Holocene deformation (McLaurin and Harris 2001). Other evidence of Quaternary deformation along the Graingers fault zone and Jericho Run fault scarp have been documented (e.g., Brown et al. 1982).
4 Near the Neuse River is a commonly cited NW-SE-oriented fault, the name and location of which has been controversial. It was first interpreted by Ferenczi (1959) who named it the Cape Lookout-Neuse fault (Fig. 3b). It was later referred to as a “positive element” by Gibson (1967, 1970) and the Neuse fault by Baum et al. (1978) (Fig. 3b). Harris and Laws (1997) later interpreted a down-tothe-north monoclinal basement flexure south of the Neuse River they named the Neuse hinge (Fig. 3b). In contrast to these studies, Ebasco Services (1983) and Progress Energy Carolinas, Inc. (2008) concluded that the Neuse fault does not exist based on a lack of evidence. Our results support the existence of the Neuse fault along the Jarmantown lineament.
5 Farther southwest is the NW-SE-oriented, NE-side-up Cape Fear fault that was first interpreted by Harris et al. (1979) (Fig. 3b). Weems et al. (2011a, 2011b) later postulated that the Cape Fear fault is a southwest-dipping hinge zone southeast of their interpreted Fountains Creek fault (Fig. 3b). Weems et al. (2011a, 2011b) interpreted three other NW-SE-oriented faults northwest of their Fountains Creek fault that cut through the Upper Cretaceous sedimentary formations beneath the Coastal Plain sediments−the Clinton, Turnbull Creek, and South River faults (Fig. 3b).
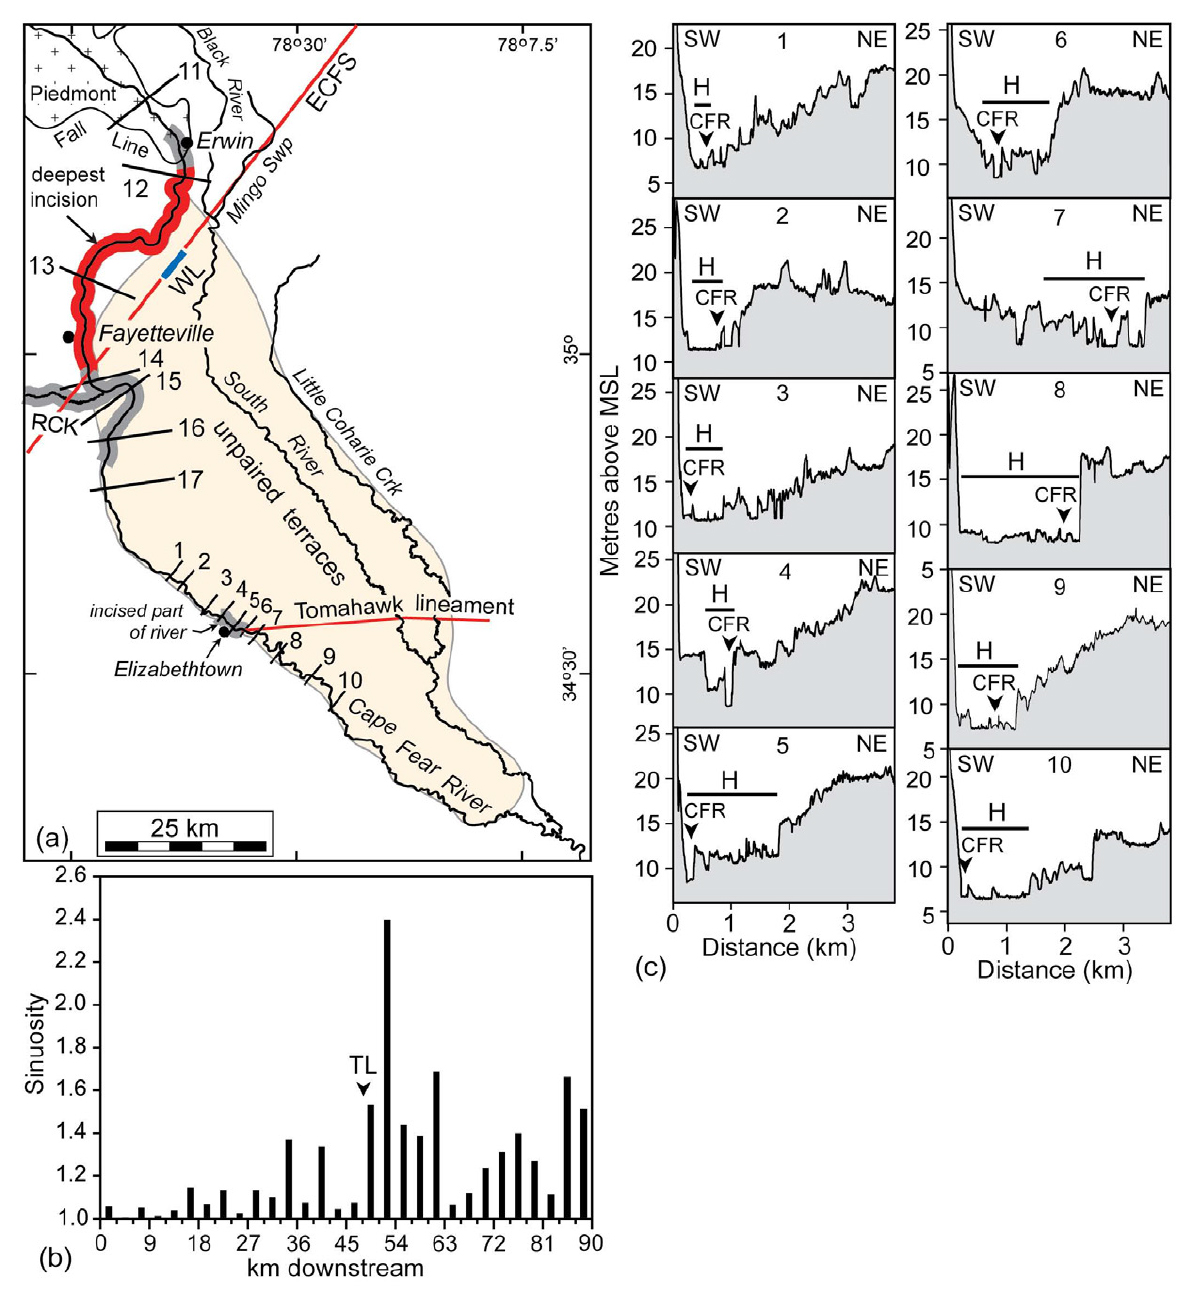
6 Crossing the middle Coastal Plain of North Carolina and near the western edge of the Cape Fear arch is a NESW-oriented fault or flexure first interpreted by Soller (1984, 1988). Marple and Talwani (2000) later interpreted this feature to be the central segment of the East Coast fault system (ECFS) based on the alignment of the large meander in the Cape Fear River southeast of Fayetteville, the right-angle bend in the Neuse River near Smithfield, and Tertiary surface faults northeast of Smithfield (Prowell 1983; Marple and Talwani 2000, Geological Society of America data repository number 200012, fig. DR7) (Fig. 3b). Marple and Talwani (2000) interpreted the ECFS to be a dextral strike-slip fault system along which Quaternary uplift from the Cape Fear arch terminates to the west. A ~320-m dextral offset in a Pleistocene paleobarrier deposit northeast of Summerville, South Carolina (Marple and Hurd 2020, fig. 12), supports this hypothesis. Uplift along the ECFS near Fayetteville began at least 750 ka and reached its maximum during the Holocene, causing the Cape Fear River and its tributary Rockfish Creek to incise deeply into the underlying Upper Cretaceous formations near the trend of the ECFS (Soller 1988; Marple and Talwani 2000). The deep incision and absence of a Holocene floodplain along the Cape Fear River near Fayetteville and locally uplifted Pliocene–Pleistocene fluvial terraces to the northeast (Soller 1988) indicate that the ECFS near Fayetteville is currently undergoing relatively rapid uplift. Soller (1988) determined that Late Pleistocene uplift rates near Fayetteville are significantly greater than elsewhere across the Cape Fear arch. Our results suggest that the ECFS near Fayetteville is located northwest of the Cape Fear River meander, thereby making it continuous with the ECFS in northeastern South Carolina where it forms a ~15° restraining bend in the fault system.
7 Closer to the coast, LeGrand (1955) and Ferenczi (1959) interpreted a NE-SW-oriented fault zone based on saltwater incursion near the confluence of the Cape Fear and Black rivers and its alignment with the eastern side of the Graingers basin to the northeast (Fig. 3b). Baum et al. (1978) named this feature the Carolina fault (Fig. 3b).
8 Based on an analysis of Pleistocene shorelines and river deflections in the Coastal Plain of the southeastern United States, Bartholomew and Rich (2012) interpreted several potentially active faults in the Coastal Plain, including their Cape Fear, Cape Lookout, and Cape Hatteras faults that trend WNW-ESE across the North Carolina Coastal Plain. They also hypothesized that the ECFS does not exist based on their interpretation that the NNE-convex curves in the Santee, Black, and Lynches rivers, which help to define the location of the ECFS in South Carolina (Marple and Talwani 2000, fig. 3), were produced by early to middle Pleistocene migration of these rivers to the northeast because of down-to-the-southwest displacements along their interpreted Cape Fear fault near the South Carolina-North Carolina border, rather than by down-to-the-north-northeast tilting along the buried ECFS as postulated by Marple and Talwani (2000). However, the decreasing age of fluvial terraces to the southwest along the northeast sides of the lower Pee Dee River valley and along the NW-SE-oriented part of the Little Pee Dee River valley in northeastern South Carolina (Owens 1989) clearly shows that northeastern South Carolina underwent Pleistocene down-to-the-southwest tilting by uplift from the Cape Fear arch, which would not have favored northeast migration of streams in northeastern South Carolina during the Pleistocene. Profile 1 in Figure 2 clearly shows this down-to-the-southwest cross-valley tilt. Marple and Talwani (2000, pp. 208–209) evaluated other nontectonic mechanisms to explain these anomalous river curves, including bay mouth shifting from Pleistocene longshore drift to the southwest and differential erosion, none of which can explain these river curves. Secondly, the channel along the Lynches River curve is presently incised below its floodplain and is eroding northeastward toward the Cape Fear arch and into the massive, late Cretaceous Peedee Formation along its northeastern valley wall, which is more resistant than the unconsolidated sediments of the early Pleistocene Waccamaw Formation along the south side of its curve (Marple and Talwani 2000, fig. 13). Furthermore, there is no subsurface evidence for a basin or Cape Fear fault near the North Carolina-South Carolina border. In contrast to Bartholomew and Rich’s (2012) study, Marple and Talwani (2000) presented subsurface evidence for a buried fault zone along the river curves, including buried faults interpreted from seismic-reflection profiles and uplifted stratigraphy. Thus, a down-to-thenorth-northeast tilt from Quaternary deformation along the buried ECFS (Marple and Talwani 2000) remains the best explanation for the river curves along the ZRA.
9 Paleozoic faults have also been interpreted in the pre-Cretaceous basement beneath the North Carolina Coastal Plain based mainly on aeromagnetic and seismic-reflection data. The E-W-oriented Pender fault (Fig. 3b) separates the Charleston terrane to the south from the Spring Hope and Roanoke Rapids terranes to the north (Lawrence and Hoffman 1993). North of the Pender fault are the N-S-oriented Nutbush Creek and Hollister faults in the eastern Piedmont that continue southward beneath the Coastal Plain (Lawrence and Hoffman 1993) (Fig. 3b). East of the Hollister fault is the ENE-WSW-oriented Roanoke Island-Goldsboro dextral fault (Fig. 3b).
10 Our two main goals were to search for further evidence of the ECFS in North Carolina and to identify potentially active faults across the Cape Fear arch using primarily LiDAR (Light Detection and Ranging) data. Our results revealed the 110- to 115-km-long, NW-SE-oriented Faison and Jarmantown lineaments between the Cape Fear and Neuse river valleys (Fig. 3b) that we hypothesize are surface expressions of SW-dipping faults. Up-to-the-SW reverse- or thrust-style displacements along these faults may be largely responsible for Quaternary uplift along the Cape Fear arch. Numerous other lineaments (e.g., Livingston Creek, White Marsh, and Tomahawk lineaments) cross the southern flank of the Cape Fear arch, suggesting that the arch is structurally complex. Our results also support the existence of the ECFS in North Carolina and that it forms a 15° restraining bend in northeastern South Carolina.
METHODOLOGY
11 The LiDAR data that we used for North Carolina were acquired as part of the North Carolina Floodplain Mapping Program (NCFMP) in 2014 and 2015 by Quantum Spatial, Inc. (NOAA Office for Coastal Management 2015). Point data were collected at a nominal pulse spacing of 0.7–1.5 m. Project specifications were based on the United States Geological Survey National Geospatial Program Base LiDAR Specification, version 1. The data were developed based on the horizontal projection/datum NAD83 of the North Carolina State Plane Coordinate System and vertical datum NAVD1988 (GEOID12A). The LiDAR data were gathered in RAW flight line swath format and converted to Classified LAS 1.4 files formatted to 5000 ft (~1500 m) × 5000 ft tiles that we used to derive Bare Earth digital elevation models (DEM) at a 5 foot (~1.5 m) spatial resolution. We downloaded DEM tiles by county from the NOAA (National Oceanic and Atmospheric Administration) Digital Coast website and then mosaicked them into individual areas of interest. The LiDAR data that we used for northeastern South Carolina were acquired in 2008 and 2009 with a 3 m spatial resolution (DNR 2019) and processed similar to the North Carolina data.
12 We used the Hillshade tool of ArcGIS to generate shaded relief images from the DEM data using various illumination azimuths, an elevation angle of 25°, and a vertical exaggeration of 10X to enhance subtle geomorphic features. A major advantage of the large vertical exaggeration and illumination of the LiDAR data from different directions is that they help to identify subtle geomorphic features produced by gentle, long-term, late Cenozoic deformation in intraplate settings that would otherwise be difficult to detect using conventional aerial photos, satellite images, and topographic maps. Color relief images were then generated using a color scheme based on elevations of the terrain. Basic contrast enhancement routines of Adobe Photoshop were used to digitally enhance the LiDAR images. Low contrast images were enhanced further using the intensity-hue-saturation (IHS) routine. We also used the LiDAR data to construct detailed topographic profiles to quantify elevation changes across selected geomorphic features. We also sought angular stream bends, changes in sinuosity, and locally increased river incision that could be related to Quaternary deformation along faults. Angular stream bends in the Coastal Plain of the Carolinas are especially anomalous since they are formed in the soft unconsolidated sediments where dendritic drainage patterns are favored (Marple and Hurd 2020).
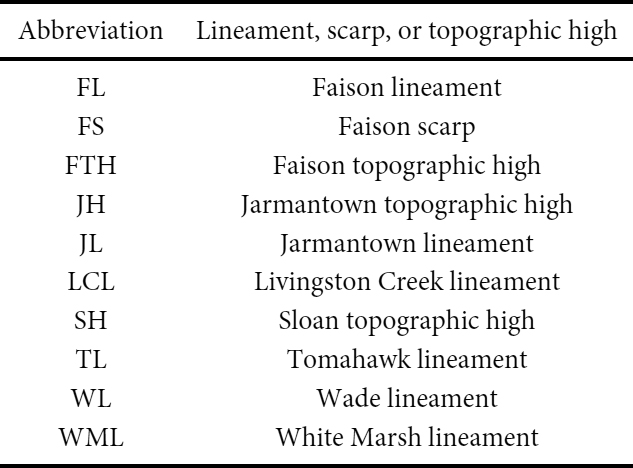
13 We calculated sinuosities (ratio of channel length to valley length) along the Cape Fear River downstream from the large meander near Fayetteville to investigate a local area of increased incision near Elizabethtown. The sinuosities were calculated based on equal-length valley segments along the Cape Fear River that were at least twice the average meander wavelength of the channel, which we determined to be 3 km. Lineaments were compared to conventional topographic and geologic maps at various scales to identify potential faults. Tables 1 and 2 show the abbreviations of faults, scarps, lineaments, and topographic highs shown on figures.

GEOLOGY OF THE CAPE FEAR ARCH
Geomorphology
14 Gentle uplift of the Coastal Plain and transgressive-regressive cycles caused by glacioeustatic sea level fluctuations across the Cape Fear arch during the Cenozoic era (Cronin 1981) have produced a series of emergent marine terraces that are best preserved and youngest toward the coast. Terrace landforms include estuarine plains, back-barrier marshes, lagoonal deposits, and sandy barrier island ridges (Owens 1989; Colquhoun et al. 1991; Soller and Mills 1991). The terraces are bounded on the seaward side by eroded paleoshoreline scarps, such as the Surry and Suffolk scarps (Cronin et al. 1984; Owens 1989; Ator et al. 2005; Willoughby et al. 2005). These various landforms curve eastward around the Cape Fear arch and the Sloan and Jarmantown topographic highs interpreted herein (Figs. 3a and 3b).
15 Another common landform in the Coastal Plain of the Carolinas are Carolina bays. Carolina bays are shallow, NWSE-oriented, elliptically-shaped depressions of varying sizes, commonly occupied by ponds and wetlands. They were produced by winds varying from the northwest to southwest between 100 and 200 ka and commonly have elevated rims composed of fine sand to gravel that were deposited by high-energy, lacustrine shoreface and eolian processes (Soller 1988; Moore et al. 2016).
16 The predominant drainage pattern in the Coastal Plain of the Carolinas is dendritic, although linear drainage patterns are common along the predominantly NE-SW-oriented, Pliocene–Pleistocene barrier island deposits. The largest rivers traversing the study area are the Pee Dee, Cape Fear, and Neuse rivers (Fig. 1). The lower Cape Fear and Pee Dee river valleys on the southern flank of the Cape Fear arch display a down-to-the-southwest cross-valley tilt with unpaired Pliocene–Pleistocene fluvial terraces that decrease in age to the southwest (Owens 1989; Soller and Mills 1991) (Figs. 2 and 3b). The terrace ages along the lower Cape Fear River are: 2.75 Ma (Bear Bluff), 1.75 Ma (Waccamaw), 750 ka (Penholoway), 200 ka (Socastee), and 100 ka (Wando) (Soller 1988). The southwestward river migration and downcutting that produced these terraces are from late Cenozoic uplift along the Cape Fear arch axis to the northeast along the Cape Fear-Neuse river divide (Soller 1988). The ancestral Pee Dee River offshore from South Carolina also migrated southwestward away from the Cape Fear arch axis beginning during the late Pliocene as result of barrier-island deposition during sea-level high-stands and uplift from the Cape Fear arch to the northeast (Baldwin et al. 2006).
Bedrock and subsurface sediments
17 Fluvial processes and glacioeustatic sea level fluctuations across the Cape Fear arch during the late Cretaceous and Cenozoic have produced a coastward thickening wedge of southeast-dipping, Late Cretaceous and younger sediments and sedimentary rocks that unconformably overlie a coastward-dipping pre-Cretaceous basement (Gohn 1988). The Late Cretaceous strata consist primarily of silty clay, carbonaceous clay, and coarse-grained sand associated with delta plain sediments of the Cape Fear and Middendorf formations, delta marginal barrier and prodelta shelf sediments of the Lower Black Creek Formation, prodelta shelf sediments of the Upper Black Creek and Lower Peedee formations, and shelf deposits of the Upper Peedee Formation (Gohn 1988; Owens 1989).
18 The pre-Cretaceous basement across the Cape Fear arch consists of Paleozoic metamorphic rocks of the Charleston, Roanoke Rapids, and Spring Hope terranes, and igneous and metamorphic rocks of the Hatteras belt near the coast (Lawrence and Hoffman 1993). The Charleston, Roanoke Rapids, and Spring Hope terranes consist primarily of slaty to schistose metamorphosed mafic, intermediate, and felsic tuffs and flows, volcaniclastic mudstones, siltstone, and sandstones, and minor quartzite (Lawrence and Hoffman 1993). The Hatteras belt consists of large granitic batholiths that are bounded to the west by amphibolite facies rocks (Horton et al. 1989; Lawrence and Hoffman 1993). Although no early Mesozoic rift basins have been identified across the Cape Fear arch (Manspeizer and Cousminer 1988), a large negative aeromagnetic anomaly east of Kinston (Daniels and Zietz 1978) revealed the NE-SW-oriented, ~20-kmwide Precambrian to Paleozoic Graingers basin or synform in the pre-Cretaceous basement (Fig. 3b) that contains up to 7000 ft (~2100 m) of low-gradient greenschist facies phyllite (Sampair 1979).
Uplift history of the Cape Fear arch
19 Intermittent tectonic uplift along the Cape Fear arch during the Late Cretaceous and Cenozoic uplifted the Late Cretaceous strata beneath the Coastal Plain of the Carolinas, causing them to be relatively thin near the arch axis and thicker down the flanks of the arch (Gohn 1988). This uplift has resulted in the only extensive outcrops of Late Cretaceous rocks in the southeastern United States Atlantic Coastal Plain (Gohn 1988). Paleogene sediments are absent across the arch, except for the limestones of the Middle Eocene to Lower Miocene Castle Hayne, River Bend, and Belgrade formations beneath the outer Coastal Plain east of the Northeast Cape Fear River (Ward et al. 1978; North Carolina Geological Survey 1985).
20 Uplift along the Cape Fear arch during the past 3 Ma appears to be continuing through the present (Winker and Howard 1977; Brown 1978; Zullo and Harris 1979; Soller 1988; Van de Plassche et al. 2014). Unpaired Pliocene– Pleistocene fluvial terraces (Fig. 3a) (Soller 1988; Owens 1989) and a NW-SE-oriented flexure in the pre-Cretaceous basement surface (Popenoe and Zietz 1977; Soller 1988, fig. 4b) northeast of the lower Cape Fear River valley suggest that the main source of Quaternary uplift along the Cape Fear arch originates along a NW-SE-oriented structure(s) beneath the Cape Fear-Neuse river divide.
LIDAR OBSERVATIONS
21 LiDAR images of the Cape Fear arch revealed numerous, mostly NW-SE-oriented lineaments across the arch, as well as further evidence for the ECFS. Elevation profiles constructed from the LiDAR data suggest that the ECFS near Fayetteville, North Carolina, is farther to the northwest than previously reported. These lineaments, the ECFS, and other selected geomorphic features are described further in the following sections.
Regional topographic profiles across the Cape Fear arch
22 Regional topographic profiles generated from the LiDAR data (Figs. 1 and 2) revealed that the terrain across the Cape Fear arch is highest in the middle Coastal Plain between the lower Cape Fear and Neuse rivers (Fig. 2, profiles 1 and 2) and between the Sloan and Jarmantown topographic highs (described in the next two sections) in the outer Coastal Plain (Fig. 2, profile 3), which we have named the Faison topographic high (Fig. 3b). The Faison high is visible in Figure 3a as the red to tan colors in the middle Coastal Plain between the Cape Fear and Neuse river valleys. The Faison high narrows in the outer Coastal Plain where it is visible as the darker green color between Holly Shelter Swamp and the New River. The profiles also show the Pliocene– Pleistocene down-to-the-SW cross valley tilt of the lower Cape Fear and Pee Dee river valleys away from the arch axis to the northeast. In contrast to the Cape Fear and Pee Dee river valleys, the Neuse and Tar river valleys on the northern flank of the arch generally lack a cross-valley tilt northeastward away from the arch axis.
Faison lineament and scarp
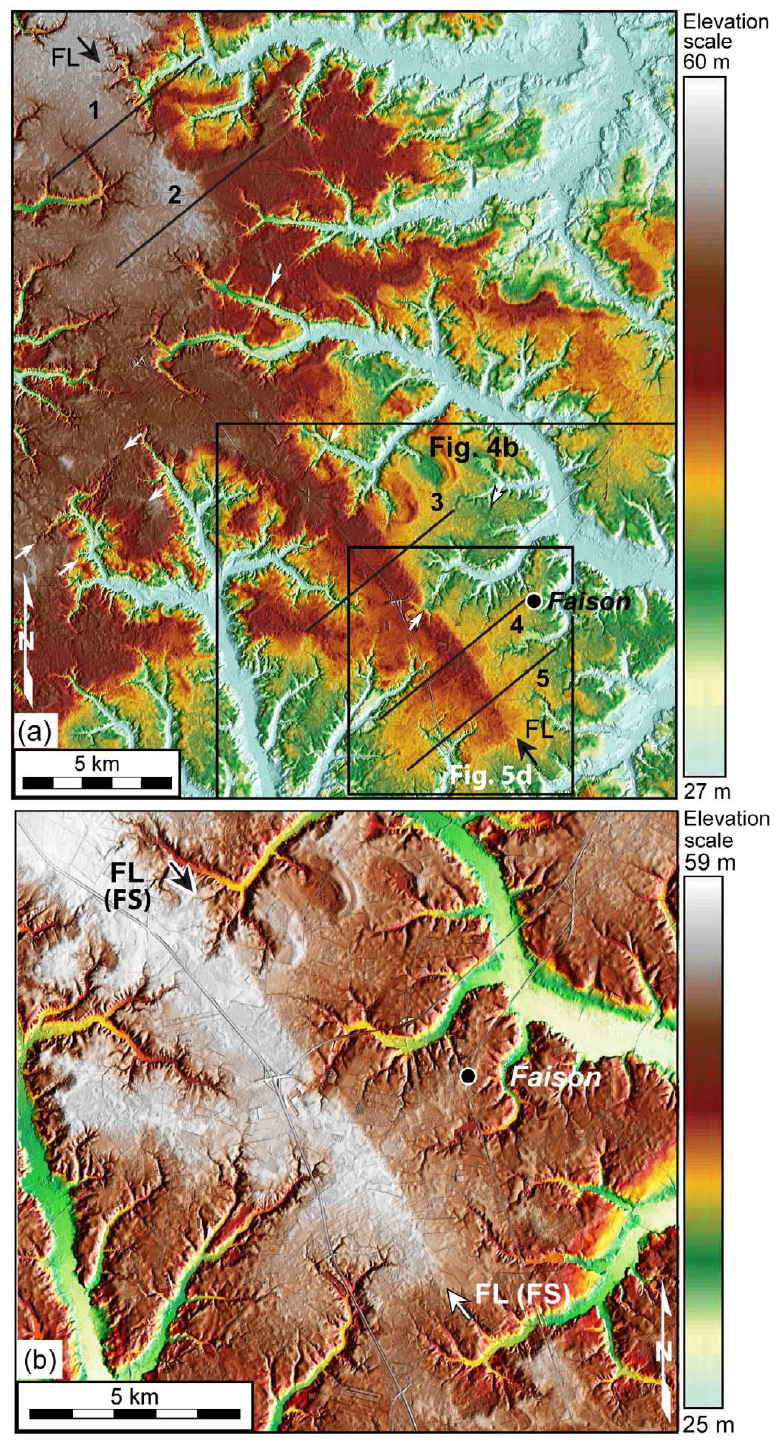
23 Near Faison, North Carolina, is a subtle, discontinuous, ~110-km-long, NW-SE-oriented lineament, herein named the Faison lineament (Figs. 3 and 4), that crosses the middle and outer Coastal Plain provinces and the Upper Cretaceous Black Creek and Peedee formations and the Middle Eocene to Lower Miocene Castle Hayne and River Bend formations (North Carolina Geological Survey 1985) beneath the Coastal Plain sediments. The Faison lineament northwest of the Surry paleoshoreline scarp coincides with the drainage divide between the Cape Fear and Neuse rivers where most streams drain northeast or southwest away from the lineament (Figs. 3a and 4). The lineament northwest of Faison also coincides with two gently sloping, NE-facing, 2- to 4-m-high scarps that we collectively refer to as the Faison scarp (Figs. 4 and 5a). The ~1.5-km-wide area along the west side of the Faison scarp is 2–3 m higher than the surrounding terrain. Crossing the lineament southwest of Faison is an eroded, NE-SW-oriented beach ridge of unknown age that is vertically offset up-to-the-southwest ~2.5 m where it crosses this scarp (Figs. 5b–5d).
 Display large image of Figure 4
 Display large image of Figure 5
24 To the southeast, where the sedimentary wedge beneath the outer Coastal Plain is thicker, the Faison lineament coincides with two areas that are topographically higher than the surrounding terrain (Fig. 3b, dark grey patterns labeled A and B). Area A forms a local drainage divide along the lineament and area B is an elevated part of a Pleistocene beach ridge along the landward side of a paleoshoreline scarp that is ~10 m higher than along the same beach ridge deposit ~10 km to the southwest. Southeast of area B the Faison lineament bends ~24° counterclockwise in the outer Coastal Plain along a linear, ~30-km-long, 3- to 5-km-wide topographically high area, herein named the Sloan high (Fig. 3b), that is up to 15 m higher than the surrounding terrain (Fig. 2, profiles 2 and 3). Tributaries of the Northeast Cape Fear River form linear drainages along both sides of the Sloan high (Figs. 3a and 3b). An unnamed NE-SW-oriented Pleistocene paleoshoreline scarp turns abruptly to the southeast along the southwest side of the Sloan high (Figs. 3a and 3b).
Jarmantown lineament
25 Northeast of the Faison lineament and crossing the middle and outer Coastal Plain provinces are several geomorphic features that define the ~115-km-long Jarmantown lineament (Fig. 3b). The most prominent geomorphic feature defining this lineament is a linear, ~28-km-long, 3- to 7-km-wide, NW-SE-oriented topographically high area in the Coastal Plain, herein named the Jarmantown high, that is up to 15 m higher than the surrounding terrain (Fig. 2, profiles 2 and 3, and Figs. 3a and 3b). The New River and some of its tributaries have developed a linear, NW-SE-oriented drainage pattern along both sides of the Jarmantown high near the coast (Figs. 3a and 3b). The Pleistocene Surry paleoshoreline scarp is sharply deflected at least 20 km around the Jarmantown high (Fig. 3b). The Precambrian to Paleozoic Graingers basin or synform in the pre-Cretaceous basement ends abruptly to the southwest along the Jarmantown high (Fig. 6). The topographic high continues to the northwest where it curves around the NWSE-oriented segment of the upper Northeast Cape Fear River (Fig. 2, profiles 1 and 2, Fig. 3a, arrow labeled N, and Fig. 3b). The Jarmantown lineament crosses the NE-SW-oriented belts of Upper Cretaceous Black Creek and Peedee formations and the Middle Eocene to Lower Miocene Castle Hayne, River Bend, and Belgrade formations (North Carolina Geological Survey 1985) beneath the Coastal Plain sediments. Along the northwest projection of the Jarmantown high is an abrupt narrowing of the Neuse River valley where it is locally underlain by a late Proterozoic to Cambrian felsic metavolcanic bedrock unit CZfv (Fig. 3a, location V) that is normally found to the northwest in the eastern Piedmont (North Carolina Geological Survey 1985).
 Display large image of Figure 6
Tomahawk lineament
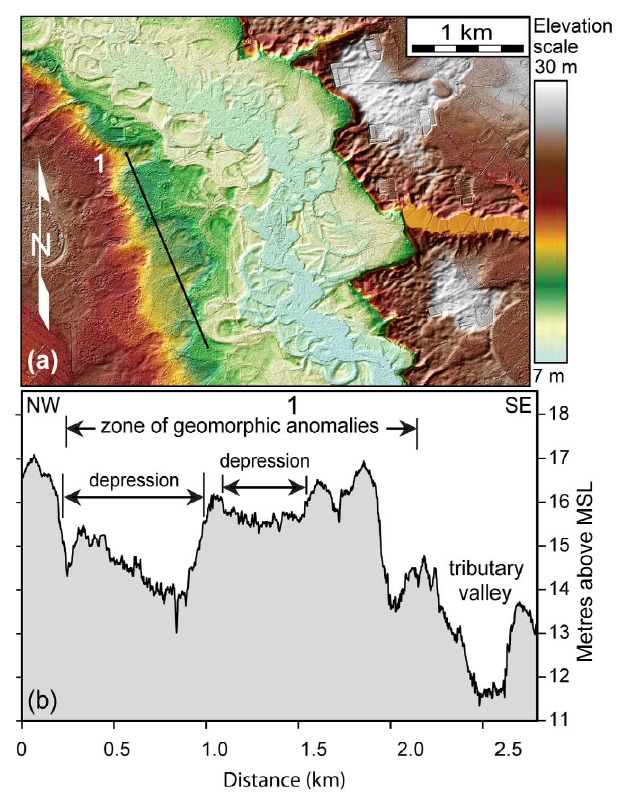
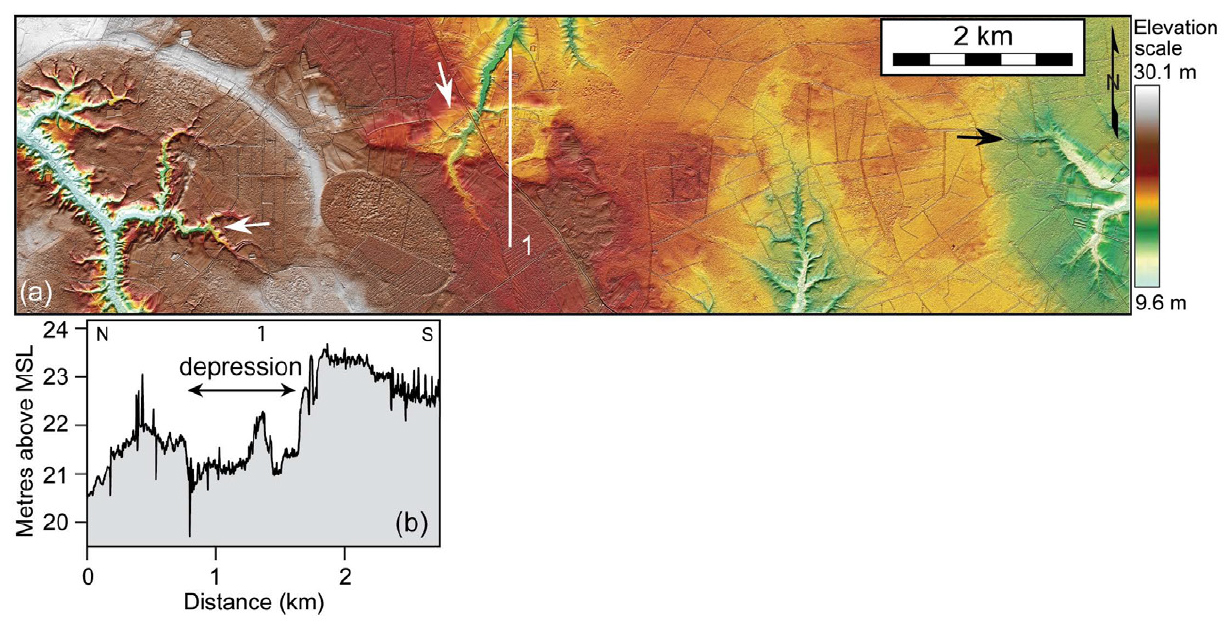
26 Northeast of Elizabethtown, North Carolina, is a ~1.5-km-wide zone of geomorphic features that define a ~50-km-long, ENE-WSW-oriented lineament in the outer Coastal Plain, herein named the Tomahawk lineament, that crosses the Pliocene–Pleistocene fluvial terraces along the northeastern side of the lower Cape Fear River valley (Fig. 3b) and the NE-SW-oriented belts of Upper Cretaceous Black Creek and Peedee formations (North Carolina Geological Survey 1985) beneath the Coastal Plain sediments. The most prominent feature along this lineament is an anomalous rectangular-shaped part of the northeastern valley wall of the South River south of Tomahawk (Fig. 7a) that is developed within the late Pliocene Bear Bluff fluvial terrace and the underlying Upper Cretaceous Bladen Formation (intercalated thin dark clays and light sands) of Owens (1989). Southwest of this area is a ~1.5-km-wide zone of shallow, NE-SW-oriented, 1.2- to 1.4-km-long, 500- to 800-m-wide, 1- to 3-m-deep linear depressions (Figs. 7a and 7b). The projection of this ENE-WSW trend to the southwest coincides with several anomalous changes in the Cape Fear River valley near Elizabethtown. A ~6-km-long reach of the Cape Fear River near Elizabethtown is incised up to 4 m more than that upstream or downstream (Figs. 8a and 8c, profiles 4–6). Downstream from this part of the river, the channel sinuosity increases (Figs. 8a and 8b) and the Holocene valley widens up to 1.5 km more than that upstream (Fig. 8c, profiles 5–10).
 Display large image of Figure 7
 Display large image of Figure 8
27 East of the South River is a ~1.5-km-wide zone of E-W-oriented geomorphic features that define the eastern end of the Tomahawk lineament, including small, E-W-oriented angular bends in streams and a shallow, 1- to 2-m-deep, E-W-oriented, ~2-km-long, ~800-m-wide, triangular-shaped depression (Fig. 9). The Tomahawk lineament parallels the Paleozoic Pender fault at depth in the pre-Cretaceous basement ~12 km to the south (Fig. 3b).
 Display large image of Figure 9
Livingston Creek and White Marsh lineaments
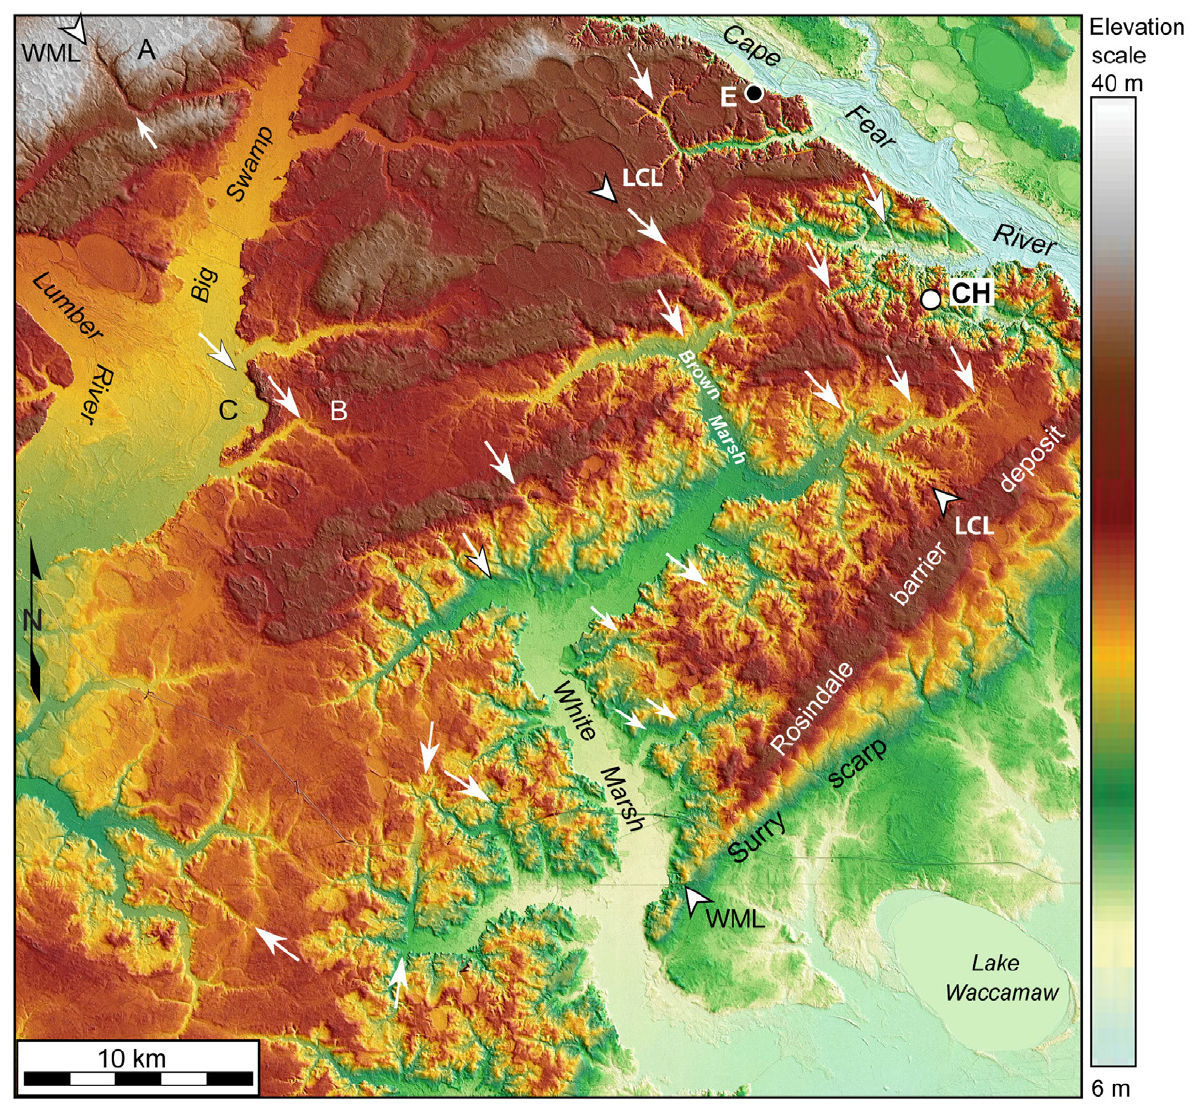
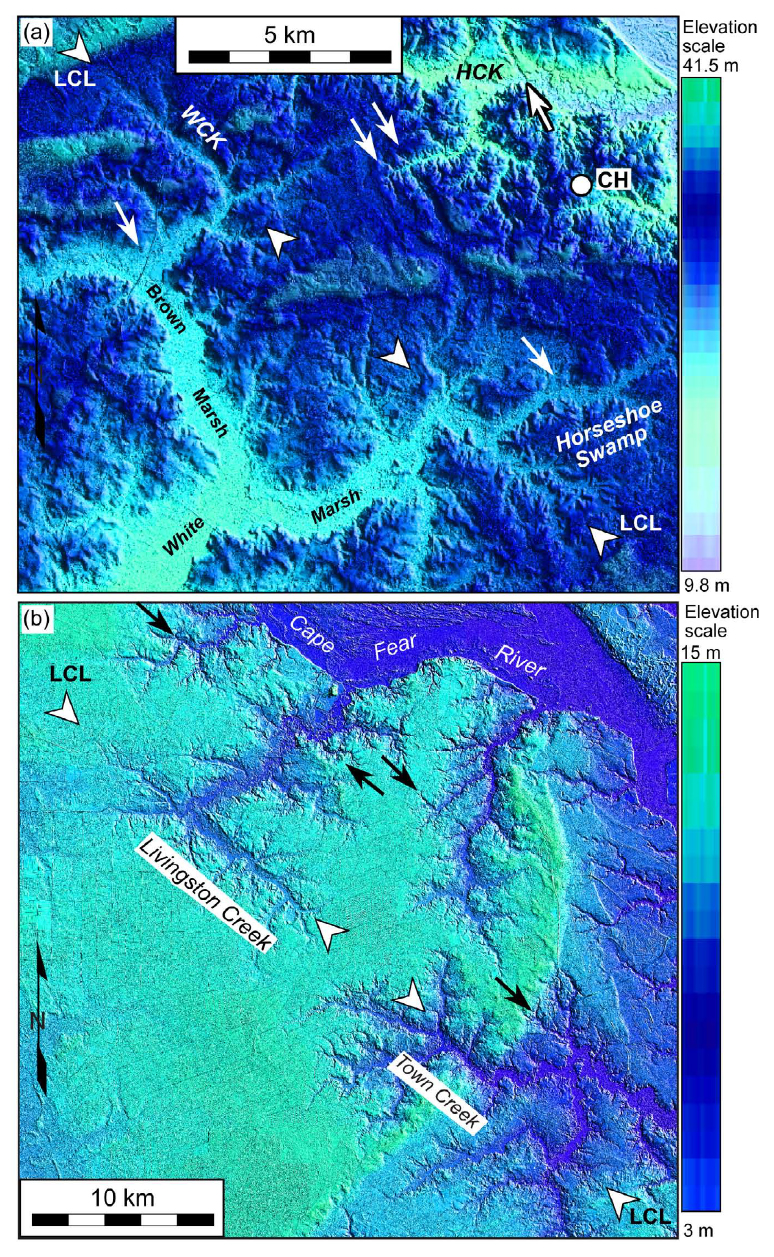
28 Numeous NW-SE-oriented angular stream bends were noted southwest of the Cape Fear River, some of which cross the NE-SW-oriented Rosindale barrier island deposit of the late Pliocene Bear Bluff Formation of Owens (1989) (Fig. 10). The most conspicuous angular stream bends occur along White Marsh and its tributaries east of the Lumber River valley where they are developed within the Bear Bluff Formation of Owens (1989) and the Upper Cretaceous Black Creek and Peedee formations (North Carolina Geological Survey 1985) beneath the Coastal Plain sediments (Fig. 10). The NW-SE-oriented stream bends along White Creek and Horseshoe Swamp are collinear with a conspicuous NW-SE-oriented bend in Livingston Creek (Fig. 3a, arrow labeled LC) and along Town Creek within the early Pleistocene barrier and backbarrier facies of the Penholoway Formation of Owens (1989) to the southeast (Figs. 10, 11a, and 11b). We have named this ~75-km-long trend the Livingston Creek lineament.
 Display large image of Figure 10
 Display large image of Figure 11
29 Southwest of the Livingston Creek lineament is a ~50-km-long, NW-SE-oriented lineament, the White Marsh lineament, formed by the alignment of the NW-SE-oriented segment of White Marsh where it crosses the Rosindale paleobarrier deposit (Owens 1989) and the NW-SE-oriented angular bends in the Tenmile and Jackson (Fig. 10, location A) swamps and Horsepen Branch (Fig. 10, location B) that drain into Big Swamp.
Other NW-SE-oriented lineaments
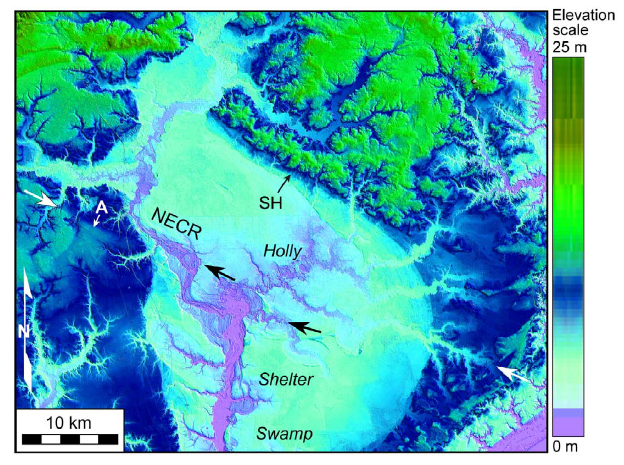
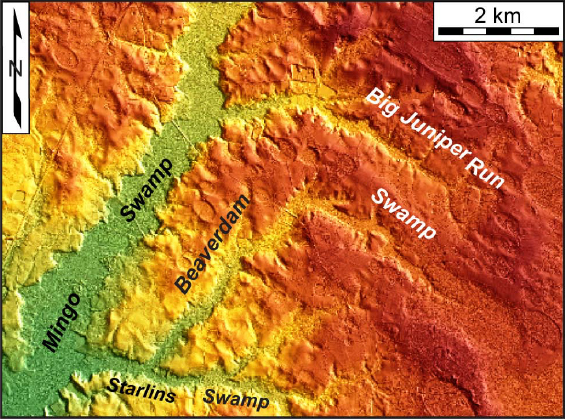
30 Other, mostly NW-SE-oriented rectilinear drainage patterns were interpreted across the Cape Fear arch in southeastern North Carolina. In the Holly Shelter Swamp is a NW-SE-oriented rectilinear drainage pattern associated with the Northeast Cape Fear River valley and its tributaries (Fig. 12). This rectilinear pattern parallels the Sloan high ~15 km to the northeast (Fig. 12) and crosses the Upper Cretaceous Peedee Formation and the Middle Eocene to Lower Miocene Castle Hayne and River Bend formations (North Carolina Geological Survey 1985) beneath the sediments of the outer Coastal Plain. Northwest of this rectilinear pattern is a short, ~4-km-long, ~2-m-high, gently sloping, NW-SE-oriented, NE-facing scarp (Fig. 12, site A). Approximately 70 km northwest of Holly Shelter Swamp and near the trend of right-angle stream bends associated with the ECFS is a conspicuous right-angle bend in Beaverdam Swamp that turns abruptly ~90° to the southeast (Figs. 3a, arrow labeled BD, and Fig. 13).
 Display large image of Figure 12
 Display large image of Figure 13
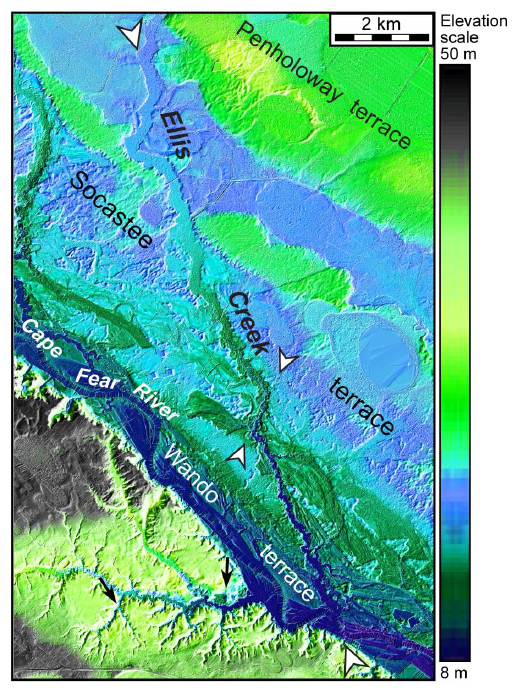
31 Northwest of Elizabethtown and crossing the unpaired late Pleistocene Socastee and Wando fluvial terraces in the lower Cape Fear River valley is a ~14-km-long, NWSE-oriented lineament formed by linear segments of Ellis Creek (Fig. 14). Near its southern end, Ellis Creek displays a ~400-m-wide right-step offset (Fig. 14). Northeast of the lower Cape Fear River valley is an abrupt northwest bend in Clinton Creek that coincides with part of the Clinton fault of Weems et al. (2011a) (Fig. 3a, arrow labeled CLC, and Fig. 3b).
 Display large image of Figure 14
New observations regarding the ECFS in North Carolina
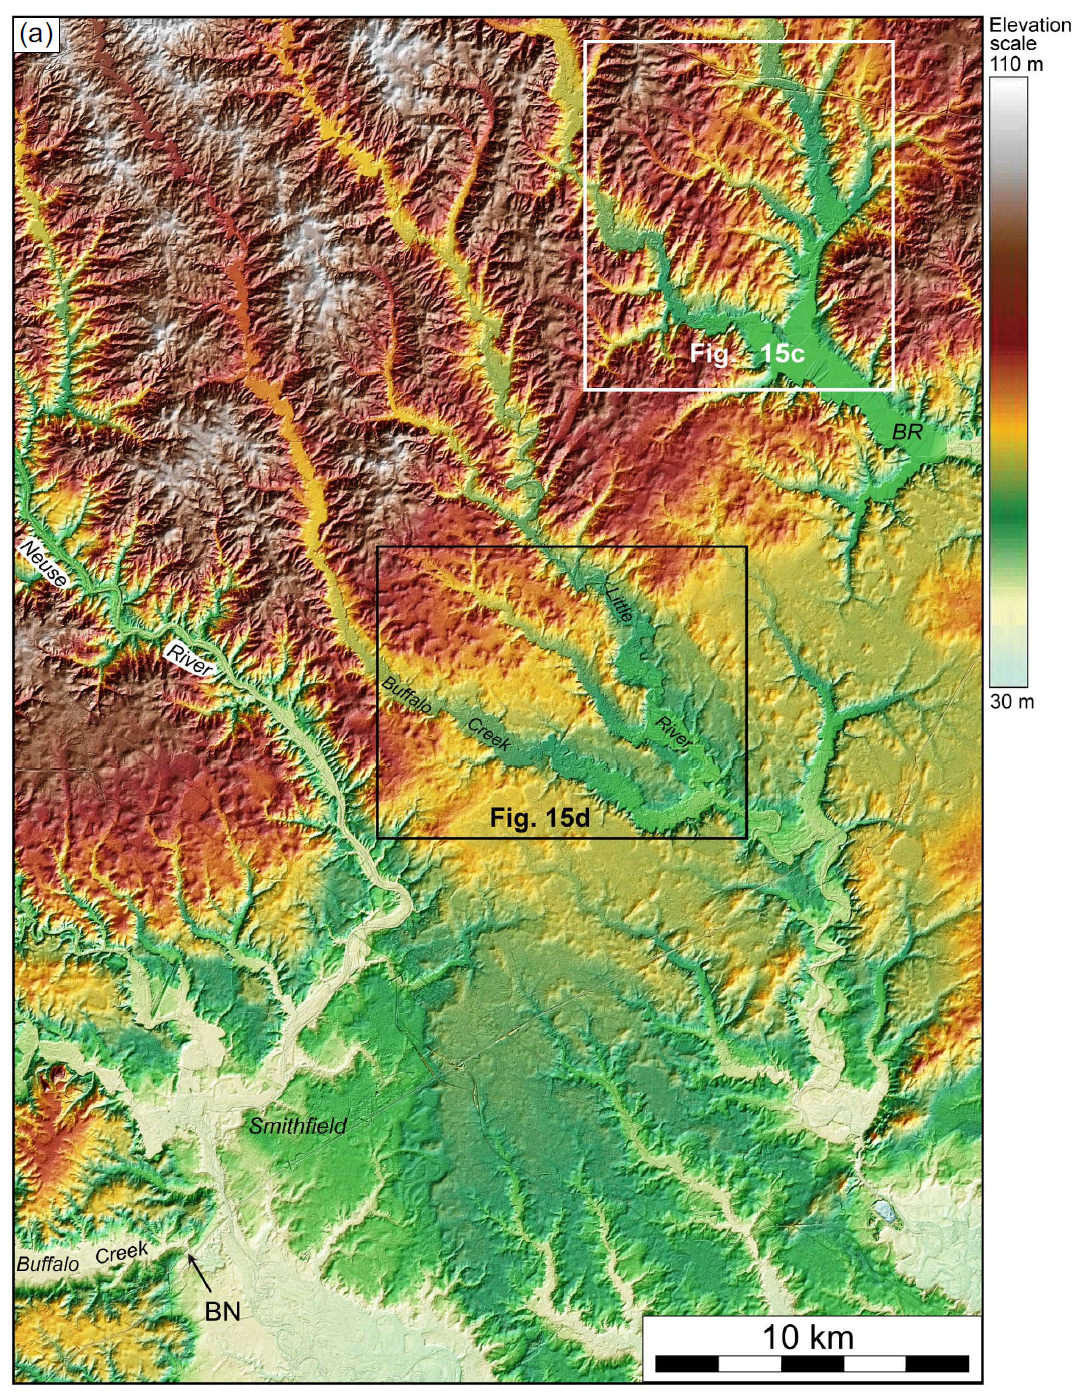
32 The LiDAR data also revealed a 3- to-5-km-wide zone of newly recognized geomorphic anomalies along the ECFS in North Carolina. Here, the general drainage pattern changes from a predominant NW-SE-oriented pattern in the Coastal Plain and eastern Piedmont to a NE-SW-oriented pattern along the ECFS between Fayetteville and the Neuse River (Figs. 1 and 3a). Approximately 20 km northeast of and collinear with the right-angle bend in the Neuse River, where the Coastal Plain sediments are only a few metres deep, is a ~5-km-wide zone of NE-SW-oriented linear depressions (Figs. 15a–15c) that are up to 15 m deep and 400 m wide (Fig. 15e). Several previously mapped Tertiary surface faults and a site of brecciated bedrock (Daniels et al. 1972; Prowell 1983) coincide with some of these depressions (Figs. 3b and 15b) (Table 3). A ~14-km-long linear boundary between bedrock units CZfv (felsic metavolcanic) and CZmd (metamudstone and meta-argillite) (North Carolina Geological Survey 1985) coincides with the zone of linear depressions northeast of the Neuse River (Fig. 15b).
 Display large image of Figure 15a
 Display large image of Table 3
33 Between the bend in the Neuse River and the zone of linear depressions are small angular bends in Buffalo Creek and Little River valleys (Figs. 15a and 15d, locations B and C). A linear, NE-SW-oriented, ~1-km-long, ~70-m-wide, 3- to 4-m-high topographic high intersects the north side of the angular bend in Buffalo Creek (Fig. 15d, location B). Approximately 2 km northeast of Little River is another linear, NE-SW-oriented, ~1.5-km-long, 50- to 80-m-wide, 3- to 4-m-high topographic high (Fig. 15d, location D). At location A, Buffalo Creek valley narrows abruptly along a low, west-facing scarp that crosses the northwest side of the narrowed part of the valley floor.
 Display large image of Figure 15 b–d
34 Another geomorphic anomaly near the trend of the ECFS and ~1.5 km south of the Neuse River where it bends ~90° to the southeast is an abrupt narrowing of Black Creek valley (Fig. 15a). Here, Black Creek crosses a ~2.5-km-long, ~40 ft (~12 m) high, southeast-facing scarp (Fig. 15a) before emptying into the Neuse River. Downstream from this location the Neuse River valley widens dramatically (Fig. 15a).
 Display large image of Figure 15e
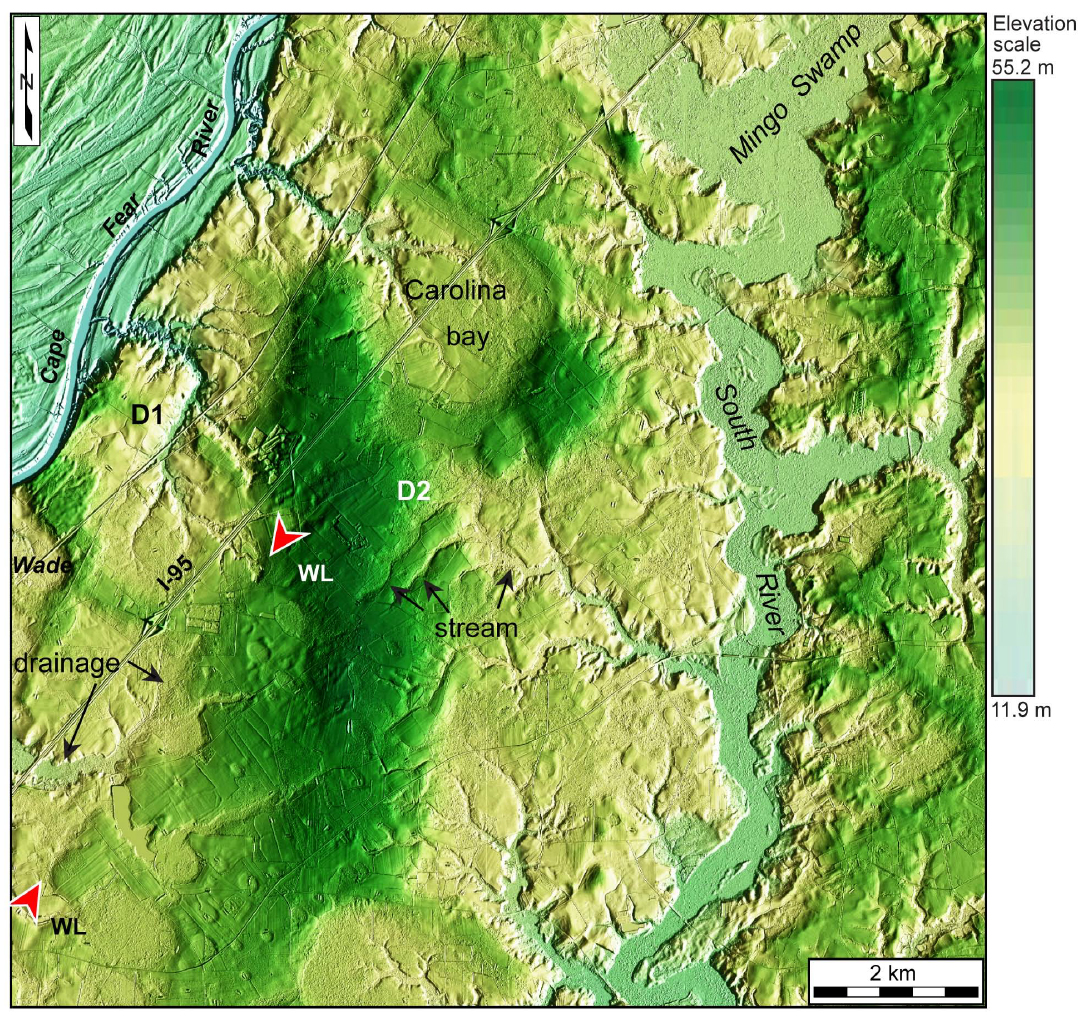
35 Southwest of the Neuse River bend and along the same trend is a ~5-km-wide zone of right-angle bends in Mingo Swamp, Hannah Creek, and Beaverdam Swamp (Fig. 3a). Southwest of Mingo Swamp is a subtle, ~5-km-long, 1- to 2-m-deep depression, herein named Wade lineament, that crosses the Pleistocene fluvial terrace C of Markewich (1985) in the lower Cape Fear River valley (Figs. 8a and 16). A small stream bends toward the northeast along part of the lineament. Two other small streams east and west of the Wade lineament bend to the southwest (Fig. 16, locations D1 and D2).
 Display large image of Figure 16
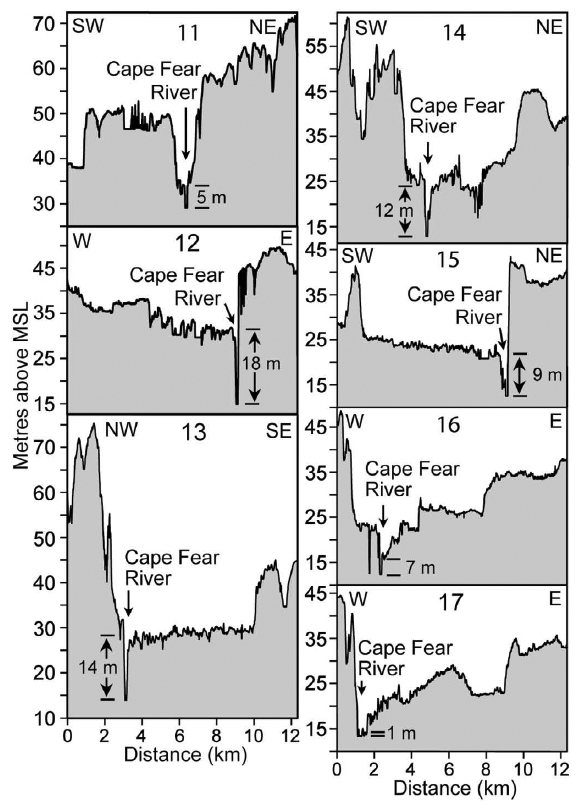
36 Just 2.5 km northwest of the Wade lineament is the most deeply incised part of the Cape Fear River (Fig. 8a). Elevation profiles constructed across the Cape Fear River near Fayetteville using the LiDAR data revealed that the greatest river incision occurs just upstream from the large meander to just south of Erwin (Figs. 8a and 17, thick red contour). Here there is no Holocene floodplain and the channel is downcutting through the late Cretaceous Cape Fear Formation (Owens 1989).
 Display large image of Figure 17
DISCUSSION
37 We evaluated various processes for the cause of the lineaments and rectilinear drainage patterns across the Cape Fear arch, including changes in lithology, jointing, dipping bedding planes, and Quaternary deformation along faults in the sedimentary rocks beneath the Coastal Plain sediments. We eliminated changes in lithology as a cause of the lineaments since they cross the various Coastal Plain provinces and the NE-SW-oriented Upper Cretaceous and Tertiary sedimentary formations beneath the Coastal Plain sediments (North Carolina Geological Survey 1985). Nor are they likely related to jointing in the Upper Cretaceous formations beneath the Coastal Plain sediments because no joint systems coincide with the lineaments. Furthermore, jointing would not cause increased river incision or changes in channel sinuosity like that observed along the Cape Fear River near Fayetteville and Elizabethtown (Figs. 8a, 8b, and 17). It is also unlikely that the lineaments developed along dipping bedding planes since the Upper Cretaceous sedimentary formations beneath the Coastal Plain sediments dip gently to the southeast. It is, therefore, more likely that the lineaments and rectilinear drainage patterns are associated with Quaternary deformation along faults as discussed in later sections.
Reevaluation of geomorphic anomalies along the ECFS in North Carolina
38 In addition to faulting, we evaluated various nontectonic processes to explain the geomorphic anomalies along the proposed ECFS. One mechanism that we considered for the uplift inferred from the incision of the Cape Fear River and uplifted fluvial terraces near Fayetteville is uplift associated with a convex-up flexural hinge zone like that along the Fall Line northwest of the Salisbury embayment in the mid-Atlantic states where the central Appalachian Piedmont from the Fall Line to the Great Valley has been uplifted 35–130 m during the past 15 myr (Pazzaglia and Gardner 1994). This scenario, however, fails to explain the local uplift near Fayetteville and along the proposed ECFS for several reasons. First, the area of interpreted uplift is only ~12 km wide (Fig. 8a) and does not appear to extend across the eastern Piedmont to the northwest. Secondly, this area lies near the Cape Fear arch axis where the effect of sediment loading is minimal compared to that of the subsiding Albemarle embayment over 150 km to the northeast (Fig. 1). Third, the uplift in the lower Cape Fear River valley began only ~3 Ma (Soller 1988) whereas isostatic adjustments from denudation of the eastern Piedmont to the west likely would have begun much earlier. Furthermore, it is unlikely that the faults along the mid-Atlantic Fall Line were produced by flexural deformation near the western edge of the Salisbury embayment. Marple (2004), for example, noted that the proposed fault zone along the large right-stepping bends in the Potomac, Susquehanna, and Delaware rivers along the mid-Atlantic Fall Line continues northeastward away from the Salisbury embayment where it crosses the western side of the South New Jersey arch to the northeast and, therefore, could not have been produced by flexural deformation along the proposed mid-Atlantic hinge zone.
39 Another observation that could be used to argue against the existence of the ECFS and other proposed faults across the Cape Fear arch is that they are not evident on regional-scale gravity and magnetics maps of the area. However, most faults that are interpreted from such maps are at least early Mesozoic in age with relatively large displacements and/or zones of mineralization. The ECFS and proposed faults across the Cape Fear arch, in contrast, appear to be Cenozoic faults because they cut across pre-Mesozoic terranes and Paleozoic faults in the pre-Cretaceous basement (Figs. 3b and 15b). Furthermore, because of the low Cenozoic fault-slip rate for the eastern United States (Prowell 1988, 0.3–1.5 m/myr), cumulative displacements along the ECFS and proposed faults across the Cape Fear arch are too small to be easily detected on regional-scale gravity and magnetics maps. Additionally, such young faults may not have had sufficient time for significant mineralization to have developed along them.
40 The lack of seismicity along the ECFS and the NW-SE-oriented lineaments crossing the arch could also be used to argue against their existence or that they are not active. The lack of seismicity, however, could be misleading as discussed later.
Origin of the Faison lineament and scarp
41 The scarps along the Faison lineament to the northwest and the vertically offset beach ridge near Faison (Figs. 4 and 5) suggest that the Faison lineament is the surface expression of a fault, herein named the Faison fault, that has ruptured the surface in the middle Coastal Plain during the Pleistocene. In contrast to the scarps to the northwest, displacements along the interpreted Faison fault to the southeast have uplifted the thicker outer Coastal Plain sediments and underlying sedimentary rocks to form the Sloan high. This hypothesis is supported by studies elsewhere that show coseismic folding of sediments above thrust faults buried beneath thick sediments (e.g., Yeats 1986). For example, reverse displacement along the buried fault associated with the Ms 6.5 1983 Coalinga, California, earthquake caused folding of the overlying Anticline Ridge without rupturing the surface (Stein and King 1984). Thus, although Pleistocene paleoshorelines are deflected southeastward around the Sloan high (Fig. 3), it is not likely that the Sloan high is simply a Pleistocene beach ridge. It is more likely that the paleoshorelines formed around the Sloan high when sea level rose to this area during the Pleistocene. Examples of Pleistocene paleoshorelines that are deflected around areas of gentle tectonic uplift in the eastern United States include the Pleistocene paleoshoreline along the Merrimack ridge above the Newburyport thrust fault in northeastern Massachusetts (Marple et al. 2018, figs. 2 and 4) and the Pliocene–Pleistocene paleoshorelines along the buried ECFS in South Carolina (Marple and Talwani 2000, fig. 12).
42 The nearly perpendicular orientation of the interpreted Faison fault relative to the present day ENE-WSW-oriented direction of the maximum horizontal compressive stress field, SHmax (Fig. 3b), the up-to-the-SW offset of the Pleistocene(?) beach ridge west of Faison (Figs. 5c and 5d), and the increasing elevation along the crest of this beach ridge deposit toward the Faison scarp (Fig. 5c) suggest that the Faison fault is a SW-dipping reverse or thrust fault that has undergone up-to-the-SW displacements during the Quaternary. The offset beach ridge near Faison further suggests that at least one large earthquake may have occurred along the Faison fault during the late Quaternary. The ~24° bend in the Faison fault (Fig. 3b) suggests that it may be strongly locked between fault ruptures.
Origin of the Jarmantown lineament and its possible relationship with the Neuse fault
43 The abrupt termination of the Precambrian to Paleozoic Graingers basin or synform along the Jarmantown high (Fig. 6) and the nearly perpendicular orientation of the Jarmantown high relative to SHmax (Fig. 3b) suggests that this topographic high was produced by uplift associated with up-to-the-SW displacements at depth along a buried, SW-dipping reverse or thrust fault that has uplifted the overlying sediments, like that proposed along the Sloan high. Thus, although the Surry paleoshoreline scarp is deflected around the Jarmantown high, it is not likely a Pleistocene beach ridge. The Surry scarp likely formed along the uplifted Jarmantown high when sea level rose to this area during the Pleistocene. Because the Jarmantown lineament is subparallel to previous interpretations of the Neuse fault (Fig. 3b), we postulate that the Jarmantown high is associated with uplift along the buried Neuse fault. The coincidence of the Jarmantown lineament with the relatively resistant late Proterozoic to Cambrian felsic metavolcanic rock unit to the northwest where the Neuse River valley narrows along the lineament (Fig. 3a, location V) further supports local uplift along the Neuse fault, causing this rock unit, which is normally found in the eastern Piedmont to the northwest, to be exposed at the surface.
Origin of the Tomahawk lineament
44 Various observations suggest that the Tomahawk lineament formed by late Quaternary deformation along a ~1.5-km-wide fault zone. The local rectangular-shaped northeastern wall of the South River valley south of Tomahawk (Fig. 7a) and the zone of ENE-WSW-oriented linear depressions southwest of the river (Figs. 7a and 7b) are easily explained by a fault zone that has fractured through the Upper Cretaceous strata beneath the Coastal Plain sediments. Similar rectangular-shaped valley walls exist along Foster Creek in the Coastal Plain north of Charleston, South Carolina, that Marple and Hurd (2020, fig. 6) hypothesized is from increased erosion along a broad fault zone associated with the Deer Park lineament, displacement along which they postulated may have produced the main shock of the 1886 Charleston earthquake.
45 The increased incision of the Cape Fear River near Elizabethtown and the increased river sinuosity downstream (Figs. 8a–8c) are consistent with up-to-the-northwest Holocene deformation along a fault associated with the Tomahawk lineament. The triangular-shaped depression east of the South River valley (Fig. 9) suggests that it formed from increased erosion caused by fracturing of the near surface sediments along this feature. The angular stream bends near this depression (Fig. 9) are also anomalous in the Coastal Plain where dendritic drainage patterns dominate. The angular stream bends are therefore likely related to faults that have fractured the near surface sediments, thus causing streams to develop locally along the faults. Because the ENE-WSW trend of the geomorphic anomalies along the South River valley project southwestward across the anomalous changes along the Cape Fear River valley near Elizabethtown and because of the lineament’s oblique orientation relative to SHmax (Fig. 3b), we postulate that the Tomahawk lineament is the surface expression of a Quaternary fault zone that has undergone predominantly sinistral-style displacements. The parallelism between the interpreted Tomahawk fault zone and the Pender fault to the south in the pre-Cretaceous basement (Fig. 3b) suggests that these two faults may be part of a broader ENE-WSW-oriented fault zone.
Origin of the Livingston Creek and White Marsh lineaments
46 The crosscutting relationship between the NW-SE-oriented Livingston Creek and White Marsh lineaments and the NE-SW-oriented Pliocene–Pleistocene barrier island deposits and the underlying Upper Cretaceous formations east of the Lumber River (Fig. 10) suggests that these lineaments represent the locations of Quaternary faults within a broader fault zone at least 25 km wide beneath the Coastal Plain sediments. Furthermore, the angular stream bends along these two lineaments and elsewhere in the soft unconsolidated Coastal Plain sediments, like that along Livingston Creek (Fig. 11b), are most easily explained by erosion along near-surface faults. In addition to the Livingston Creek and White Marsh lineaments, the numerous other angular stream bends southwest of the Cape Fear River (Fig. 10) suggest that there may be other NW-SE-oriented faults beneath the Coastal Plain of southeastern North Carolina. The proximity of the Livingston Creek and White Marsh lineaments to the Holocene paleoliquefaction deposits and a few small instrumentally-recorded earthquakes in southeastern North Carolina (Fig. 18) suggests that large Holocene earthquakes may have occurred along a fault associated with one of these lineaments.
 Display large image of Figure 18
47 A deep core-hole near one of the shorter NW-SE-oriented stream bends southeast of Elizabethtown (Figs. 10 and 11a) cuts through highly fractured metamorphic rocks near the bottom of the well (Self-Trail et al. 2004), which Weems et al. (2011a) interpreted to be associated with their NNE-SSW-oriented Fountains Creek fault (Fig. 3b, CH). Alternatively, the fractured rock in this core-hole could be from brittle faulting along one of several NW-SE-oriented fractures associated with the zone of NW-SE-oriented angular stream bends near the Livingston Creek lineament. The fractures in this core-hole could also be from the Pender fault in the pre-Cretaceous basement (Lawrence and Hoffman 1993), the trend of which also intersects the well (Fig. 3b).
Other lineaments across the Cape Fear arch
48 The other NW-SE-oriented lineaments crossing the Cape Fear arch may also be related to Quaternary faults beneath the Coastal Plain sediments. For example, the parallelism between the rectilinear drainage pattern along the Northeast Cape Fear River in Holly Shelter Swamp and the Sloan high along the interpreted Faison fault to the northeast (Fig. 12) suggests that this rectilinear pattern could be fault-controlled. The cross-cutting relationship of the lineament along Ellis Creek with the younger Pleistocene fluvial terraces northeast of the lower Cape Fear River (Fig. 13) suggests that it too may have formed along a Quaternary fault.
49 Although the Livingston Creek, White Marsh, and Tomahawk lineaments are shorter and less continuous than the Faison and Jarmantown lineaments, they cross the Cape Fear arch farther to the southwest where the Upper Cretaceous formations and Coastal Plain sediments are thicker. Thus, Quaternary deformation along buried faults to the southwest are less likely to deform the surface like that along the Faison and Jarmantown lineaments. If true, then the angular stream bends across the southern and northern flanks of the Cape Fear arch (Fig. 3a) may also be associated with Quaternary faults beneath the Coastal Plain. Thus, the Cape Fear arch may be structurally complex.
Further evidence for the ECFS in North Carolina and its revised location
50 The change from the predominantly NW-SE-orientation of streams in the Coastal Plain and eastern Piedmont to the NE-SW trend of streams along the ECFS (Figs. 1 and 3a) is best explained by structural control from Quaternary faulting along the ECFS. This hypothesis is further supported by the alignment of the ~5-km-wide zone of NESW-oriented linear depressions and Tertiary surface faults northeast of Smithfield (Figs. 15a–15c), the right-angle bends in Mingo Swamp, Hannah Creek, the Neuse River, Buffalo Swamp, and Little River (Figs. 3a, 15a, and 15d), the ~5-km-long Wade lineament along the ECFS (Figs. 8a and 16), and the deep incision of the Cape Fear River between Fayetteville and Erwin (Figs. 8a and 17). The coincidence of the ~14-km-long linear boundary between the bedrock units CZfv (felsic metavolcanic) and CZmd (metamudstone and meta-argillite) (North Carolina Geological Survey 1985) with the zone of linear depressions northeast of the Neuse River (Fig. 15b) suggests that this contact could represent a fault associated with the ECFS, but further evidence is needed to support this hypothesis.
51 Although the orientation of SHmax (Fig. 3b) favors right-lateral strike-slip displacements along the ECFS, the right-lateral stream bends along the ECFS, such as the 10 km right-step offset in the Neuse River near Smithfield, are not likely from long-term cumulative strike-slip displacements along the ECFS because of the low Cenozoic fault-slip rate for the eastern United States (Prowell 1988, 0.3–1.5 m/myr). We, therefore, postulate that the right-stepping stream bends along the ECFS represent structural control of these streams by near-surface brittle faulting along the ECFS.
52 The deep incision of the Cape Fear River and the lack of a Holocene floodplain between Fayetteville and Erwin (Figs. 8a and 17), the uplifted Pliocene–Pleistocene terraces northeast of Fayetteville (Soller 1988), and the Tertiary surface faults northeast of Smithfield (Figs. 3b and 15b) indicate that the ECFS in North Carolina has undergone late Cenozoic deformation. The narrowing of Black Creek valley near the Neuse River just southwest of Smithfield (Fig. 15a, arrow labeled BN) and along Buffalo Creek to the northeast (Fig. 15d, location A) may also be associated with local Cenozoic uplift along this part of the fault zone. The linear topographic highs along the north side of Buffalo Creek and northeast of Little River (Fig. 15d, locations B and D) may also represent local uplift along brittle faults associated with the ECFS.
Revised location of the ECFS in North Carolina
53 Various observations suggest that the ECFS crosses the Cape Fear River upstream (northwest) from the large river meander near Fayetteville rather than along the meander as proposed by Marple and Talwani (2000). First, the deepest river incision upstream from the meander (Figs. 8a and 17) suggests that the ECFS underlies this part of the river. Secondly, the alignment of the right-angle bend in Mingo Swamp with the Wade lineament to the southwest (Fig. 16) suggests that the ECFS continues southwestward across the unpaired Pleistocene fluvial terraces of the lower Cape Fear River valley. The projection of this trend to the southwest intersects the Cape Fear River upstream from the large river meander (Fig. 8a). Third, the start of the meander coincides with the confluence of the Cape Fear River with its tributary, Rockfish Creek, which is also deeply incised (Fig. 8a). As uplift along this part of the ECFS began ~750 ka, the increased sediment load in the Cape Fear River from incision along Rockfish Creek and the Cape Fear River upstream caused the sediment to be deposited downstream from the mouth of Rockfish Creek, causing the Cape Fear River to locally shift northeastward away from the newly deposited sediment to form the large meander. As uplift continued, the meander loop became entrenched. This hypothesis is supported by previous studies of rivers that show increased sinuosity downstream from local uplifts (e.g., Schumm 1986). A major implication of the revised ECFS location near Fayetteville is that its southwest projection beyond the Cape Fear River is continuous with the ECFS in northeastern South Carolina where it forms a ~15° restraining bend along the fault system (Fig. 18), rather than a right-step offset as proposed by Marple and Talwani (2000).
Previously interpreted faults in southeastern North Carolina
54 The coincidence of the Clinton and South River faults of Weems et al. (2011a) with linear stream segments of the South River and Clinton Creek (e.g., Fig. 3a) suggests that these faults have fractured close enough to the surface to cause these streams to develop locally along their trends. No geomorphic anomalies were noted, however, along the previously proposed Cape Fear, Carolina, Fountains Creek, or Turnbull Creek faults (Fig. 3b). Thus, more data are needed to ascertain their existence.
Origin of the Cape Fear arch
55 The down-to-the-southwest cross-valley tilt along the lower Cape Fear and Pee Dee river valleys on the southern flank of the Cape Fear arch, combined with the absence of a down-to-the-northeast cross-valley tilt of the Neuse and Tar river valleys to the northeast (Fig. 2), suggests that Quaternary uplift along the Cape Fear arch has been associated with mostly down-to-the-southwest tilting. The coincidence of the interpreted Faison and Neuse faults with the Faison topographic high (FTH) (Figs. 2 and 3) suggests that the main source of the regional down-to-the-southwest tilt along the southern flank of the arch is from up-to-thesouthwest reverse- or thrust-style displacements along these two faults. The presence of these two interpreted faults and the numerous other lineaments to the southwest suggest that the Cape Fear arch is a large, structurally complex feature where deformation along many faults may have contributed to Cenozoic uplift along the arch.
56 We propose that the numerous interpreted faults crossing the Cape Fear arch formed to compensate for the increased compression and change in volume from dextral motion along the ~15° restraining bend in the ECFS to the southwest (Fig. 18). Marple and Miller (2006) and Marple and Hurd (2020) proposed a similar origin for interpreted faults northeast of the 12° restraining bend in the ECFS (locally known as the Woodstock fault) south of Summerville. Restraining fault bends favor the development of cross-faults and can result in large earthquakes (e.g., King and Nábĕlek 1985).
Seismic potential of the ECFS and interpreted faults crossing the Cape Fear arch
57 Although the orientation of the ECFS and other interpreted faults across the Cape Fear arch relative to SHmax favor their reactivation, recent seismicity across the arch and near the ECFS has been low level (Stover and Coffman 1993) (Fig. 18). However, studies of paleoliquefaction deposits in southeastern North Carolina and northeastern South Carolina (e.g., Weems and Obermeier 1990) (Fig. 18) suggest that moderate to large Holocene earthquakes have occurred along faults that cross the southern flank of the Cape Fear arch. One possible source of these Holocene earthquakes is the interpreted fault zone associated with the Livingston Creek and White Marsh lineaments, which are located near these Holocene paleoliquefaction deposits and a few small instrumentally-recorded earthquakes (Fig. 18). The vertically-displaced beach ridge along the Faison lineament (Figs. 4 and 5) suggests that large Quaternary earthquakes may also have occurred along the proposed Faison fault. Thus, the current low level of seismicity across the Cape Fear arch and along the ECFS may be the result of the low strain rate along the Atlantic margin (10-9 to 10-10 yr-1, Johnston 1989). Recurrence intervals could range from hundreds to tens of thousands of years between large earthquakes along the ECFS and faults crossing the Cape Fear arch, during which the faults would remain largely aseismic. Moreover, numerous studies elsewhere in intraplate settings have documented evidence for Pleistocene to Holocene earthquakes along faults that currently exhibit little or no seismicity, including the Bootheel fault in the New Madrid region (Guccione et al. 2005), the Saline River fault zone in southern Arkansas (Cox et al. 2012), the Newburyport fault in northeastern Massachusetts (Marple et al. 2018), the Tennant Creek earthquakes of Australia (Crone et al. 1997), and the proposed southwest continuation of the Norumbega fault system in southern New England where several Pleistocene drumlins are vertically offset (Marple and Hurd 2019).
CONCLUSIONS
58 In conclusion, we postulate that the LiDAR lineaments interpreted across the Cape Fear arch are associated with Cenozoic faults, many of which may have undergone late Quaternary deformation. The Jarmantown lineament appears to be the surface expression of the previously controversial Neuse fault. We postulate that the interpreted NW-SE-oriented Faison fault and the Neuse fault along the NW-SE-oriented Jarmantown lineament have undergone up-to-the-southwest reverse- or thrust-style Quaternary displacements that produced Quaternary uplift and a down-to-the-southwest tilt along the Cape Fear arch, causing the lower Cape Fear and Pee Dee rivers on the southern flank of the arch to migrate southwestward away from the uplift.
59 A vertically offset Pleistocene beach ridge along the interpreted Faison fault suggests that large Quaternary earthquakes may have occurred along this fault. The proximity of the Livingston Creek and White Marsh lineaments to Holocene paleoliquefaction sites in northeastern South Carolina and southeastern North Carolina suggest that large Holocene earthquakes may have occurred along a fault associated with one of these lineaments. Paleoliquefaction sites along the South Carolina coast, the late Pleistocene to Holocene incision of the Cape Fear River and locally uplifted Pliocene–Pleistocene terraces near Fayetteville, North Carolina, and the Tertiary surface faults northeast of Smithfield suggest that Pleistocene and Holocene earthquakes may also have occurred along various parts of the ECFS in North Carolina. We further hypothesize that the Cape Fear arch is structurally complex based on the numerous lineaments crossing the arch in southeastern North Carolina and that Cenozoic deformation along these interpreted faults may have contributed to the formation of the arch.
60 We postulate that the ECFS along the western side of the Cape Fear arch near Fayetteville is ~6 km farther to the northwest than previously reported. The southwest projection of this revised location suggests that the ECFS in North Carolina is continuous with the ECFS to the southwest in northeastern South Carolina where it forms a 15° restraining bend. The interpreted faults across the Cape Fear arch may have formed to compensate for the increased compression and change in volume produced by dextral motion along this restraining bend. Although the current level of seismicity across the Cape Fear arch is low, the orientation of the ECFS and the numerous faults crosscutting the arch relative to SHmax favors their reactivation. This conclusion, combined with the low strain rate in the eastern United States, suggests that the ECFS and other interpreted faults cross-cutting the Cape Fear arch are presently locked with strain accumulating along them.
61 Geological and geophysical studies are needed to further document Quaternary faulting along the ECFS and the interpreted Faison, Jarmantown, Livingston Creek, White Marsh, and Tomahawk lineaments, and to determine if any of the proposed NW-SE-oriented faults continue offshore. Further studies are also needed to determine the seismic potential of the ECFS and the various interpreted faults crossing the Cape Fear arch. A large earthquake today in eastern North Carolina would cause tremendous damage to infrastructure and loss of life. Raleigh, for example, is located only 50 km west of the ECFS and Wilmington is near the northernmost Holocene paleoliquefaction site near Southport and just east of the Livingston Creek lineament. Fort Bragg, Fayetteville, and Smithfield are located near the trace of the ECFS in North Carolina.
ACKNOWLEDGEMENTS
We thank the two anonymous reviewers for their many constructive comments that helped improve this paper. We also thank Atlantic Geology editor Denise Brushett for her help in formatting this manuscript.
REFERENCES
Editorial responsibility: Denise Brushett