Article
Comparison of isotopic compositions of hydrocarbon gas in shallow groundwater and a deep oil and natural gas reservoir in southeastern New Brunswick, Canada
doi: 10.4138/atlgeol.2020.009
Abstract
Isotopic analyses of natural gas from the Stoney Creek oil field in New Brunswick indicate carbon (δ13C) and hydrogen (δ2H) values in methane (C1) of -42.4 ± 0.7‰ VPDB and -220.9 ± 3.2‰ VSMOW, respectively. Isotopic data and a gas molecular ratio of 12 ± 1 indicate a wet thermogenic gas formed with oil near the onset of the oil-gas transition zone. The isotopic profiles of the C1–C5 hydrocarbon gases are consistent with kinetic isotope effect models. The Albert Formation of the Horton Group hosts the Stoney Creek oil field (SCOF) and the McCully gas field (MCGF) the only other gas-producing field in the province. Both are thermogenic in origin; however, the SCOF gas has a lower thermal maturity than the MCGS. Hydrocarbon gas composition in shallow aquifers across southeastern New Brunswick was also evaluated. Gas source interpretations based on δ13C and δ2H values are uncertain; oxidation and biogenic overprinting are common and complicate interpretation. The effect of oxidation on δ13C and δ2H values was apparent when C1 concentrations were ≤1 mg/L. In some samples with C1 concentrations >5 mg/L, isotopic discrimination methods point to a biogenic origin. However, the molecular ratios <75 and the presence of >C3 fractions, indicate a thermogenic origin. This suggests a thermogenic isotopic signature has been overprinted by biological activity.
Résumé
Les analyses isotopiques du gaz naturel en provenance du champ pétrolifère de Stoney Creek au Nouveau-Brunswick révèlent des concentrations de carbone (δ13C) et d’hydrogène (δ2H) dans le méthane (C1) de -42,4 ± 0,7 ‰ de VPDB (bélemnites de Pee Dee de Vienne) et de -220,9 ± 3,2 ‰ de VSMOW (eau océanique moyenne normalisée de Vienne), respectivement. Les données isotopiques et un coefficient moléculaire du gaz naturel de 12 ± 1 signalent qu’un gaz thermogénique humide s’est formé en association avec du pétrole près du commencement de la zone de transition entre le pétrole et le gaz naturel. Les profils isotopiques des gaz d’hydrocarbures C1–C5 correspondent aux modèles de l’effet isotopique cinétique. La Formation d’Albert du groupe de Horton abrite le champ pétrolifère de Stoney Creek (CPSC) et le champ pétrolifère McCully (CPMC), seul autre champ producteur de gaz naturel dans la province. Les deux sont d’origine thermogénique, mais le gaz du CPSC a une maturité thermale inférieure au CPMC. La composition en gaz d’hydrocarbures des formations aquifères peu profondes dans le sud-est du Nouveau-Brunswick a elle aussi été évaluée. Les interprétations des sources de gaz naturel basées sur les concentrations de δ13C et de δ2H sont incertaines. L’oxydation et la surimpression biogénique sont courantes et compliquent l’interprétation. L’effet de l’oxydation sur les concentrations de δ13C et de δ2H était visible lorsque les concentrations de C1 étaient ≤1 mg/L. Dans un certain échantillon comportant des concentrations de C1 de >5 mg/L, les méthodes de discrimination isotopique indiquent une origine biogénique. Les coefficients moléculaires de <75 et la présence de fractions de >C3 révèlent toutefois une origine thermogénique. Cela laisse supposer qu’une signature isotopique thermogénique s’est superposée dans le cadre d’une activité biologique.
[Traduit par la redaction]
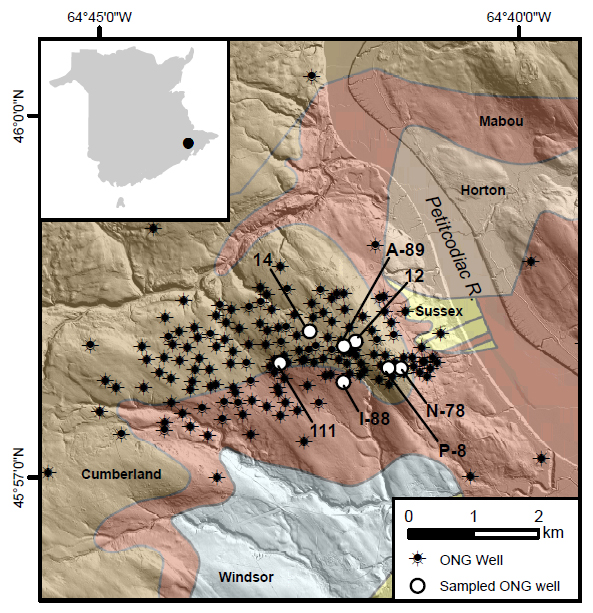
INTRODUCTION
1 Commercial hydrocarbon production in New Brunswick extends back to the mid-Nineteenth Century, when the province exported bitumen mined from oil-shale and albertite (solid bitumen) deposits at Albert Mines, located approximately 25 km southeast of Moncton (Martin 2003). Early hydrocarbon exploration focused on known oil and gas seepages in the area south of Moncton (Foley 1989), and one of the first oil wells in North America was drilled in 1859 at Dover, east of the Peticodiac River (St. Peter 2000). Oil-bearing rock in the first production well was encountered at an approximate depth of 27 m (Martin 2003), indicating near surface occurrences of hydrocarbon-bearing units. Until recently, however, the most significant oil and natural gas (ONG) production has come from the Stoney Creek field (St. Peter 2000). It is located west of the Peticodiac River, approximately 20 km south of Moncton (Fig. 1). In that area of the field, well depths range from approximately 800 to 1500 m. The field began producing primarily gas in 1910, with a peak annual production of 2.4 × 10⁷ m3 (860 mmscf). In the mid-1920s, oil production increased, peaking at 4500 m3 (30 000 bbls) per annum. In the late-1940s, the field saw a rapid drop in gas production, while oil production declined more slowly until production stopped in 1991. Oil production recommenced in 2007 and continues today, with a maximum annual production since then of 5000 m3. The Stoney Creek oil field (SCOF) currently includes approximately 160 wells: three are horizontal wells and the rest are vertical wells. Provincial records indicate that most wells have been abandoned, but approximately 34 are either shut in or producing. Another ~50 nonproducing wells are located outside the main SCOF area. In 2000, 55 km to the southwest of the SCOF, gas was discovered at a depth of approximately 2500 m. The field is identified as the McCully gas field (MCGF). Production at the MCGF began in 2003 and had peak gas production of 2.1 × 10¹⁶ m3 in 2008. Provincial records indicate that there have been 39 ONG wells drilled in the field. The wells are vertical or inclined and were hydraulically fractured (Jiang et al. 2016).
 Display large image of Figure 1
2 Hydrocarbon resources from the two ONG fields, and from Albert Mines, are associated with the lacustrine hydrocarbon-bearing shales and sandstones of the Albert Formation. Conventional and fracture-stimulation extraction techniques have been used in the SCOF throughout its history (St. Peter 2000), whereas the MCGF has required fracture stimulation to achieve commercial production rates (Corridor Resources Inc. 2019). With recent advances in horizontal well drilling and hydraulic fracturing (i.e., unconventional ONG extraction), the natural gas and oil held in the Albert Formation shales and tight sandstones may be extracted at economical rates in other areas of the province. However, the surge in unconventional ONG extraction has brought intense scrutiny to the petroleum industry from the public, governments and academics (Vidic et al. 2013).
3 Oil and natural gas production generates concerns regarding the risk to freshwater resources from contamination resulting from wellbore integrity failure, waste-water discharge and accidental spills at the surface (Vengosh et al. 2014). This has prompted a wide range of research, including many regional groundwater studies attempting to determine impacts from pre-existing unconventional ONG production (McMahon et al. 2017) and in areas of potential unconventional development (Harkness et al. 2018; McIntosh et al. 2014; Moritz et al. 2015). Other evaluations have been conducted before, during and after unconventional ONG extraction (Harkness et al. 2017). Studies of this type commonly focus on shallow potable water aquifers in the region of interest and include the collection of data on the molecular composition of the gas, methane (C1), ethane (C2) and propane (C3) content, and the isotopic compositions of carbon (δ13C) and hydrogen (δ2H) in C1. The isotopic composition of hydrocarbon gases can indicate if the gases were formed through microbial action, commonly referred to as biogenic gas, or through abiotic cracking of oil or kerogen, commonly referred to as thermogenic gas (Schoell 1983; Whiticar 1999; Milkov and Etiope 2018). The isotopic compositions of hydrocarbon gases may also be used as tracers to identify natural connections to hydrocarbon reservoirs or pathways for stray gas entering shallow aquifers due to ONG resource developments (Sharma et al. 2014). However, to be useful as a tracer, the isotopic composition of the gas source must be known. Barton (2018) characterized gases from the MCGF, but isotopic characterization of gas from the SCOF has not been carried out. Therefore, the first objective of the work presented here was to determine the isotopic composition of hydrocarbon gases from the SCOF.
4 In 2014, the New Brunswick Energy Institute commissioned a regional baseline groundwater study across southeastern New Brunswick (Loomer et al. 2016). The first objective of the study was to collect and report on private well-water chemistry in regions that the petroleum industry had identified as potential targets for unconventional ONG exploration and development. In 2017, additional regional well-water sampling in the vicinity of the SCOF was carried out (Loomer and MacQuarrie 2018). The groundwater chemistry data compiled in these two studies included dissolved hydrocarbon gas content and their isotopic compositions. The second objective of the present work was to evaluate the isotopic composition of hydrocarbon gases detected in shallow groundwater, including the rarely reported isotopic composition of C2, and compare them to the chemical and isotopic compositions of gases from the ONG fields. Similarities in the molecular and isotopic compositions of the hydrocarbon gases at depth and in shallow groundwater can be an indication of direct and rapid transport of the gases toward the surface, possibly facilitated by conduits such as natural open fractures or leaking well bores. However, the isotopic compositions of hydrocarbon gases may be altered as a result of secondary effects such as migration, mixing and microbial action (Whiticar 1994). Using the data from the two regional groundwater studies, data from the MCGF (Barton 2018), and additional hydrocarbon data from the SCOF, this work seeks to identify the presence of such effects and to use additional hydrocarbon data, along with knowledge of the local geology, to aid in the assessment of the gas origins in shallow groundwater. In doing so, it incorporates a more complete, updated and detailed interpretation of the groundwater data from Loomer et al. (2016) and Loomer and MacQuarrie (2018).
STUDY SETTING
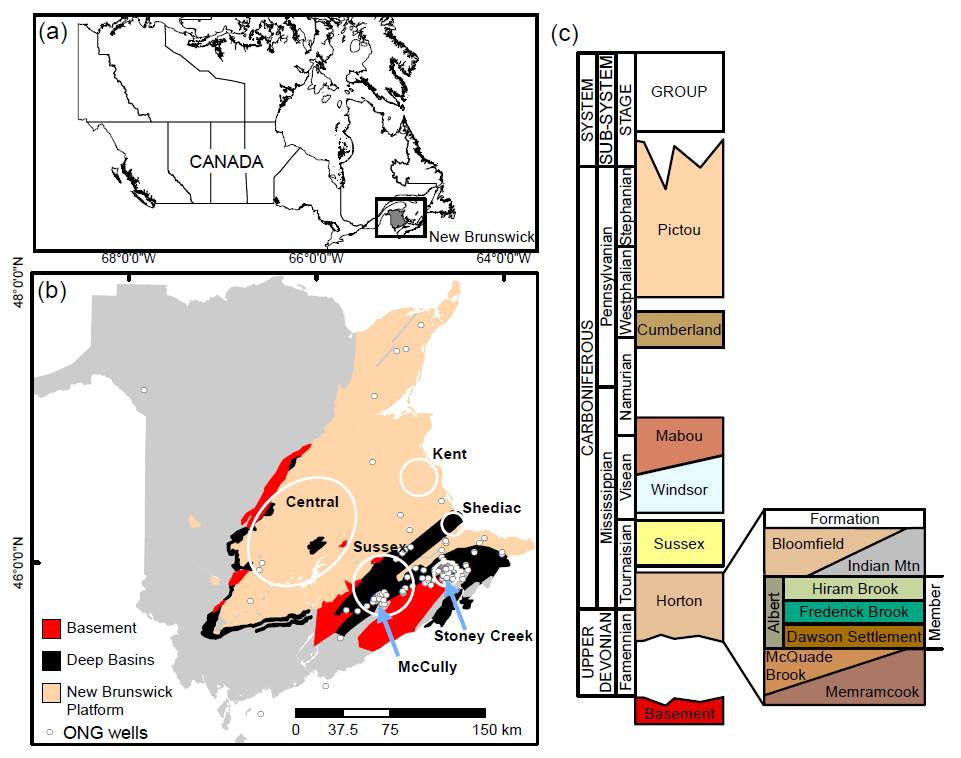
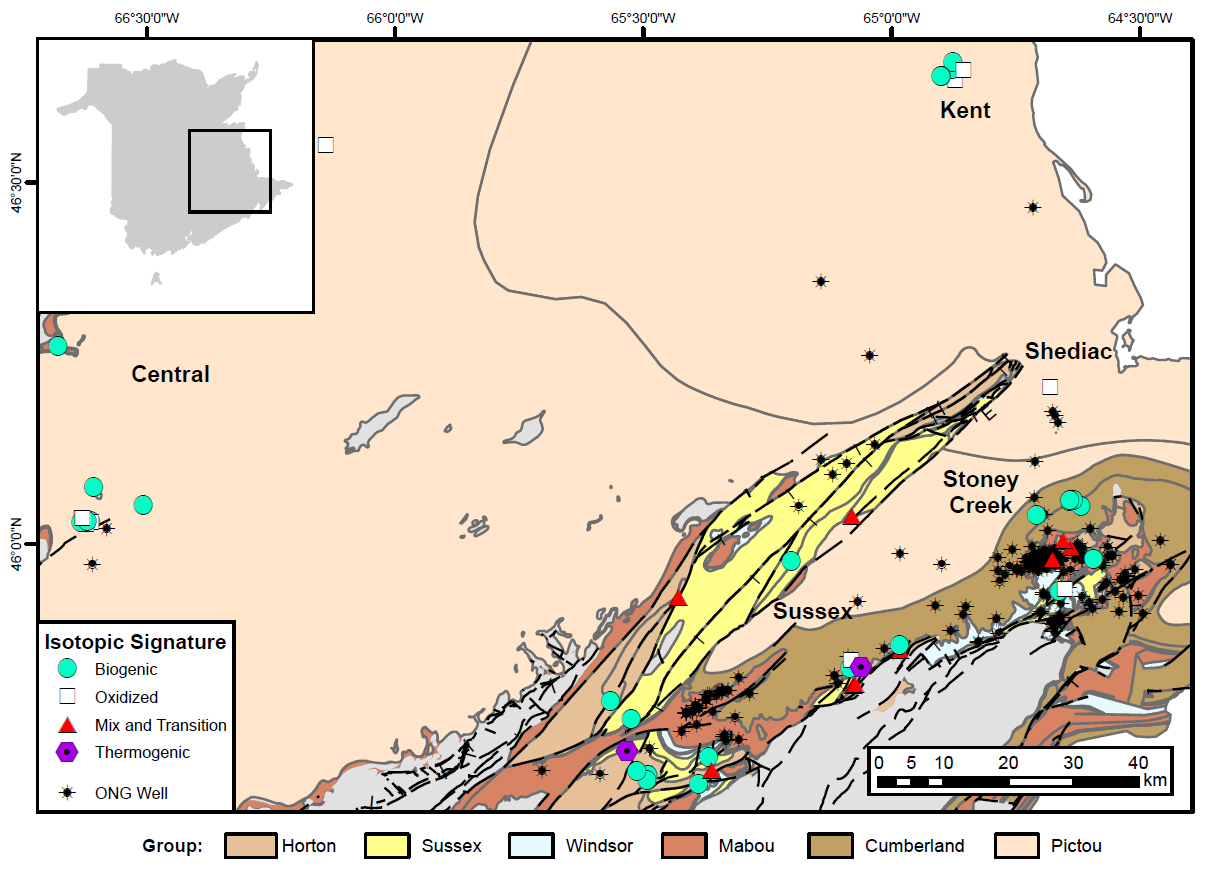
5 The study is set within the late Paleozoic Maritimes Basin of Atlantic Canada (Fig. 1), a successor basin that formed subsequent to the Early to Middle Devonian Acadian Orogeny. It developed in five cycles of subsidence and deposition punctuated by basin inversion/uplift and erosion throughout the Carboniferous Period (Wilson and White 2006). It is characterized by thick deposits of predominantly sedimentary rocks that were formed in alluvial, fluvial, lacustrine and marine environments. St. Peter and Johnson (2009) provided a compilation of previous work on the stratigraphic and structural evolution of the Maritimes Basin in New Brunswick. Briefly, the basin is divided into six main stratigraphic units. In order of decreasing age, they are the Horton, Sussex, Windsor, Mabou, Cumberland, and Pictou groups. The Horton Group is composed of alluvial and freshwater lacustrine strata and overlies a pre-Late Devonian crystalline basement complex. The Sussex Group, a sequence of continental clastic rocks deposited during a more arid interval, truncates the Horton Group with an angular unconformity. The Windsor Group formed as a result of a marine incursion and unconformably overlies the Sussex Group. It comprises coarse-grained clastic rocks and red mudstones, together with carbonates, gypsum, anhydrite, halite and local potash beds. The coarse-grained clastic red beds of the Mabou Group overlie the Windsor strata. The Cumberland Group unconformably overlies the Mabou Group and consists primarily of terrestrial red and grey conglomerates and coarse sandstones with lesser mudstones and minor coal seams. The youngest group in the sequence, the Late Pennsylvanian Pictou Group, is made up of fining-upward fluvial cycles of grey and red sandstones and mudstones with coal seams. The Maritimes Basin includes a series of deep, northeast-trending grabens, commonly referred to as subbasins, separated by intervening horsts. The New Brunswick Platform is a horst and the subbasins are infilled with Horton, Sussex, Windsor and Mabou group rocks. The Cumberland and Pictou groups form a cover sequence that unconformably overlies strata in the older subbasins, with the Pictou Group covering most of the New Brunswick Platform.
6 The units most relevant to commercial ONG production in the province are the Dawson Settlement, Frederick Brook and Hiram Brook members of the Albert Formation in the Horton Group (Fig. 1c). The present-day maximum burial depth is approximately 5 km in the Sussex area (Park 2014). Keighley (2008) described the members of the Albert Formation in terms of a tectonically controlled, wedge-shaped lacustrine basin, where the Dawson Settlement and Frederick Brook members represent the sediment-starved, lacustrine-dominated stage. The basin then infilled with the predominantly deltaic and fluvial-floodplain sediments of the Hiram Brook Member. The three members are considered to be gradational with lateral interfingerings of lithologies (sandstones and shales) (St. Peter and Johnson 2009). The primary zone of gas production from the SCOF was the Hiram Brook Member, and the primary oil producing zone involved sandstones of the Dawson Settlement Member (Foley 1989; St. Peter and Johnson 2009). However, oil-rich zones in the Hiram Brook Member at the SCOF are also known (Chowdhury et al. 1991). In the MCGF, the targets for gas have been the Hiram Brook and Frederick Brook members (Park 2014; Barton 2018).
7 The present study is focused on the five areas within the Maritimes Basin that were included in two recent regional groundwater studies (Fig. 1b; Loomer et al. 2016; Loomer and MacQuarrie 2018). Three of these — the Central, Kent and Shediac areas — had been targeted for ONG exploration but have yet to see resource development activities. The other two areas have seen limited (Sussex) to extensive (Stoney Creek) ONG development. The Sussex area includes the MCGF, and the Stoney Creek area extends over a 10-km radius from the centre of the SCOF. The Central and Kent areas are located on the New Brunswick Platform; the majority of the groundwater wells in these two study areas are completed in the Pictou Group. The Shediac area straddles the Cocagne subbasin, the Indian Mountain deformed zone, and the Westmorland uplift (St. Peter and Johnson 2009); however, the surficial bedrock primarily belongs to the Pictou Group. The Sussex and Stoney Creek areas are located within the Moncton subbasin, with faulted and folded strata from all geologic groups of the Maritimes Basin outcropping at surface.
SAMPLING AND ANALYSES
8 The SCOF produces mainly oil; however, natural gas is captured from the wellheads and used to power machinery on site. On 29 October 2018, samples of this gas were collected at the wellhead from seven producing wells (Fig. 2). The sampled wells include three horizontal boreholes drilled in 2006 and 2008 that targeted the Dawson Settlement Member (wells A-89, I-88 and N-78). Four previously shut-in wells (12, 14, 111 and P8), which date from as early as 1910, were re-entered in 2007, and these were also sampled. Well depths range from 800–1580 m, and current oil production is from the Dawson Settlement Member (Acadian Securities 2007; Orlen 2019). The older wells were originally open holes below the Hiram Brook Member (St. Peter and Johnson 2009), and natural gas production was primarily from the Hiram Brook Member, whereas the main oil producing unit was the Dawson Settlement Member (Foley 1989). Casing and perforation details from the horizontal and recompleted wells were not disclosed, but extraction from multiple units is possible (Acadian Securities 2007). Therefore, the production of natural gas cannot be constrained to a specific unit. Gas samples were collected in Isotubes® (IsoTech Laboratories, Champaign IL, USA) using a pressure-controlling sampling manifold.
 Display large image of Figure 2
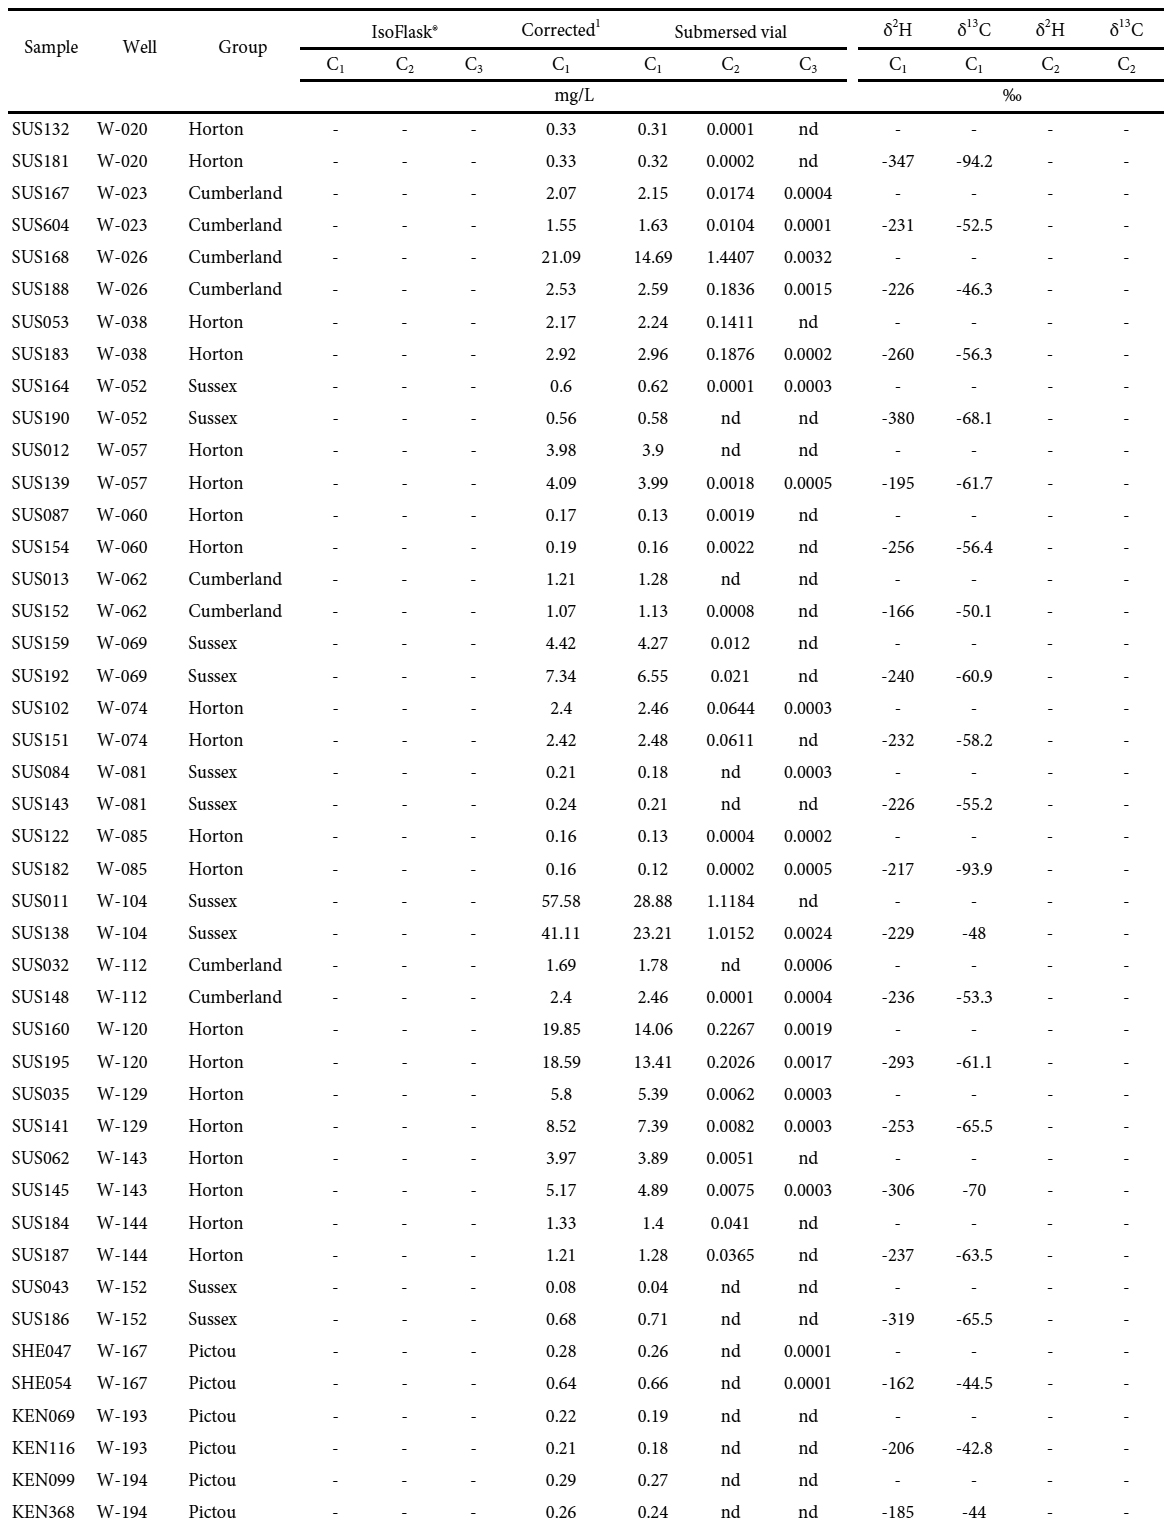
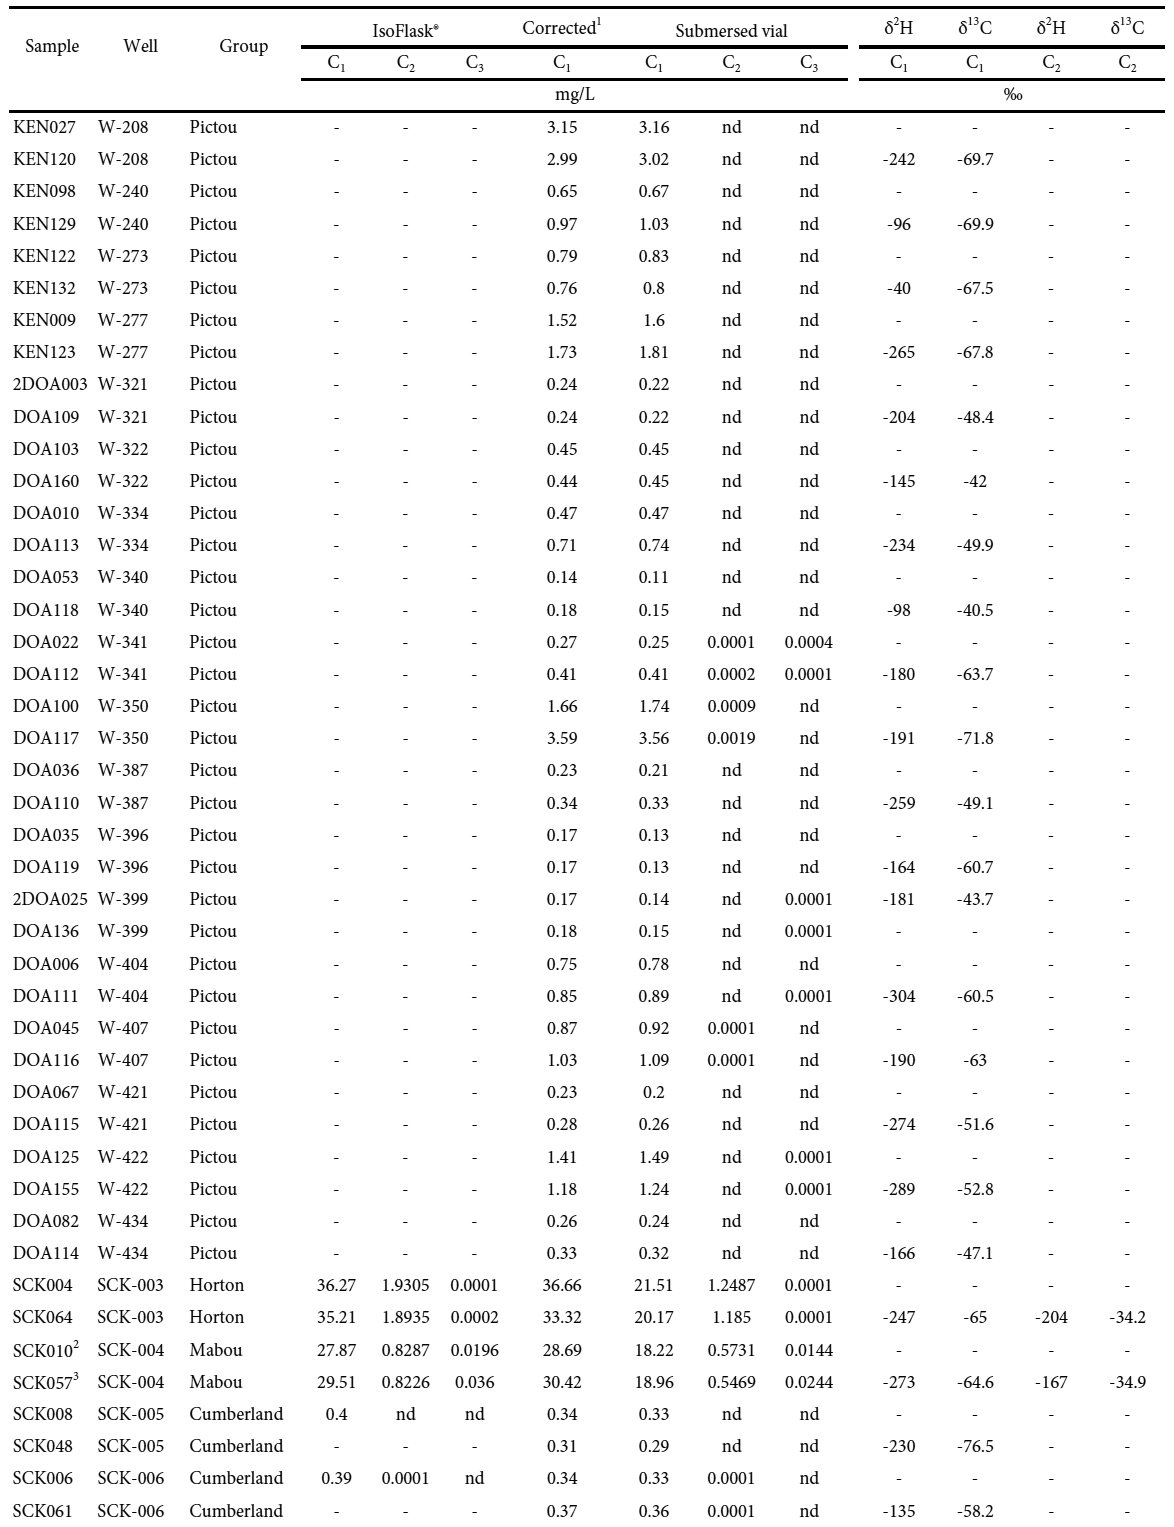
9 Groundwater data are reported for a subset of 52 wells from the two regional studies (Loomer and MacQuarrie 2018; Loomer et al. 2019). The dataset represents groundwater with dissolved C1 concentrations >0.1 mg/L and includes wells located within all five study areas. All wells sampled in the Central, Kent, Shediac and Sussex areas are located more than 800 m from an ONG well. In the Stoney Creek area, the horizontal distance between the water wells and the nearest ONG well ranges from 85–4900 m. The water wells were sampled twice, the second including the collection of samples for the determination of δ13C and δ2H in C1. The isotopic composition of C2 was also determined from Stoney Creek well water samples when C2 concentrations were >0.1 mg/L. Samples were collected between June and October in 2014, 2015 and 2017. The time between the collection of the first and second samples for each well ranged from 13 to 349 days, but was typically on the order of 40 days.
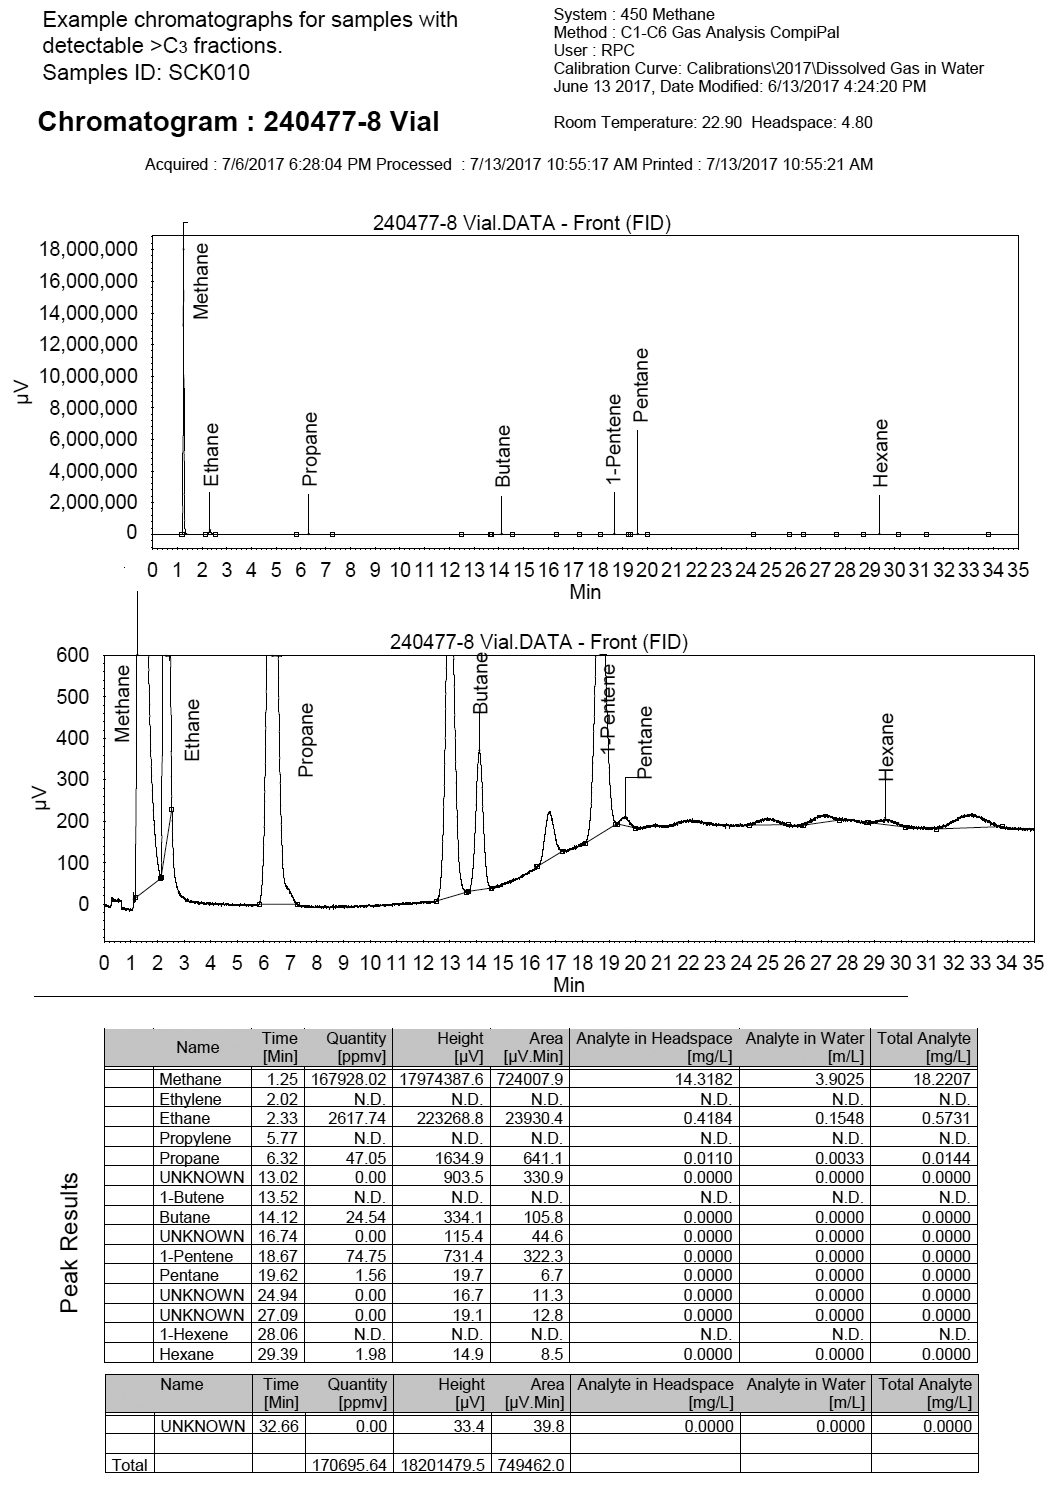
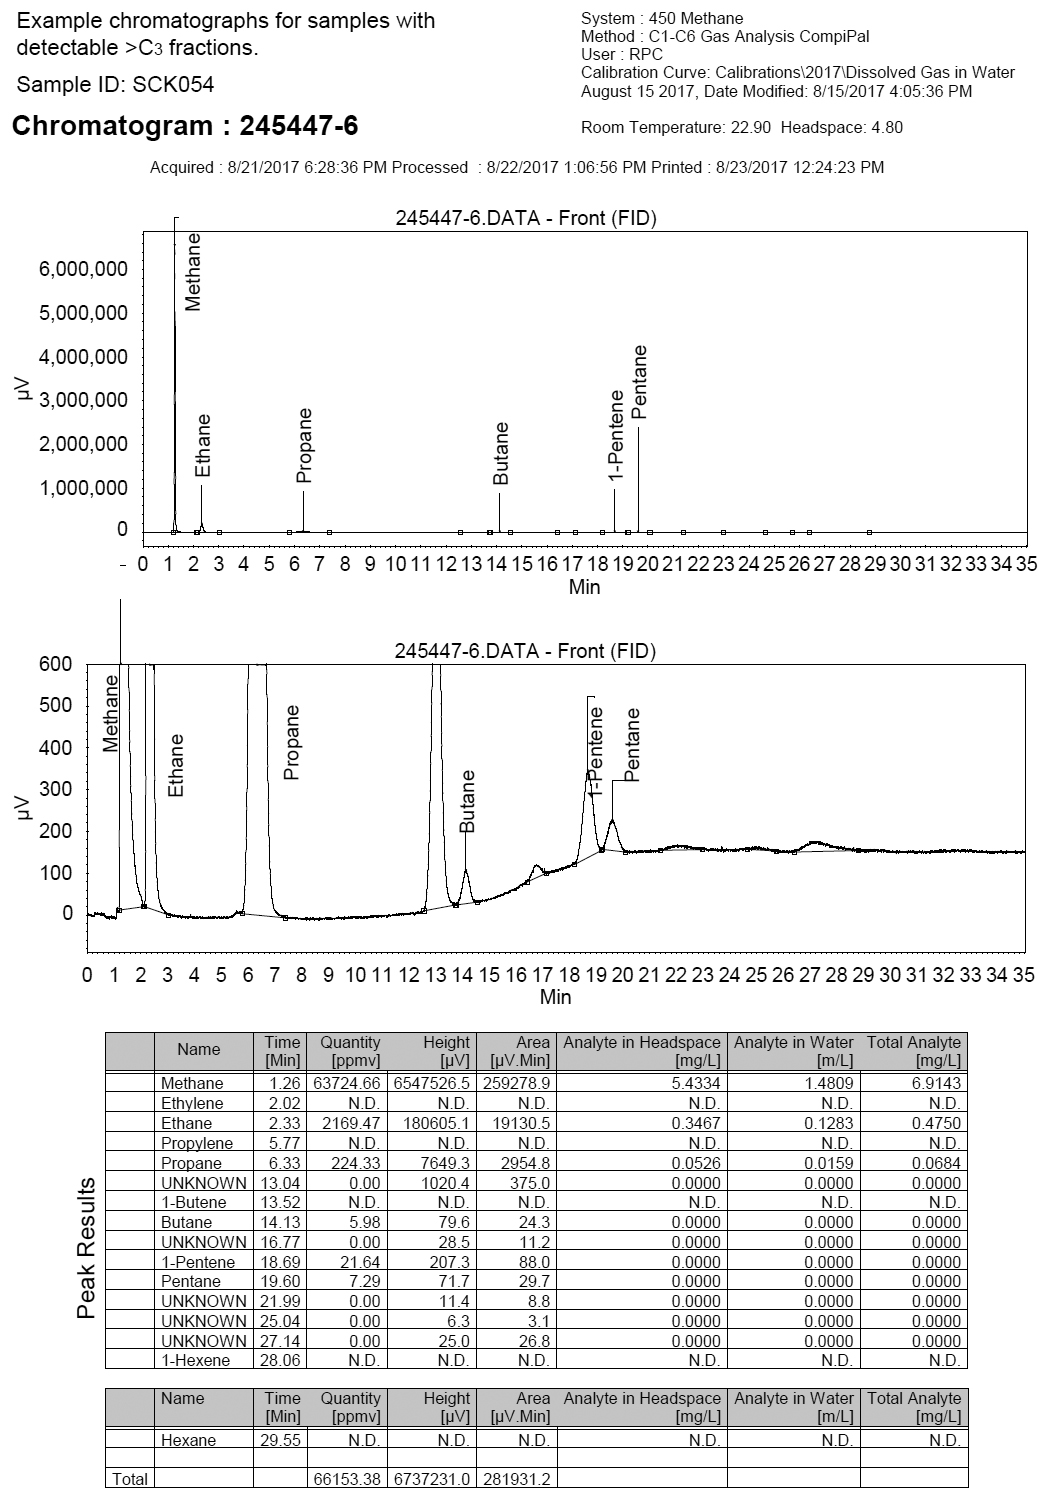
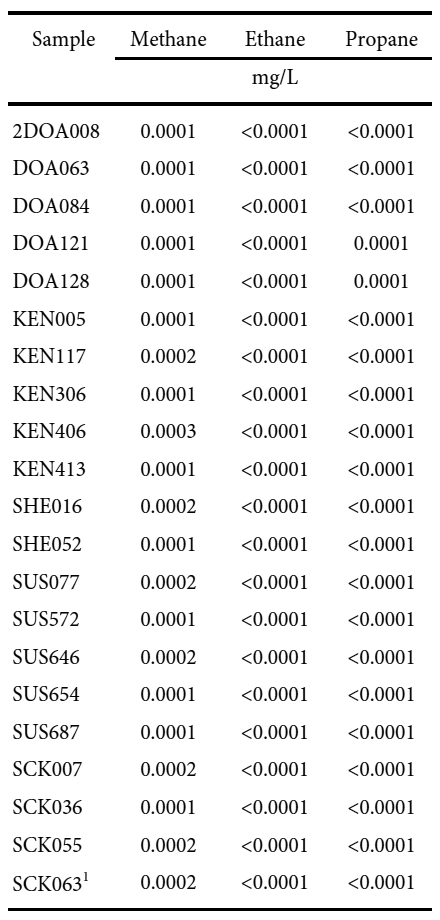
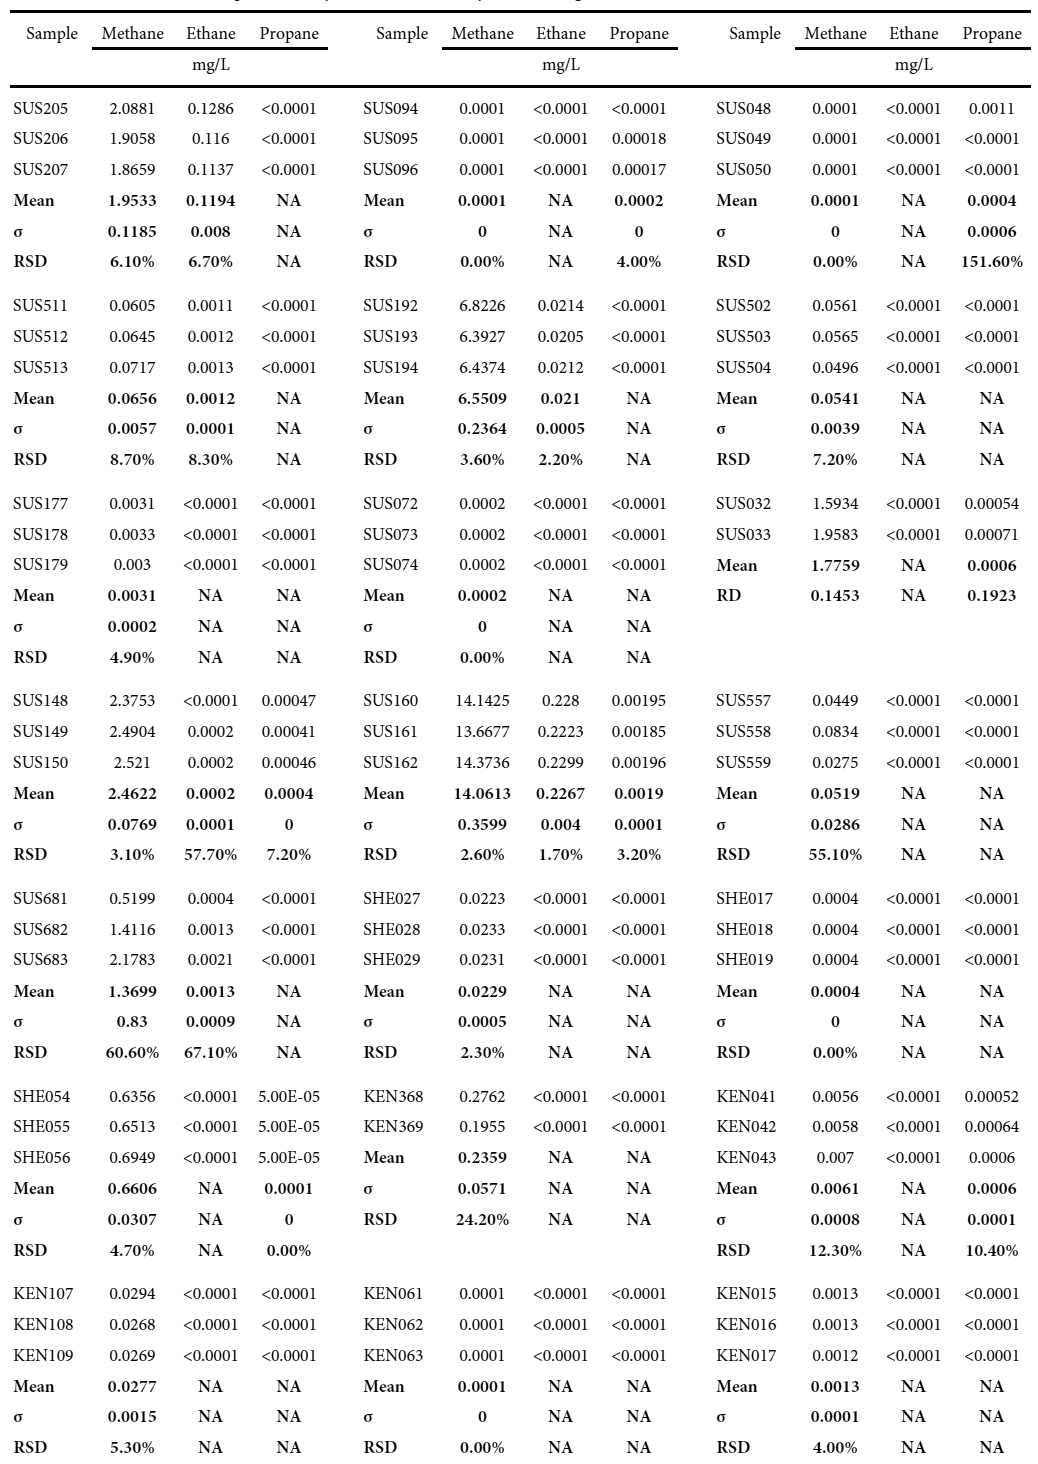
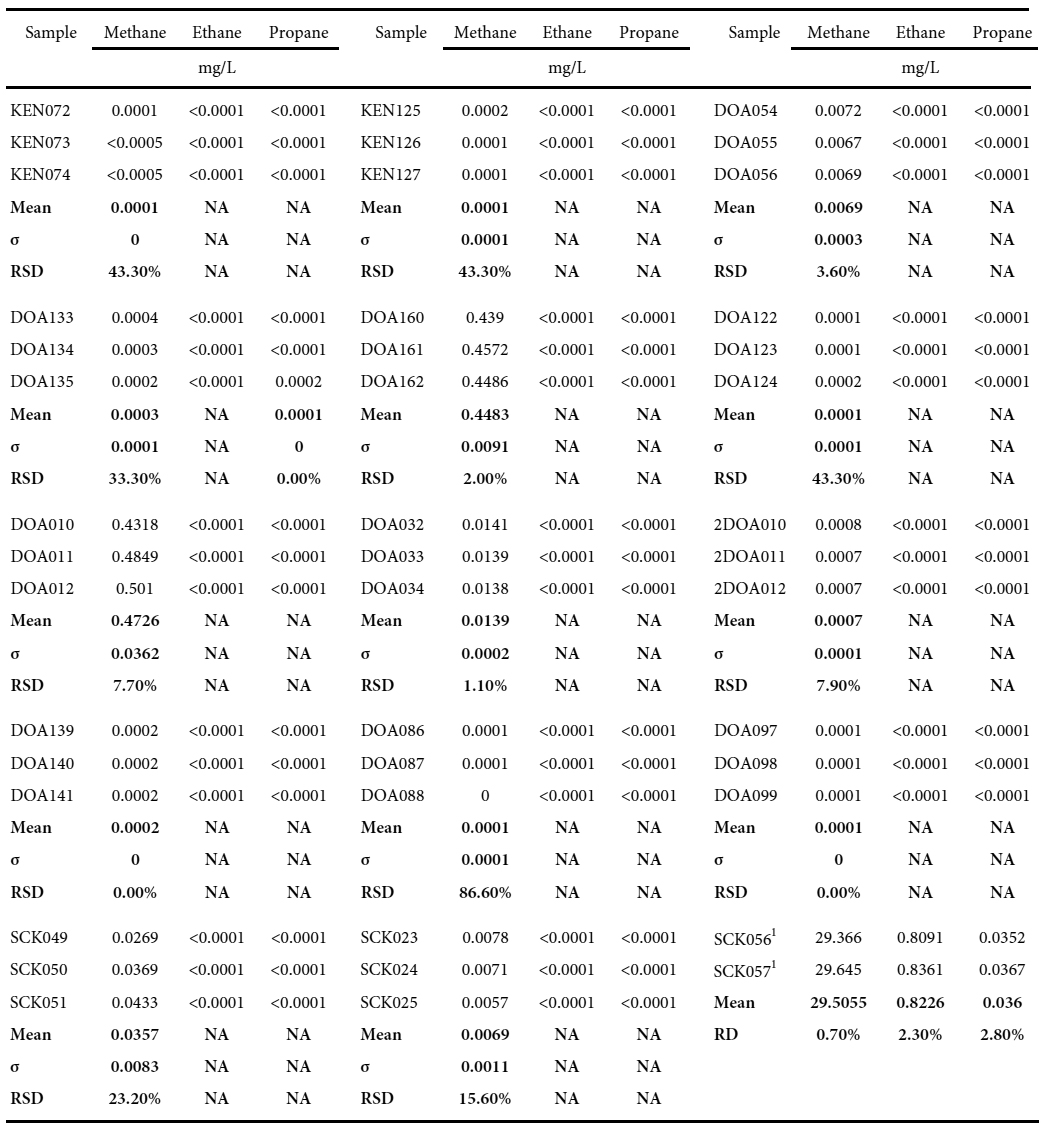
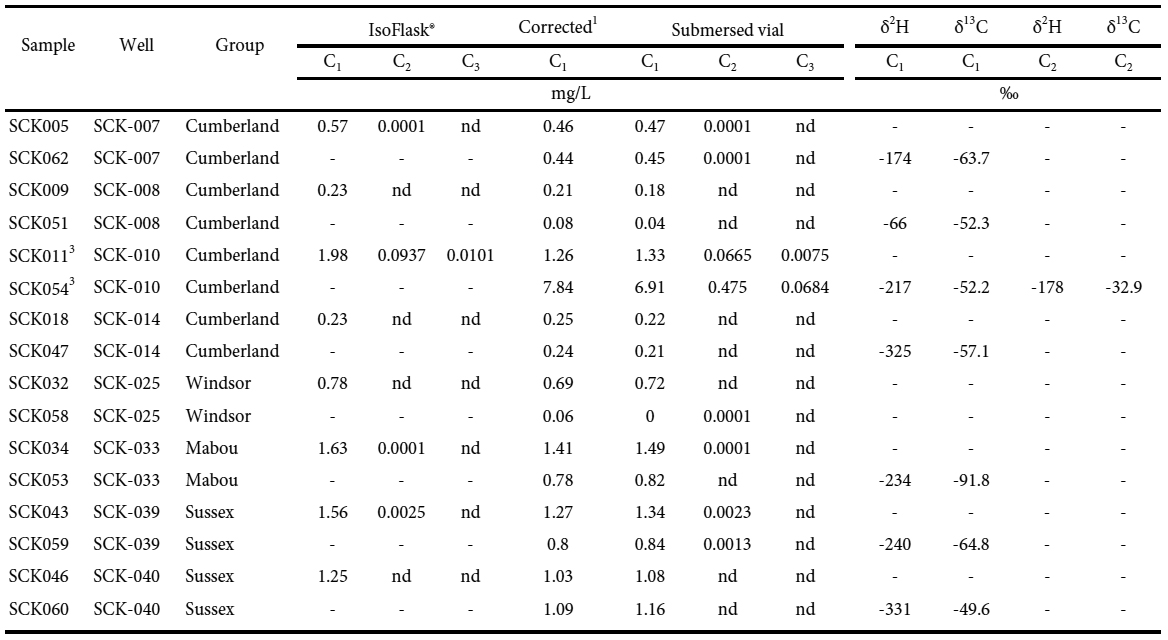
10 All water wells had standard 15-cm-diameter steel casing through overburden and were completed as open holes in bedrock, or with slotted well screens when completed in unconsolidated sediments or erodible shale. Well depths ranged from 6 to 88 m, with a median depth of 37 m. The wells supplied water to private homes, businesses or farm buildings and had pressure tanks to maintain relatively constant pressure. All samples were collected upstream of any water treatment systems present. Sampling and analysis followed the procedures described in Loomer et al. (2016, 2018) and Loomer and MacQuarrie (2018). Samples were collected upon stabilization of the field parameters (pH, specific conductance, dissolved oxygen and Eh). Samples for dissolved hydrocarbon gases were collected using the submersed vial method. Analyses for the molecular composition of the hydrocarbon gases were conducted at the Research and Productivity Council in Fredericton, New Brunswick, using a Bruker Gas Chromatograph coupled to a Flame Ionization Detector (method AQS90). The results from the headspace analyses were converted to aqueous concentrations using Henry’s Law. The instrument detection limit was 0.0001 mg/L and the detection limit based on field blanks was 0.0005 mg/L for C1 and 0.0001 mg/L for C2 and C3. Results from field blank and replicate samples are provided in Tables A1 and A2 in Appendix A. The presence/absence of ethene (C2=), propene (C3=), butane, pentane and hexane (C4-C6 hydrocarbons) were also evaluated in groundwater samples from the Stoney Creek area. Standards were injected into the instrument to obtain the retention time for each compound and the GC software CompassCDS™ (Scion Instruments, Edmonton, Alberta) was used to identify peaks in the two sample chromatographs (Appendix B). Quantification of C2=, C3=, and C4-C6 was not available.
11 Molofsky et al. (2016) found that there was a significant difference in dissolved C1 concentrations between open direct-fill, semi-closed (similar to this study) and closed (IsoFlask®) techniques when C1 concentrations were >20 mg/L. To evaluate possible losses from the sampling setup used in this work, 42 wells in the Stoney Creek area were sampled using both the submersed-vial and IsoFlask® methods (Loomer and MacQuarrie 2018). Methane concentrations determined using the IsoFlask® method were up to 15 mg/L higher than those determined from the submersed-vial method when C1 concentrations were >15 mg/L. Based on the data from Loomer and MacQuarrie (2018), the following relationship was used to correct concentrations from the submersed vial technique (vial, mg/L) to equivalent IsoFlask® concentrations (Corrected, mg/L) for samples that were not collected with IsoFlasks:
Corrected = 0.0394[vial]2 + 0.854[vial] + 0.0539 (R2 = 0.9984)
Eq. 1
12 Samples for dissolved gas isotopic analysis were collected in the same manner as for dissolved gas concentrations, either in IsoFlasks® or in submersed 700-mL glass Wheaton bottles with screw caps and butyl rubber septa, preserved with 6N HCl. Isotopic and compositional analyses for Stoney Creek produced gas and the isotopic analyses of dissolved gases in groundwater were conducted at the Ján Veizer Stable Isotope Laboratory at the University of Ottawa. The chemical composition of the gas samples (O2, CO2, N2 and hydrocarbons C1-C5) was measured using an SRI 8610C dual column gas chromatograph fitted with flame ionization and thermal conductivity detectors. Methane and ethane were extracted from the groundwater samples using the headspace equilibrium technique. Stable carbon and hydrogen isotope measurements of the hydrocarbon gases, C1 to C3 were conducted if concentrations were above 0.08% in the gas phase. The isotopic compositions of C4 and C5 were reported when their peaks in the GC could be resolved. Analyses were performed using a Thermo-Fisher Delta V Isotope Ratio Mass Spectrometer interfaced via a Conflow 4 to an Agilent 8790A gas chromatograph equipped with a combustion furnace (1000°C) for carbon oxidation to CO2, and a pyrolysis furnace (1420°C) for hydrogen conversion to H2. The National Institute of Standards certified reference standards NGS1 and NGS2 were used for the 13C and 2H in C1 calibration for groundwater samples from the Central, Kent, Shediac and Sussex study areas. For the analyses of the groundwater samples from the Stoney Creek area and the Stoney Creek production gas samples, the USGS HCG-1, -2 and -3 standards were used. The USGS standards offer standardized values for 13C and 2H in C1–C3. No certified standards were available for C4 and C5. Therefore, peak retention times were confirmed with a C1–C6 gas composition standard (Air Liquide, Ottawa), and the isotopic calibration for C3 was applied to C4 and C5. Carbon dioxide concentrations in the gas samples were too low for reliable isotopic measurements.
13 Differences in δ13C values for field duplicate gas samples ranged from 0.0–0.7‰, showing no apparent trends with carbon number or isomer. Therefore, the reported δ13C uncertainty is based on the maximum difference measured, ± 0.7‰, for all hydrocarbon gases. Differences in δ2H for duplicate samples ranged from 0.3–2.0‰, with uncertainty increasing from C1 to C3. Hold times for the dissolved gas samples varied from 1–9 weeks due to capacity limitations of the analytical laboratory. Evaluation of the effects of prolonged hold times showed no correlation between δ2H-C1 values and sample hold times; however, the δ13C1 values became progressively depleted over time (Loomer et al. 2018). Therefore, the maximum estimated uncertainty in δ13C1 based on the regression analysis presented in Loomer et al. (2018) and the hold times for samples in this study is -4.6‰. The uncertainty in δ2H-C1, based on duplicate analyses, is ± 4.4‰.
RESULTS AND DISCUSSION
Production gas composition
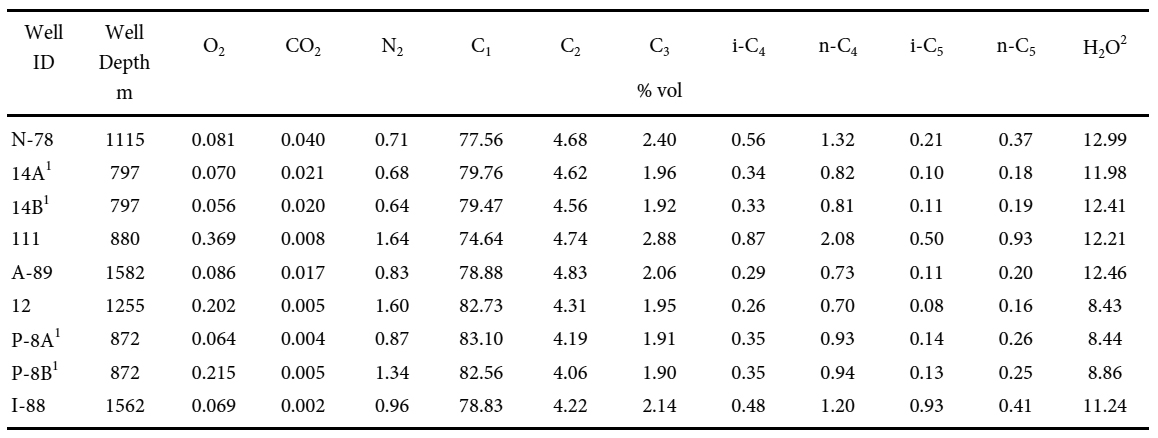
14 The SCOF gas has a narrow range of compositions and is predominantly C1 (75–83%) with minor amounts of C2 (~4%), C3 (2–3%), C4 and nitrogen (≤2% each), and C5 (<1%) (Table 1). Gas from the SCOF has a smaller range of molecular ratios, C1/(C2+C3), from 10 to 14, than gas from the MCGF, which ranges from 9 to 59 (Barton 2018). The concentrations of n-C4 and n-C5 are greater than those of their respective branched isomers. Only trace amounts of carbon dioxide (≤0.05%) were detected. There are no trends in molecular or isotopic composition versus depth in the range sampled. The average δ13C-C1 and δ2H-C1 values of gas from the SCOF, -42‰ and -221‰, respectively, are less enriched in 13C and 2H than those for gas from the MCGF, -36‰ and -168‰, respectively (Barton 2018). The SCOF samples are indicative of a mature thermogenic gas formed with oil, whereas those of the MCGF are indicative of a post-mature wet gas (Ni et al. 2011; Milkov and Etiope 2018).
 Display large image of Table 1
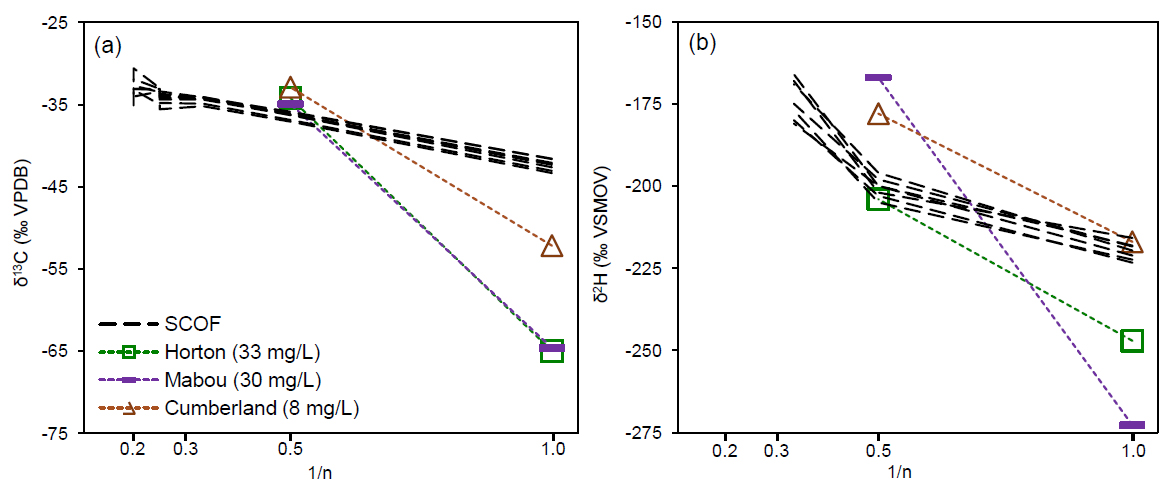
15 All Stoney Creek gas samples display a straight-line isotopic profile from C1 to C3 (R2 = 1.000), where δ13C1 <δ13C2 <δ13C3 (Fig. 3a). This trend is consistent with that predicted by kinetic isotope effect (KIE) models (Chung et al. 1988; Berner et al. 1995). While there is little expectation that butanes and pentanes had the same precursor functional group or formation mechanism (Chung et al. 1988), 61% of the higher weight hydrocarbons also fall, within error, along the C1-C3 straight lines. The progressive increase of δ13C values from C1 to C3 represents a “normal” isotopic profile for the Dawson Settlement member in the SCOF. McCully gas samples from the Hiram Brook member also show a normal isotopic profile, but those of the Frederick Brook member display a partial or full isotopic reversal, δ13C1 >δ13C2 ≤δ13C3 (Barton 2018). Isotopic reversal is thought to occur in closed-system, or near-closed-system source rock. As a level of advanced maturity is reached, and with little exchange with adjacent formations, the longer chain hydrocarbons become unstable and decompose to produce 13C-enriched C1 in the source rock (Tilley and Muehlenbachs 2013).
 Display large image of Figure 3
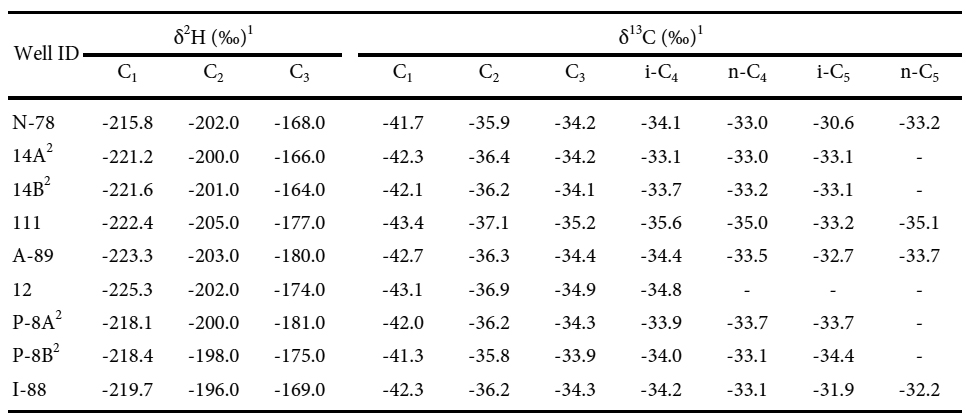
16 In contrast to the δ13C profile, δ2H values in the SCOF gas (Table 2), although not displaying isotopic reversal, do not exhibit a straight-line profile from C1 to C3 (Fig. 3b). Hydrogen isotope data for hydrocarbon gases of higher weight than C1, e.g., C2 up to C5, have not been reported as commonly as δ13C because of analytical limitations and the difficulties for interpretation posed by the possibility for hydrogen isotope exchange with external sources (Schimmelmann et al. 2006). In cases where δ2H data are reported with δ13C values, the isotopic profiles for δ13C and δ2H have been internally consistent, i.e. the two profiles show similar trends (Burruss and Laughrey 2010; Wang et al. 2015; Barton 2018). It is not clear why the SCOF samples show different trends in the isotopic profiles for δ13C and δ2H. However, the non-linear δ2H profile is consistent with the quantum-chemistry-based cumulative KIE model of Ni et al. (2011). Ni et al. (2011) show that for δ2H-C2 values near those of the SCOF, i.e., -200‰, the KIE model profile is non-linear, but not reversed. The quantum KIE model straightens with both increasing and decreasing thermal maturity. Therefore, both the straight δ13C and kinked δ2H profiles of the SCOF gases are consistent with KIE models.
 Display large image of Table 2
17 Overall, the SCOF gas is distinct from the gas produced from the MCGF, and the tight clustering suggests a common source for the SCOF samples despite the range in well depths and the possibility of contributions from multiple production zones. The lower maturity of the SCOF gas suggests that the Horton Group in the northeastern part of the Moncton subbasin did not reach the burial depths experienced at the MCGF, estimated by Park (2014) to be 5 km and 125 to 150 °C, respectively, assuming a geothermal gradient of 2.5 to 3°C/100 m. This is consistent with previous interpretations of increasing thermal maturity of the Moncton subbasin from the northeast to the southwest (Chowdhury 1991). The presence of significant quantities of both oil and gas in the SCOF, combined with the isotopic data, places the SCOF in the later stages of the oil window, at temperatures of ~90–120°C and a burial depth of 3–4 km (assuming a geothermal gradient of 3°C/100 m).
18 The molecular and isotopic compositions of gas from the SCOF and MCGF are used as reference points in the following evaluation of hydrocarbons in shallow groundwater. Similarities between the hydrocarbons associated with the deep ONG fields and hydrocarbons detected in shallow groundwater can be an indication of connections between the deep hydrocarbon reservoirs and the shallow aquifers (Sharma et al. 2014). Such connections could include leaking ONG wells and naturally transmissive faults.
Hydrocarbon gases in shallow groundwater
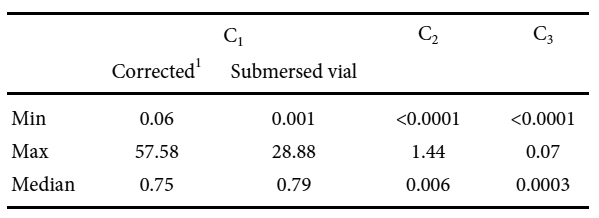
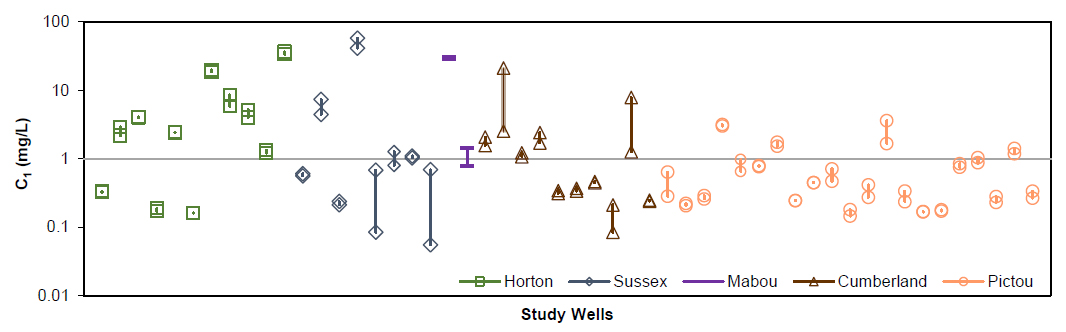
19 Dissolved C1 concentrations in the shallow groundwater ranged from 0.06 to 58 mg/L (Table 3). The IsoFlask® correction increases the highest value measured with the submersed vial method from 29 to 58 mg/L (Table A3 in Appendix A). The methane concentration during resampling of this well dropped to 41 mg/L, representing a 30% decrease, but still indicative of a persistent, elevated methane concentration. Ninety percent of the wells sampled had C1 concentrations <10 mg/L, and the difference between the Isoflask-corrected values and the values reported from the submersed vial method was ≤1 mg/L for those samples. The median difference in concentration between the submersed vial and the Isoflask-corrected concentrations was 0.01 mg/L. The sample with the highest C1 concentration is from the Sussex area, whereas the two wells from which the next highest C1 concentrations were observed (30 and 36 mg/L) are from the Stoney Creek area. Water samples from wells completed in the Horton Group generally tend to have higher C1 concentrations, while those from the Pictou Group tend to have lower concentrations (Fig. 4). Some samples from the Sussex, Mabou and Cumberland groups show C1 concentrations that are equally high, or higher, than the highest observed in the Horton Group. However, samples from the Sussex and Cumberland groups show greater variability in C1 concentrations between different wells and between sampling events for individual wells. This suggests that these units may exhibit more variability in hydrogeochemical conditions, as observed by Loomer et al. (2018) in a time-series study.
 Display large image of Table 3
 Display large image of Figure 4
20 Ethane and propane were detected in 48% and 34% of the samples, with maximum concentrations of 1.9 mg/L and 0.07 mg/L, respectively. Higher weight hydrocarbons, C4–C6, were detected in two Stoney Creek area water wells: one completed in Mabou Group bedrock containing 30 mg/L C1 and the other in Cumberland Group bedrock containing 1–8 mg/L C1 (Table A3 in Appendix A). Hydrocarbons from C1 to C7 have been found to be produced biogenically (D’Hondt et al. 2004; Whelan et al. 1980; Vogel et al. 1982), and therefore, their presence does not rule out the possibility of a biogenic source. However, their presence, coupled with the low C1/(C2+C3) ratios, <75, implies a thermogenic origin.
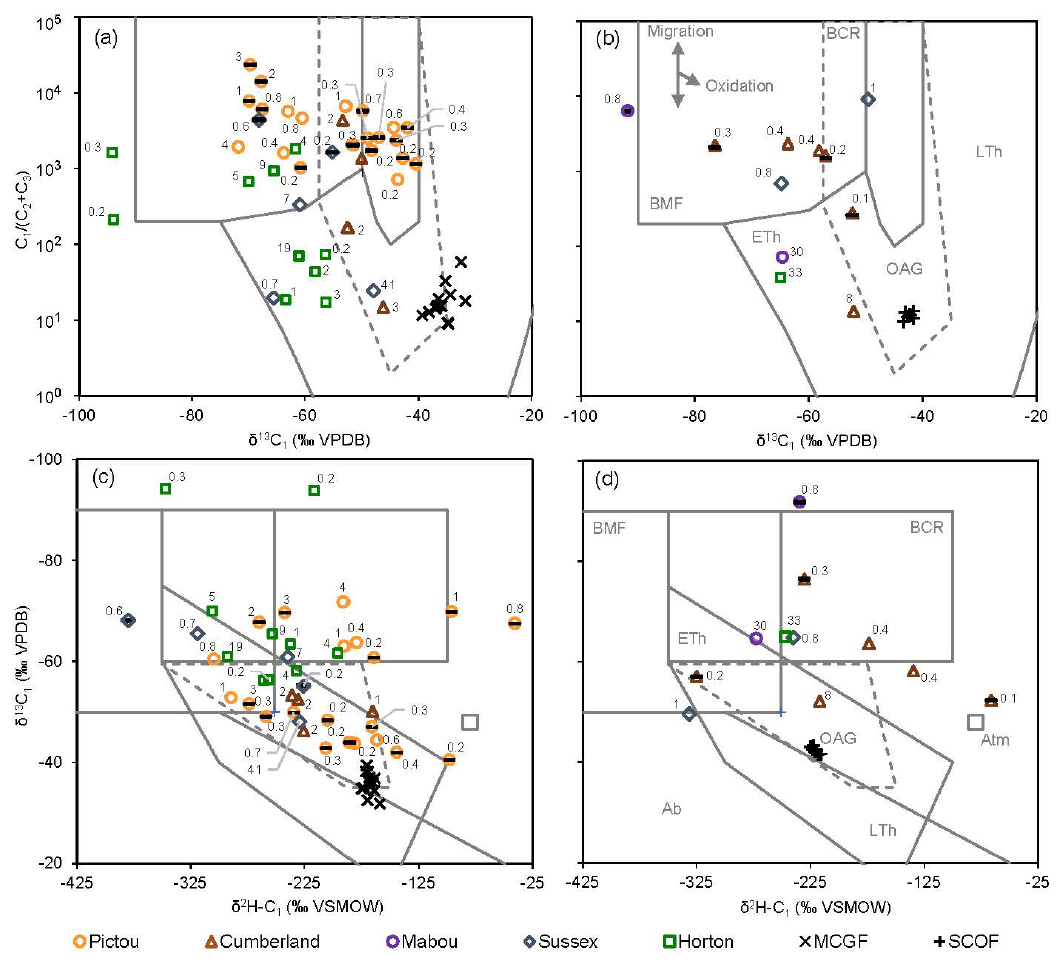
21 Many researchers use molecular and isotopic discrimination diagrams to infer the C1 source (Bernard et al. 1976; Schoell 1983; Whiticar 1999). However, it has long been recognized that, at low concentrations, secondary isotopic fractionation related to C1 oxidation, solubility-controlled fractionation, mixing and/or diffusive transport may alter the isotopic composition from that of the original source (Fuex 1980; Whiticar 1994; Milkov and Etiope 2018). Therefore, additional lines of evidence to distinguish between possible sources are required. Researchers have utilized other geochemical data such as the noble gases (Darrah et al. 2014), groundwater inorganic geochemistry (Lautz et al. 2014), and sulphur isotopes and geochemical modeling (Humez et al. 2019). Here we use additional hydrocarbon compositional data coupled with geological information to support gas-origin interpretations. Source discrimination is considered unreliable when C1 concentrations are below 100 ppb in the gas phase (Whiticar 1994). The corresponding aqueous concentrations in equilibrium with such a gas phase would range from 1–5 mg/L (assuming a pressure range of 1–5 atm and a temperature range of 5–25°C). As 42 of the 52 wells sampled in this study have C1 concentrations <5 mg/L, the C1 concentrations have been superimposed on the discrimination diagrams in Fig. 5 to aid assessment of the data. Twelve of the 23 samples from the baseline study areas having C1 concentrations ≤1.0 mg/L fall outside the recognized biogenic and thermogenic zones (Fig. 5a). They also fall outside the range of values representative of mixing between biogenic and thermogenic sources, suggesting the possibility of secondary oxidation. Furthermore, inconsistencies exist between the Bernard et al. (1976) and Whiticar (1999) classifications of these samples (Figs. 5a, c). In the Bernard diagram, they are distinct from the MCGF. In the Whiticar diagram, the samples appear to be much closer in composition to the MCGF, but they fall within the overlapping thermogenic and oxidized biogenic zones in the diagram. All but one of the samples were collected from wells completed in Pictou Group bedrock. All Pictou Group samples that have relatively low C1 concentrations, < 4 mg/L, and biogenic or oxidized C1 isotopic signatures, are from the Central, Kent or Shediac study areas (Fig. 6). These areas have not been subject to ONG development and, while a thermogenic source cannot be completely ruled out, coupling the results from the two discrimination diagrams and the low C1 concentrations, the samples are thought to represent biogenic methane that has undergone partial oxidation. The apparent effects of oxidation on the isotopic composition at low C1 concentrations are consistent with the findings of Humez et al. (2016). Only two groundwater samples from the Stoney Creek area show the effects of C1 oxidation (Fig. 5b). One of them (completed in Sussex Group bedrock) has a high C1/(C2+C3) ratio and, based on its location on the Whiticar plot, appears to represent oxidized C1 formed from methyl-type fermentation (Fig.5d). There are also five samples in the study with δ2H-C1 values indicative of extreme enrichment in 2H from oxidation, approaching or surpassing the enriched δ2H-C1 value of -80‰ commonly observed in atmospheric C1 (Whiticar 1999).
 Display large image of Figure 5
 Display large image of Figure 6
22 Multiple samples from water wells completed in the Horton Group show conflicting signatures, with several samples plotting within the early thermogenic zone in the Bernard diagram (Figs, 5a–b), but falling within the biogenic zones in the Whiticar diagrams (Figs. 5c–d). In either classification system, the groundwaters have molecular and isotopic compositions that are distinct from the oil-associated gas and late thermogenic Horton Group signatures in the ONG fields. This suggests that alteration from migration, oxidation and/or mixing between multiple sources has occurred. Overlap between the classification zones in the recently revised Bernard and Whiticar diagrams (Milkov and Etiope 2018) further complicates interpretation. Therefore, a biogenic influence is possible in the well with 30 mg/L C1 completed in Mabou Group bedrock. This is the well with a detectable C4–C6 fraction and a relatively low C1/ (C2+C3) ratio, which is more consistent with a thermogenic origin. Hydrocarbons have been recognized in Mabou Group rock; however, analysis indicated the presence of heavy crude with no fraction <C20 detected (Jiang et al. 2016). Based on data from St. Peter and Johnson (2009), the Horton Group is located approximately 80–90 m below the bottom of this well and may represent the source for the hydrocarbons. If the Horton Group is the source for elevated C1 concentrations in the well water, then the original thermogenic signature has been overprinted by biological activity. It is recognized that C1 is the terminal product in the anaerobic biodegradation (reduction) of a wide range of petroleum hydrocarbons, including C2 (Milkov and Dzou 2007; Scott et al. 1994). For the Mabou Group well and two other wells in the Stoney Creek area with C2 concentrations > 0.1 mg/L, the δ13C2 values are enriched by 1–4‰ relative to gas from the SCOF (Fig. 3a). This enrichment is consistent with C2 from a residual pool after C2 reduction (Milkov and Dzou 2007). However, the corresponding δ13C1 values are depleted by 9–23‰ relative to gas from the SCOF, consistent with the effects of significant biogenesis (Chung et al. 1988). Therefore, methanogenesis from the reduction of C2 and higher weight hydrocarbons may explain the apparent contradictory molecular and isotopic data. The carbon isotopic indicators of C2 reduction and methanogenesis are also reflected in the hydrogen isotopes (Fig. 3b), with some minor inconsistency, which is common (Schimmelmann et al. 2006). During the anaerobic biodegradation of higher molecular weight hydrocarbons, C1 formation through both the acetate fermentation and CO2 reduction pathways is possible (Zengler et al. 1999). Methanogenesis under these circumstances may explain the apparent mix of methyl-type fermentation and carbonate reduction in the Horton and Mabou group samples from the Stoney Creek area (Fig. 5d). Together, these factors suggest that methanogenesis is occurring in the bedrock near these wells, causing an overprinting of an original thermogenic isotope signature. The methanogenesis is likely supported by the organic-rich bituminous shales of the Horton Group.
23 In contrast to the Horton Group, groundwater with the highest C1 concentrations from the Sussex and Cumberland groups show consistent thermogenic isotopic signatures in the Bernard and Whiticar diagrams (Fig. 5). They also plot closer to the ONG field gases, indicating a greater potential for a direct relationship between the C1 in shallow groundwater and the ONG fields. The sample with the highest C1 concentration in the study — 58 mg/L during the first sampling and 41 mg/L during the second sampling — is from a well completed in the Sussex Group and is located 3,500 m from the nearest ONG well. Provincial records indicate that the ONG well is a 378-m-deep abandoned exploration well that dates to 1913. It is not thought to represent a source of hydrocarbon gases to the water wells. Possibly a localized hydrocarbon source occurs within the Sussex Group strata; however, the well is also within 95 m of an inferred boundary with the Horton Group. Furthermore, based on data from Hinds (2008), the Horton Group is located approximately 100 m below the bedrock surface at that location. Therefore, migration from the hydrocarbon-bearing Horton Group is the most likely source for the gases in that water well. One of the wells in Cumberland Group bedrock with C1 indicative of a thermogenic signature displayed variable concentrations, ranging from 21 to 3 mg/L, between the first and second sample events. The decrease is likely associated with the inactive water well being put into regular use after the first sample was collected. An interview with the owner of the well revealed that the well driller hit a pocket of gas at the time of drilling. The well is located near the Village of Elgin and predates unconventional ONG exploration activities in the area, which commenced in 2009 (AMEC 2014; NBDELG 2017). Therefore, the presence of thermogenic C1 in the shallow groundwater is thought to be natural. Elevated C1 concentrations have also been observed in other Cumberland Group wells located along the southeastern margin of the Moncton subbasin (Loomer et al. 2019). In that area, the Cumberland Group forms a thin cover directly over the Horton Group and hydrocarbon gases may be migrating upward into the overlying Cumberland Group. The preservation of a thermogenic signature in overlying Sussex and Cumberland sequences demonstrates that there are instances where C1 may be migrating from the underlying Horton Group without alteration of the original isotopic composition. Fracture-controlled transport is likely, as complex and highly conductive fracture networks have been observed in the Cumberland Group elsewhere in the Moncton subbasin (DesRoches et al. 2013).
24 Another of the Cumberland Group water wells, located within the main footprint of the SCOF (Fig. 6), displayed C1 concentrations ranging from 1 to 8 mg/L and it also had detectable C2–C5 fractions. The isotopic composition of the C1 indicates a thermogenic origin, and the hydrocarbons may be related to historic or current SCOF development activities. However, published cross-sections of the SCOF (Chowdhury et al. 1991; St. Peter and Johnson 2009; Park 2014) indicate that the Horton Group is located at a depth of 90 m at that location, approximately 45 m below the bottom of the water well. Therefore, the elevated C1 concentrations could also be natural, due to migration from the Horton Group. Two other water wells sampled within the footprint of the SCOF did not have C1 concentrations high enough for isotopic analyses (Loomer and MacQuarrie 2018). Given the elevated C1 concentrations observed outside the footprint of the SCOF and in other areas of the province, there is not sufficient evidence to indicate that resource extraction activities at the SCOF have caused C1 in shallow groundwater to be elevated above background levels.
CONCLUSIONS
25 In this work we have compiled molecular and isotopic composition data from two regional groundwater studies and compared them to the molecular and isotopic composition data from ONG fields in New Brunswick with the objective of identifying relationships between hydrocarbons found at depth and those observed in shallow groundwater. New isotopic data from the SCOF indicate that a wet thermogenic gas was co-produced with oil in the ONG field. The gas was likely generated under conditions near the onset of the oil-gas transition zone and the δ13C and δ2H isotopic profiles are consistent with KIE models. The gas currently produced from the SCOF has a lower thermal maturity than that of the MCGF.
26 The effects of oxidation on the isotopic composition of carbon and hydrogen in aqueous C1 are apparent when C1 concentrations are low (≤1 mg/L). Data from these low C1 samples can lead to conflicting interpretations when considering multiple source-discrimination approaches and we found that including the C1 concentrations can help decipher the apparent contradictions. All groundwater samples from the Pictou Group have low C1 concentrations (≤4 mg/L), and the presence of thermogenic gas in this geologic unit is considered unlikely. Elevated C1 concentrations (>5 mg/L) were observed in groundwater samples from bedrock in the Horton, Sussex, Mabou and Cumberland groups. Multiple samples from wells completed in the Horton Group also show conflicting biogenic/ thermogenic signatures despite gases from the Horton Group having different and distinct thermogenic signatures at depth. The possible influence of biogenic activity is also evident in a well completed in the Mabou Group. Conflicting molecular, C1-C6, and isotopic, δ13C1 and δ13C2 data from these wells suggest that biological activity has overprinted an original thermogenic source in near-surface Horton Group bedrock. Therefore, the isotopic composition of dissolved hydrocarbon gases in shallow groundwater may be subject to considerable alteration not only at low C1 concentrations, but also at elevated concentrations. This has major implications for the understanding of baseline methane occurrences should ONG development proceed in the Maritimes Basin. Future baseline study design and interpretation should be evaluated within this context. Multiple lines of evidence are required for reliable interpretations concerning hydrocarbon origins.
27 Thermogenic isotopic signatures occur in samples with elevated C1 concentrations from several locations where bedrock of Sussex, Mabou or Cumberland group directly overlies the Horton Group. This suggests C1 may be migrating through natural pathways from the Horton Group without significant alteration of the isotopic composition. Fracture-controlled transport is the most likely explanation.
ACKNOWLEDGEMENTS
Funding for this project was provided by the New Brunswick Energy Institute (of which Tom Al was a member of the scientific advisory council) and by Natural Resources Canada, as part of the project Assessing methane emissions from legacy fossil resource development and methane mitigation potential in Atlantic Canada, led by Grant Wach of Dalhousie University. Scholarship funding for Diana Loomer has been provided by the Natural Sciences and Engineering Research Council of Canada, the University of New Brunswick, the O’Brien Foundation and Engineers and Geoscientists New Brunswick.
We would like to acknowledge the well owners who volunteered for this study and the valuable contributions of Ian Bragdon (field and laboratory support), Heather Loomer (field and data management support), Dennis Connor, Christine Chase, Jessica Leblanc, Thomas Lewey and Brian Nason (field support). We appreciate the technical support of Diane Botelho (Research and Productivity Council, Fredericton) and Steve Hinds and Tom Howard (New Brunswick Department of Energy and Resource Development). We would also like to express our appreciation to the anonymous reviewers for helping us improve the manuscript.
REFERENCES
Editorial responsibility: Robert A. Fensome
APPENDIX A
 Display large image of Table A1
 Display large image of Table A2
 Display large image of Table A2
 Display large image of Table A3
 Display large image of Table A3
 Display large image of Table A3