Article
Deglaciation of Penobscot Bay, Maine, USA
doi:10.4138/atlgeol.2020.006
Abstract
The Pond Ridge and Pineo Ridge moraines in downeast Maine likely formed at ~16.1 and ~15.7 ka respectively, during cold episodes recorded by δ18O dips in the GRIP ice core. The elapsed time between these ages is broadly consistent with retreat rates recorded by intervening De Geer moraines, which are readily visible on LiDAR imagery and are believed to be approximately annual. North-northwestward from the southwesterly extension of the Pond Ridge moraine there are three pairs of prominent moraines that are relatively continuous across the study area and could be reliably extrapolated across intervening water bodies. Retreat rates recorded by De Geer moraines suggest that these pairs formed at 15.7-15.8 ka, 15.5-15.6 ka, and ~15.5 ka. Although retreat appears to have occurred slightly faster across Penobscot Bay, a significant calving bay does not seem to have developed there. Instead, the ice margin remained relatively straight, retreating to the north-northwest. De Geer moraines become more widely spaced northward and vanish after ~15.5 ka when the ice margin was north of the head of Penobscot Bay and of Pineo Ridge. This likely reflects higher retreat rates during the initial phases of the Bølling warm period. Just south of Pineo Ridge there were two ice lobes; one retreated to the north and one to the northwest. The latter retreated more rapidly, while the former experienced numerous minor readvances and stillstands until finally pausing at the location of Pineo Ridge. A stillstand of this lobe then resulted in deposition of the Pineo Ridge moraine complex.
Résumé
Les moraines de Pond Ridge et de Pineo Ridge, dans le sud-est du Maine, se sont probablement formées à ~ 16,1 et ~ 15,7 ka, respectivement, lors d’épisodes froids enregistrés par des baisses de δ18O dans la carotte de glace GRIP. Le temps écoulé entre ces âges est globalement cohérent avec les taux de recul enregistrés par les moraines intermédiaires de De Geer, qui sont facilement visibles sur l’imagerie LiDAR et sont estimés être approximativement annuels. Au nord-nord-ouest de l’extension sud-ouest de la moraine de Pond Ridge se trouve trois paires de moraines proéminentes qui sont relativement continues dans la zone d’étude et pourraient être extrapolées de manière fiable à travers les plans d’eau interposés. Les taux de recul enregistrés par les moraines De Geer suggèrent que ces paires se sont formées à 15,7-15,8 ka, 15,5-15,6 ka et ~ 15,5 ka. Bien que le recul semble s’être produit un peu plus rapidement dans la baie de Penobscot, une importante baie de vêlage ne semble pas s’y être développée. La marge de glace est plutôt restée relativement droite, reculant vers le nord-nord-ouest. Les moraines De Geer deviennent plus largement espacées vers le nord et disparaissent après ~ 15,5 ka lorsque la marge de glace était au nord de la baie Penobscot et de Pineo Ridge. Cela reflète probablement des taux de retraite plus élevés pendant les phases initiales de la période chaude de Bølling. Juste au sud de Pineo Ridge, il y avait deux lobes de glace; l’un s’est retiré au nord et l’autre au nord-ouest. Ce dernier a reculé plus rapidement, tandis que le premier a connu de nombreux avancements mineurs et pauses jusqu’à ce qu’il s’arrête finalement à l’emplacement de Pineo Ridge. Une immobilisation de ce lobe a ensuite entraîné le dépôt du complexe de moraine de Pineo Ridge.
[Traduit par la redaction]
INTRODUCTION
1 When and how did deglaciation of Penobscot Bay occur? These are the questions we address in this paper. One question, in particular, motivated this study: was there a calving bay?
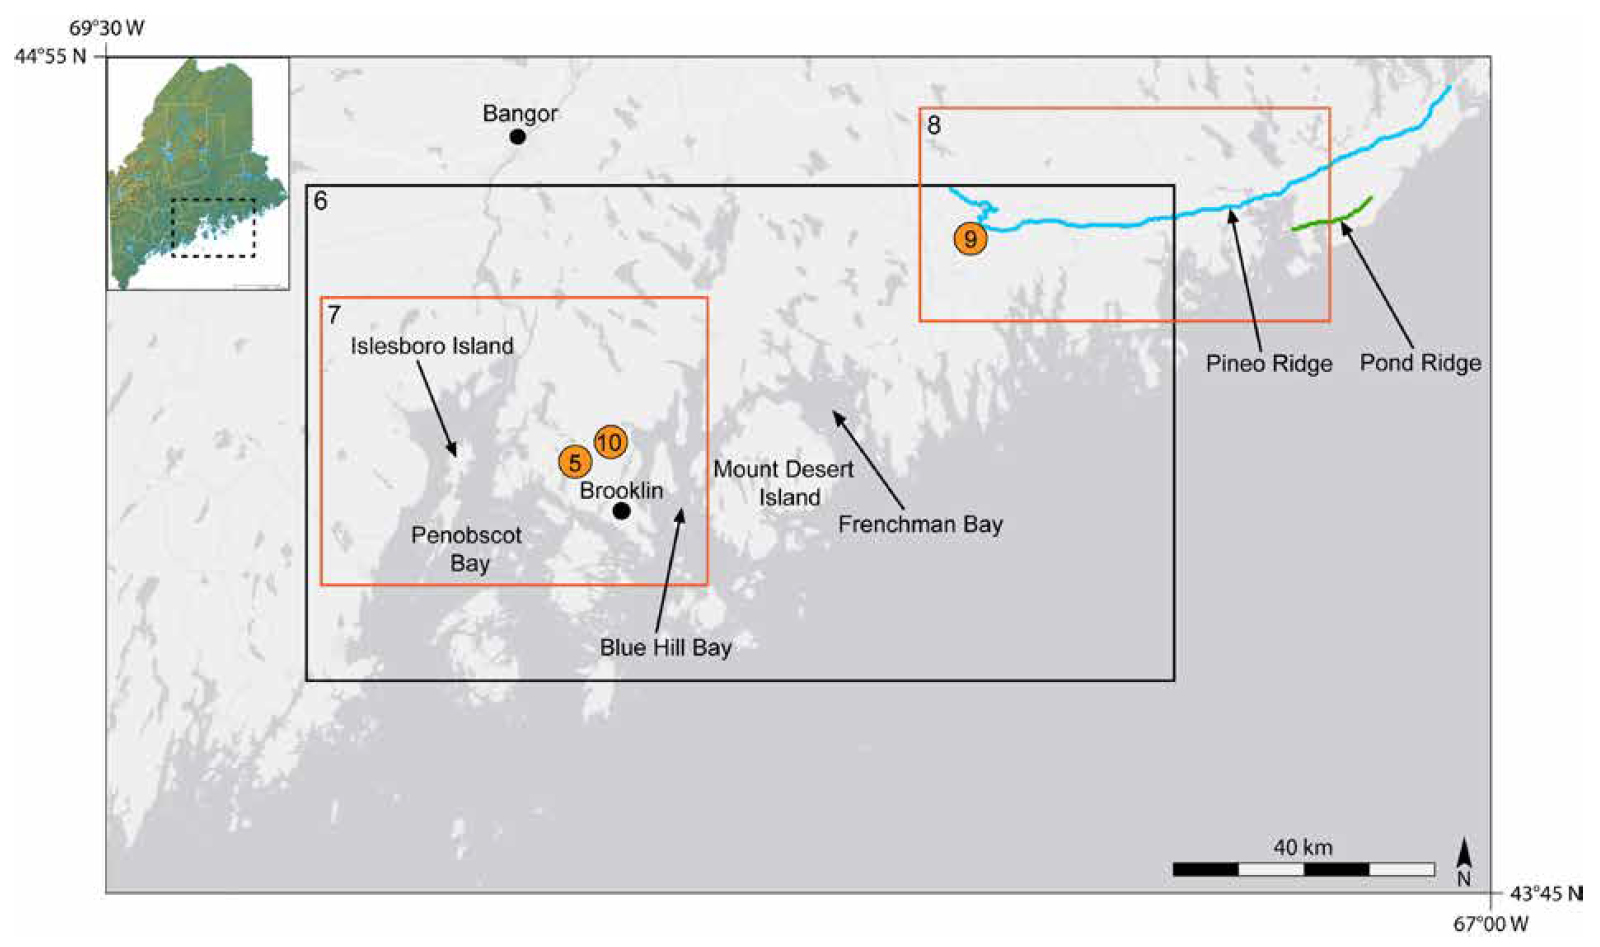
2 The reasonable suggestion that calving bays developed in Penobscot Bay (Fig. 1) and further north in the Penobscot Lowland as the Laurentide Ice Sheet retreated across coastal Maine probably originated with Terry Hughes. It was first mentioned in print by Borns and Hughes (1977, p. 204), who refer to “The lowlands of central Maine…,” which we infer to mean Penobscot Bay and the Penobscot Lowland, and who stated, without presenting evidence, that a calving bay developed in these lowlands. Lowell (1994), on the other hand, argued that the water was not deep enough to yield high calving rates, and also that access of the sea to the Lowland was through “…two narrow (<5 km wide) channels…” that would have “…prevented the invasion of an effective calving bay into Maine.”
 Display large image of Figure 1
3 Detailed mapping of striations near Bangor (see Fig. 1 for location) has demonstrated convincingly, however, that ice flow, while initially to the south, changed dramatically during the last phases of retreat. To the east of the Penobscot River, crag-and-tail features indicate that ice flow became westerly, while to the west, flow became easterly (Syverson and Thompson 2008; Thompson and Syverson 2008). The width of the zone of converging flow is <10 km, so the actual “bay” was confined to the Penobscot River valley, which is slightly less than a kilometre wide here, and <30 m deep. There remains the question of whether a calving bay developed further south, where the bay is wider and deeper (Fig. 1). One of our goals in undertaking this study was to determine whether De Geer moraines, visible on recent Light Detection and Ranging (LiDAR) imagery, provided support for the presence of a calving bay there. The LiDAR imagery we used extends from ~20 km west of the bay ~160 km eastward, and from the present coast northward to ~7 km south of Bangor, a mean distance of ~50 km (Fig. 1).
4 Another goal was to date the northward retreat of the ice sheet in Penobscot Bay and across the landscape east of the bay. To do this, we needed dates on some of the moraines. Two moraines have been dated: the Pond Ridge and Pineo Ridge moraines. The western ends of both of these lie within the study area (Fig. 1).
5 In the course of our study of the morainal landscape just south of Pineo Ridge, additional questions arose regarding the timing and character of the Laurentide Ice Sheet retreat and likely subsequent slight readvance that deposited Pineo Ridge.
AGE OF PINEO AND POND RIDGE MORAINES
6 Pineo Ridge was first described by Stone (1899, p. 111–112). Stone called Pineo a gravel plain, not a moraine, although he noticed till in the vicinity. Borns (1966) was apparently the first to recognize that Pond Ridge was a moraine and that Pineo Ridge was a delta-moraine complex. Their ages have been a topic of study ever since.
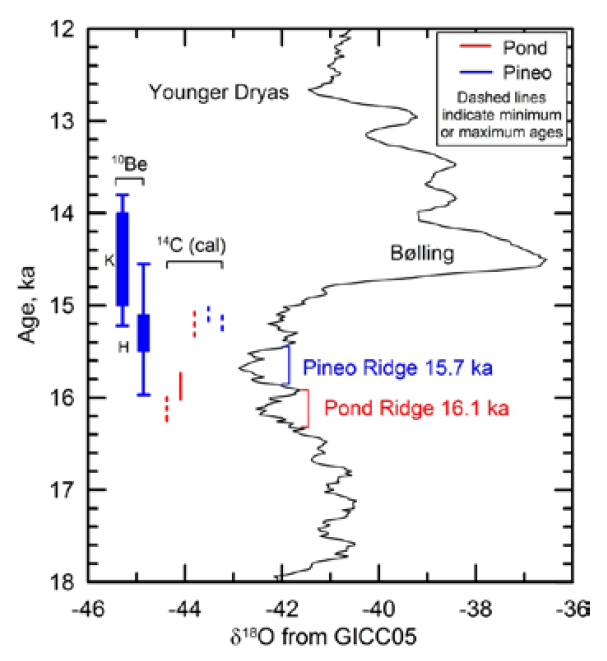
7 The earliest age estimates are radiocarbon dates, all of which we have calibrated (or recalibrated) using the most recent version of CALIB 7.1 (Stuiver et al. 2019). A 14C date on seaweed associated with the Pond Ridge moraine, 15.1 ± 0.4 ka was obtained by Stuiver and Borns (1975). More recently, Dorion et al. (2001) report three dates related to the Pond Ridge moraine. The one most closely associated with formation of the moraine, 15.9 ± 0.1 ka (Fig. 2), was on a Nucula sp. shell from glaciomarine sediments interbedded with coarse ice-proximal units on the moraine’s distal side. A maximum age of 16.1 ± 0.1 ka was obtained from a Macoma calcarea shell closely associated with ice-proximal grounding-line deposits 3 km outside the moraine. A min-imum age of 15.2 ± 0.1 ka was obtained from shells in gla-ciomarine sediments on the proximal side of the moraine. Two minimum ages for Pineo Ridge moraine, 15.2 ± 0.1 ka (Kaplan 1999) and 15.1 ± 0.1 ka (Dorion et al. 2001; Fig. 2), were obtained from shells in lake sediments a few kilometres inside the moraine.
 Display large image of Figure 2
8 As these dates were from marine organisms, they required a marine reservoir correction. Reservoir corrections vary both spatially and temporally. Along the perimeter of the Gulf of Maine, McNeely et al. (2006) report 22 values ranging from 430 to 730 years. By comparing dates on shells and on associated logs in the Presumpscot Formation near Portland, Maine, Thompson et al. (2011) inferred a reservoir age of 1000 years. The mean of these 23 estimates is 587 years. We rounded this up to 600 years when calibrating the above dates. This value was also used by Schnitker et al. (2001) and by Borns et al. (2004).
9 10Be exposure ages have also been obtained on the Pineo Ridge moraine. Hall et al. (2017) dated twelve boulders on the proximal side of the moraine (Fig. 2). Three, ranging in age from 16.2 to 17.0 ka, were deemed outliers; the remaining nine yielded a peak age of 15.3 ± 0.7 ka on a “camel” plot. The uncertainty includes uncertainty in the production rate. Koester et al. (2017) dated seven boulders on a moraine projecting southward from beneath the Pineo delta, yielding an age of 14.5 ± 0.7 ka. As the moraine would have been below sea level when the Pineo delta formed and for some time thereafter, the young age is likely due to shielding by water (Hall et al. 2017).
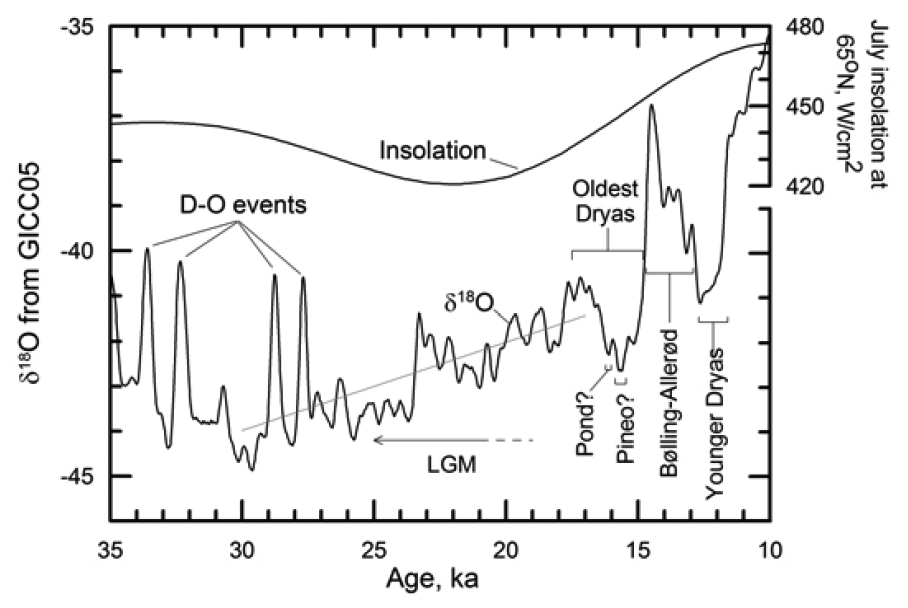
10 In the Greenland Ice Core Project (GRIP) ice core, there are two dips to more negative δ18O values during the Older Dryas (Fig. 3), one at 16.1 ± 0.2 ka and a larger one at 15.7 ± 0.2 ka (GICC05 chronology from Andersen et al. 2006). The ages are based on multi-parameter counting of annual layers (Andersen et al. 2006) and the uncertainties are based on the maximum counting error and are approximately ±2σ. These dips reflect brief periods of colder climate.
11 Between 17.8 and 16.7 ka, the mean δ18O in the GRIP core was -40.8‰, and between 16.1 and 15.5 ka it was -42.4‰, a change of 1.6 ‰ (Fig. 2). Such a change corresponds to a decrease in mean annual temperature of ~5°C at the core site (Buizert et al. 2014; Fig. 3). In ice cores from central and northern Greenland, such temperature changes are believed to largely reflect changes in winter temperatures (Denton et al. 2005; Buizert et al. 2014). The change in summer tempera-ture is only about one third of that in winter (Denton et al. 2005, p. 1169). Thus, the 5°C decrease in mean annual tem-perature likely resulted from a ~2.5°C decrease in summer temperature and a ~7.5°C drop in winter temperature; the annual temperature range would thus have increased ~5°C.
 Display large image of Figure 3
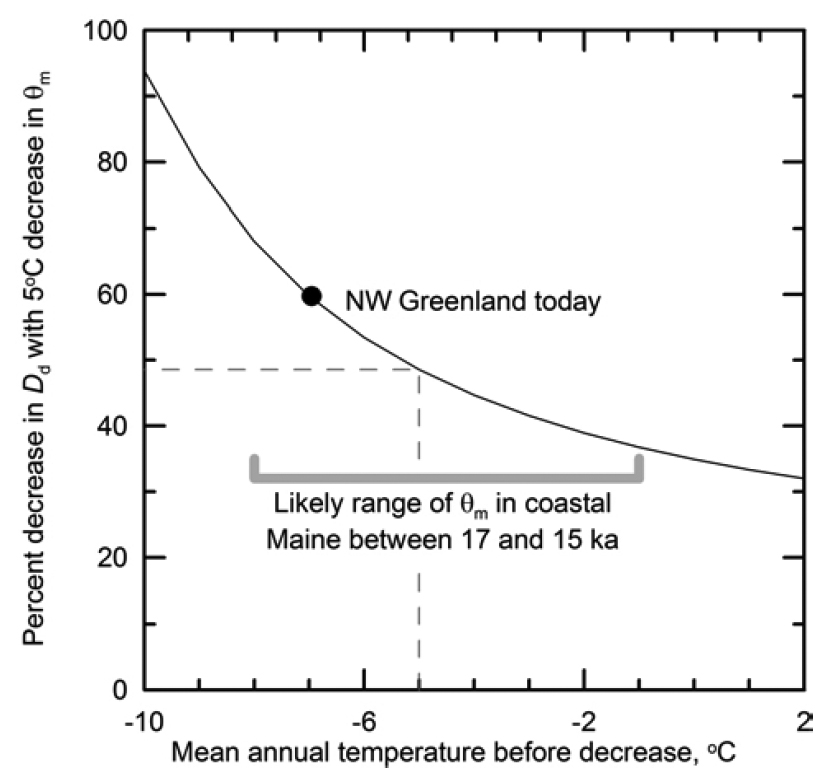
12 As ablation is closely related to the number of positive degree days (e.g., Braithwaite 1995), we next investigate the change in positive degree days implied by this cooling. We approximate the annual temporal temperature cycle by a sinusoidal function, 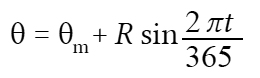 Display large image of Equation 1 where θ is the temperature, θm is the mean annual temperature, R is half the annual temperature range, and tis the time in days. The number of positive degree days, Dd, is then:
 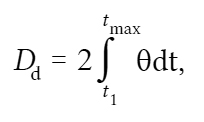 Display large image of Equation 2 where
 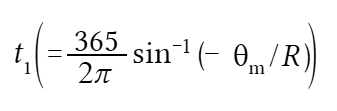 Display large image of Equation 3 is the day when the temperature first rises above 0°C and
 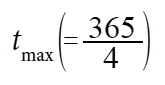 Display large image of Equation 4 is the maximum summer temperature. Carrying out the integration yields:
 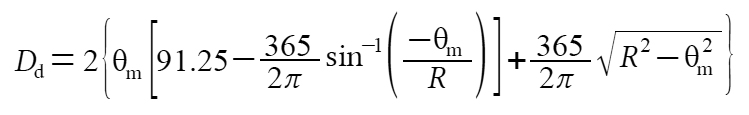 Display large image of Equation 5
13 Let’s first choose R = 13°C to roughly match current conditions along the coast in both Maine and northwest Green-land and calculate Dd for a series of reasonable values of θm. We then decrease θm by 5°C and increase R by 2.5°C in accord with the above analysis and calculate Dd for another series of possible values of θm. Finally, we calculate the percentage change in Dd for each choice of θm (Fig. 4). For example, on the Maine coast between 17 and 16 ka, a 5°C decrease in θm from -5°C to -10°C, resulting from a 2.5°C decrease a summer temperature, a 7.5°C decrease in winter temperature, and a 2.5°C increase in R, would result in a 49% reduction in positive degree days (light dashed line in Fig. 4).
 Display large image of Figure 4
14 On the Maine coast at 17 ka, θm was likely between -1°C and -8°C. The former is based on an analysis of geomorphic features indicative of permafrost (Hooke and Fastook 2007, p. 649), and the latter is obtained by adding the present mean annual temperature difference between the GRIP site and coastal Maine, 39°C, to the 17 ka GRIP temperature (~-47°C). Thus, a 5°C cooling could have reduced Dd by between 37% and 68%. This would have had an appreciable effect on the ablation rate. Cooling episodes like the Oldest Dryas (Fig. 3) are believed to be accompanied by decreases in the strength of the Atlantic meridional overturning circulation (AMOC), and thus in an increase in sea ice in the North Atlantic (Denton et al. 2005, p. 1175). This, too, would have inhibited melting along the margin of the ice sheet in the Gulf of Maine. Thus, we think it likely that these cold events resulted in pauses in retreat of the ice sheet, or possibly slight readvances, and that they were responsible for the Pond Ridge and Pineo Ridge moraines. Supporting this interpretation is the observation that the duration and depth of the second of these coolings was significantly greater than that of the first, consistent with the appreciably larger size of the Pineo Ridge moraine complex in comparison with the Pond Ridge moraine. As shown in Figure 2, the dates of these cold events are generally slightly older than the relevant 14C and exposure age dates, although within the limits of uncertainty of some of the latter.
15 Hall et al. (2017) objected to correlating the Pineo and Pond moraines with these cold episodes. They argue that although deglaciation in Maine was characterized by “rapid ice retreat followed by a (sic) short-lived stillstand/readvance” during the Oldest Dryas, the isotope record “shows extremely cold conditions throughout” this time period. Thus, they contend that the retreat and the two stillstands or readvances could not be due to changes in air temperature. The reference Hall et al. (2017) cite for their temperature record (Alley 2000), shows data only going back to 16 ka. Based on the GRIP δ18O record (Fig. 3), the warming event that likely initiated retreat of the Laurentide Ice Sheet from its LGM position at the edge of the continental shelf, began at ~30 ka, although the actual retreat of the ice margin did not start until ~22 or 23 ka (e.g., Schnitker et al. 2001). The period from 22 ka to ~17 ka was one of gradual warming under the influence of increasing insolation (Fig. 3; Buizert et al. 2014; Koester et al. 2017); at 17 ka, when cooling started despite a continued increase in insolation (Fig. 3), the ice sheet was likely not fully adjusted to the prevailing climate. Thus, it would have continued to retreat, but would have been ripe for pauses (or slight readvances) at the times of the two cold periods centered at 16.1 and 15.7 ka.
16 In short, the 16.1 ± 0.2 and 15.7 ± 0.2 ka ages for the Pond Ridge and Pineo Ridge moraines based on the Greenland δ18O record are consistent with, but better supported than, either the 14C ages, which are prone to various uncertainties, not the least of which is the marine reservoir correction, or the 10Be exposure ages with their uncertainties. Construction of these major moraines, however, took some time. Thus, deposition of the Pond and Pineo moraines undoubtedly began prior to 16.1 and 15.7 ka, respectively, and retreat from them later than these dates.
DE GEER MORAINES
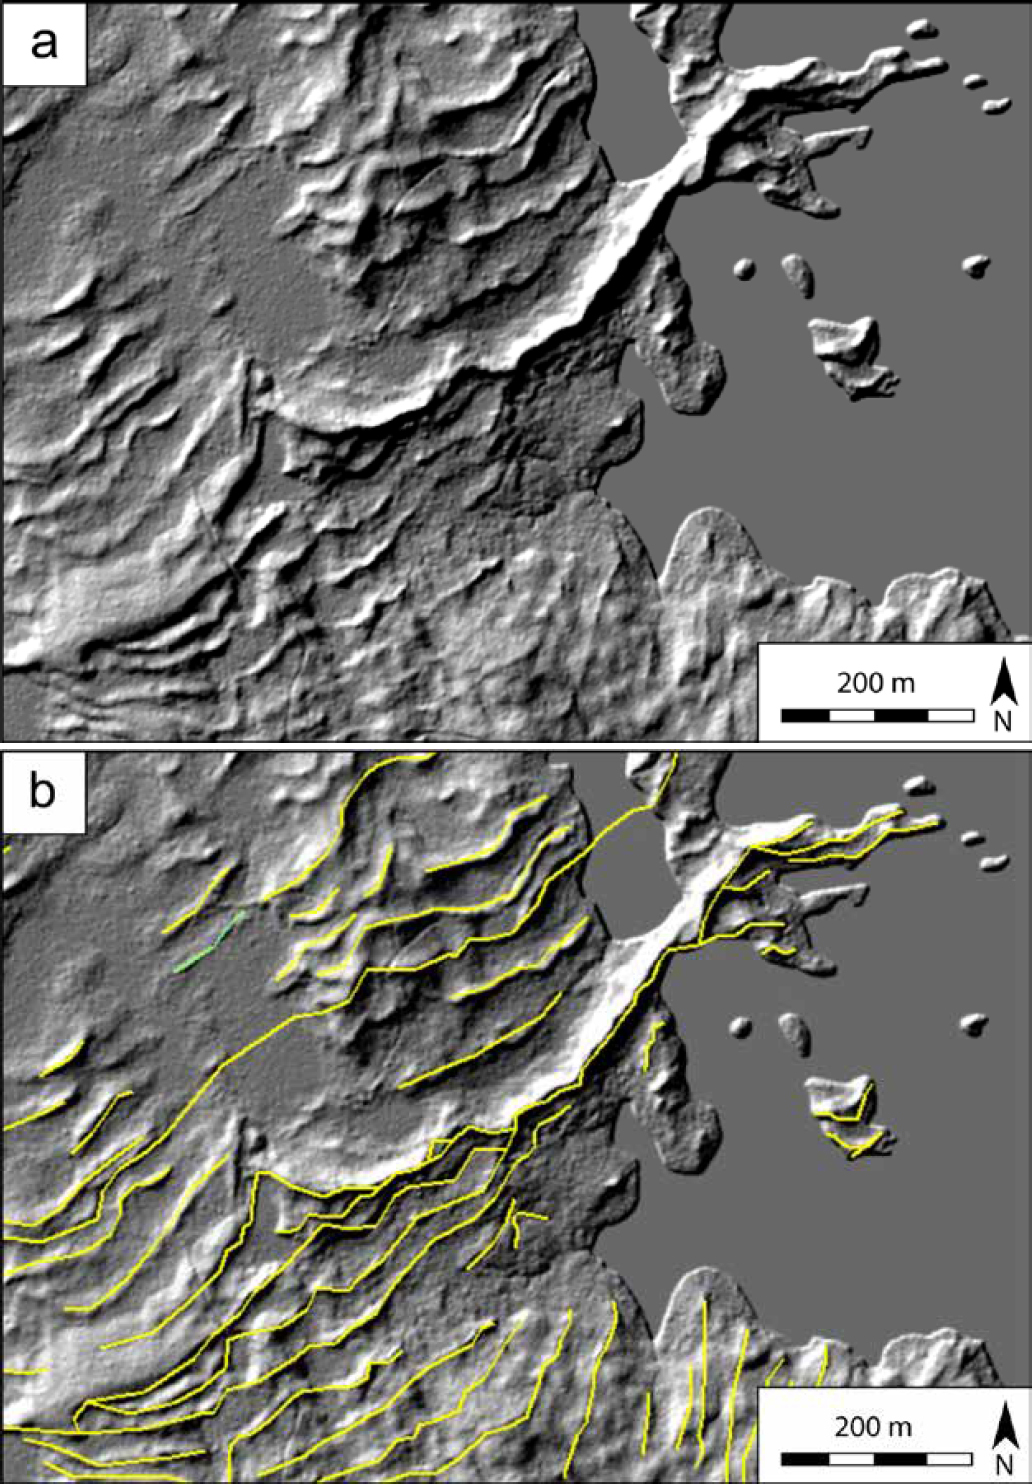
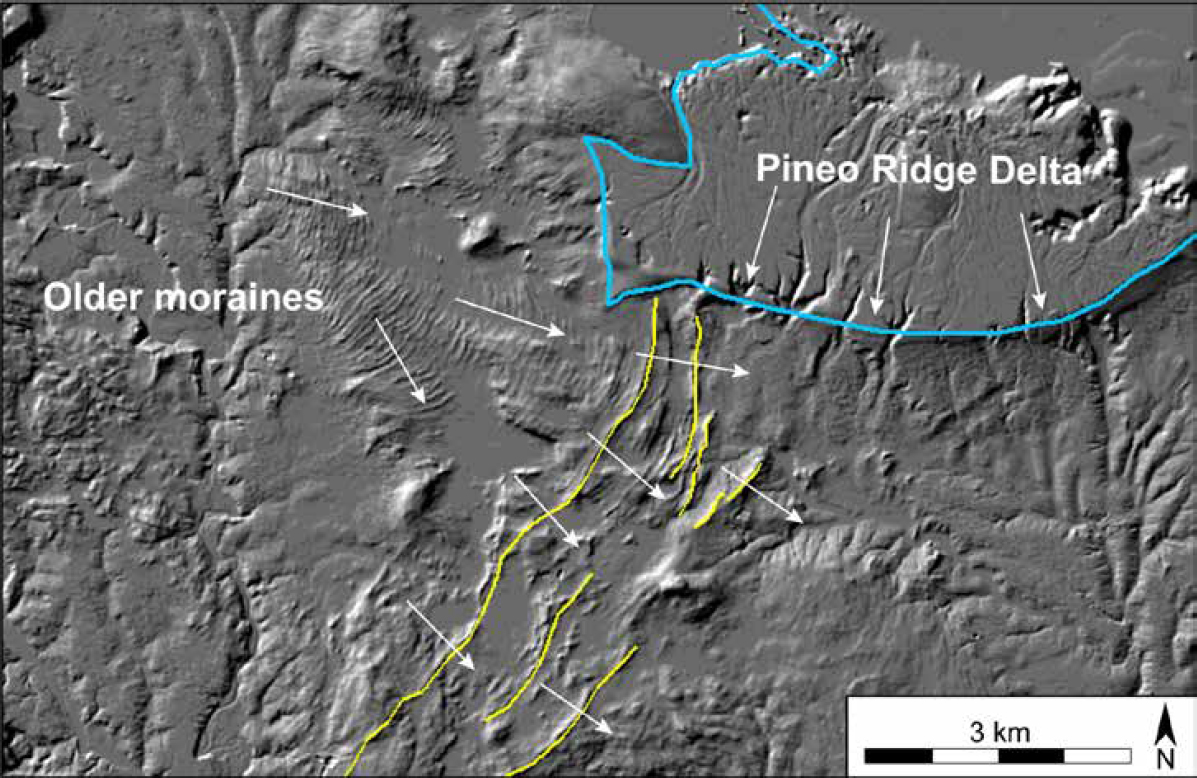
17 Borns (1967) noted numerous small NE-trending moraines south of Pineo Ridge. Recent LiDAR imagery has revealed even more of these moraines, trending more easterly, between Pineo Ridge and Penobscot Bay. These are now recognized as De Geer moraines (Fig. 5), deposited along the grounding line of a rapidly retreating ice sheet terminating in the sea (De Geer 1940; Larsen et al. 1991; Sinclairet al. 2018). It is commonly argued that De Geer moraines form approximately annually, and we adopt this view: an ice sheet advances slightly during the winter, bulldozing till into a low ridge, and then retreats rapidly during the summer, resulting in a space of a few tens to a couple of hundred metres between successive moraine ridges (e.g., Eusden 2014; Sinclair et al. 2018). The mean distance between these small moraines is generally consistent with the best estimates of the rate of retreat of the ice margin across coastal Maine (Hooke and Hanson 2017, p. 294).
 Display large image of Figure 5
“Prominent” moraines
18 The sizes of the Pond Ridge and Pineo Ridge moraines suggest that they represent some decades or even a century or two of accumulation. Other moraines, not as large as Pond or Pineo but larger than most De Geer moraines, are also present. These likely represent pauses in retreat or slight readvances during which moraines became stacked, resulting in one large moraine rather than two or more smaller ones. In some cases, one can indeed see that these moraines, which we henceforth refer to as “prominent” moraines, result from the merging of two or more De Geer moraines (Fig. 5). Several prominent moraines are delineated in Figure 6.
 Display large image of Figure 6
METHODS
19 De Geer moraines are readily visible on high-resolution LiDAR imagery (e.g., Fig. 5). The LiDAR map layers were uploaded to ArcMap 10.4.1 software using the ArcGIS online feature. To illuminate the topography, all hillshade data used a 315° false sun, shining approximately perpendicular to the moraines. The crests of nearly all moderately continuous moraines were mapped.
20 To correlate moraines on opposite sides of areas devoid of moraines, such as bodies of water, topographic highs, and some topographic lows, we located a well-defined, continuous moraine above or below the area lacking moraines and counted the number of moraines north or south of this moraine on both the east and west sides of the barren area. This yielded high-confidence correlations between prominent moraines across the barren areas, especially across the Penobscot Bay.
21 Our westward continuation of the Pond Ridge moraine (Fig. 6) is based on counting the approximate number of moraines between the Pond Ridge and Pineo Ridge moraines. This involved some uncertainty because the morainal sequence south of Pineo is lobate and erratic. The moraine we believe to be the westward continuation of the Pond Ridge moraine was roughly the same distance from Pineo as the Pond Ridge moraine is in its type locality, and is of approximately the same size and character as the type Pond Ridge moraine.
22 In some cases, apparently continuous sequences of De Geer moraines occur between two prominent moraines. In these cases, the time elapsed between deposition of the prominent moraines can be determined reasonably accurately simply by counting the intervening De Geer moraines. More commonly, however, we did not find continuous sequences of mappable De Geer moraines that covered the entire distance between prominent moraines. In these cases, the time elapsed between deposition of the prominent moraines was estimated by calculating several retreat rates based on short sequences of De Geer moraines between the prominent moraines. Using these retreat rates, we estimated the time elapsed between deposition of the prominent moraines. By accumulating these estimates, we calculated the time elapsed since deposition of our extrapolation of the Pond Ridge moraine. Most prominent moraines likely represent less than, say, five years of accumulation (e.g., Fig. 5). As our estimates of moraine ages (Fig. 6) are to the nearest century, we did not make any adjustment for the additional time required to accumulate a prominent moraine.
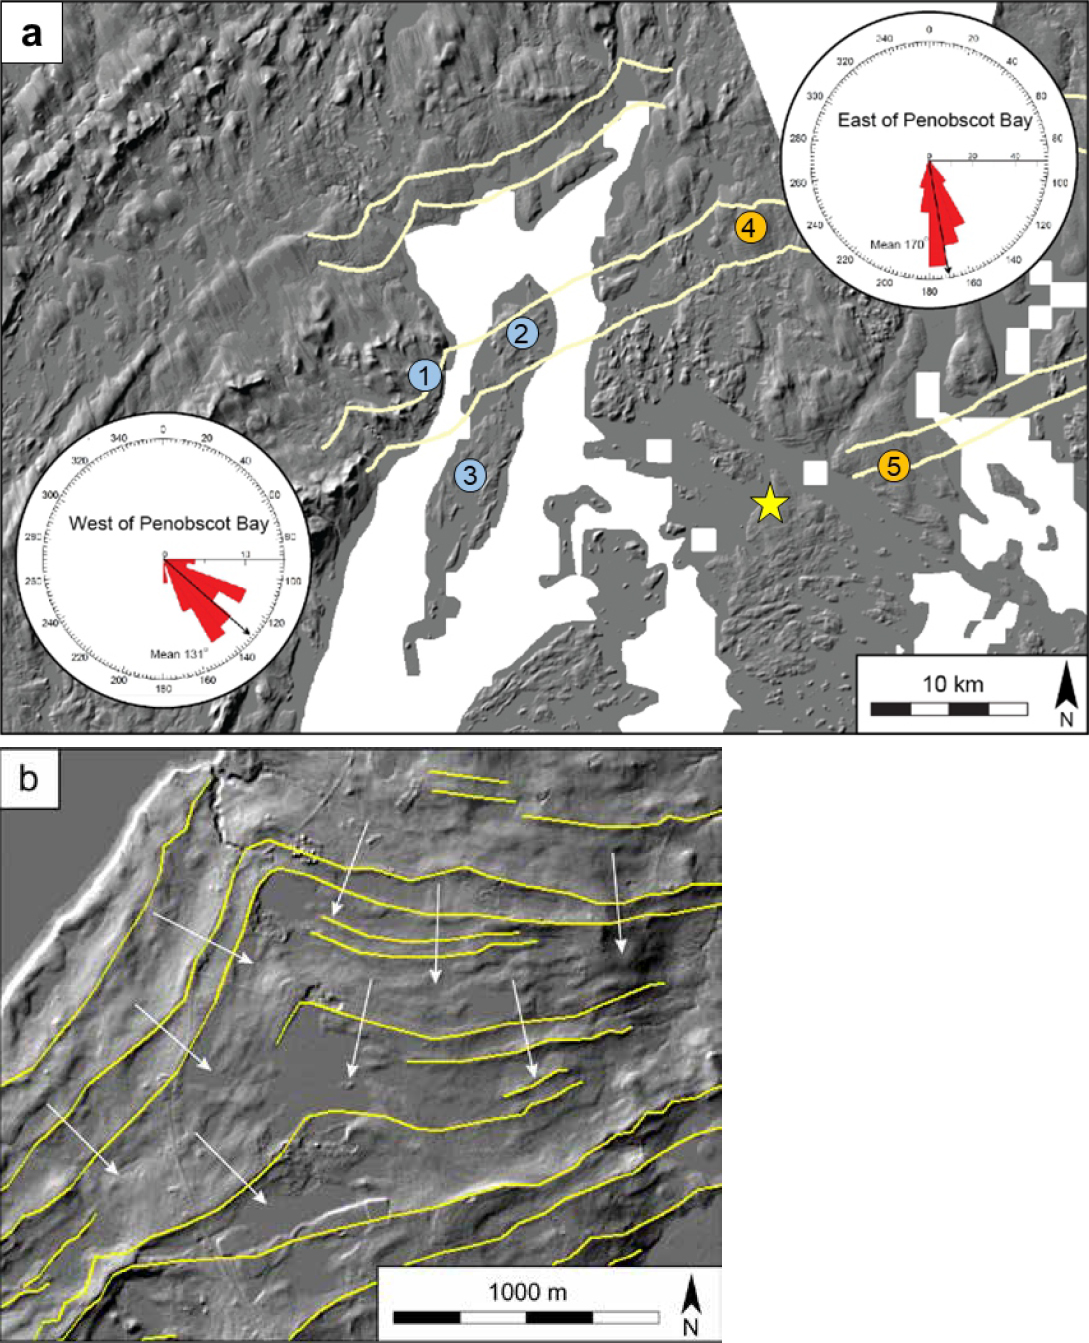
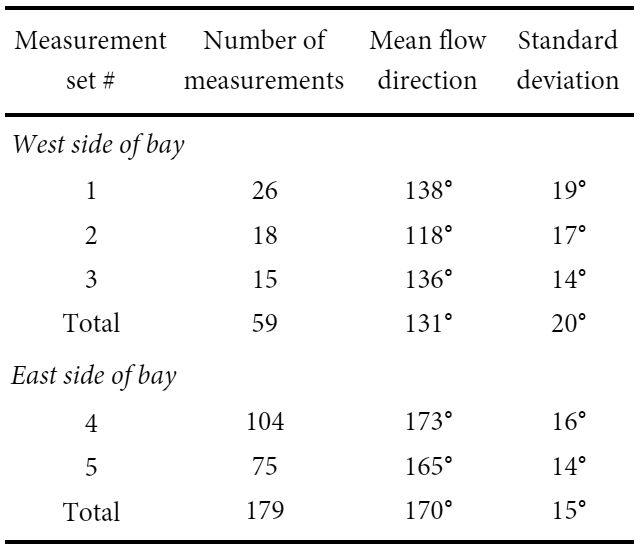
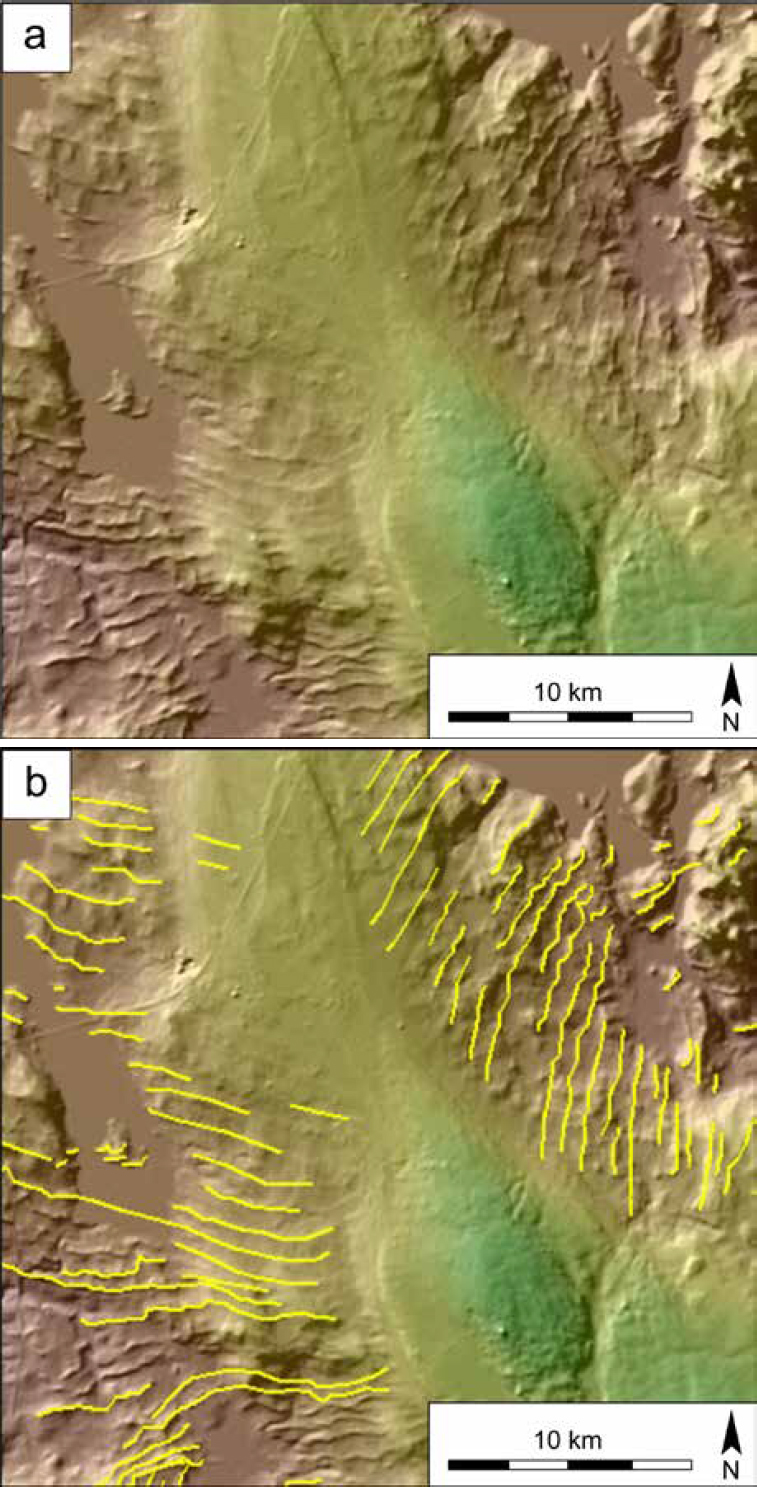
23 Flow directions west and east of Penobscot Bay were determined by averaging the orientation of numerous normals to moraines within 5 × 5 km areas. Two areas were studied east of the bay, and three west of the bay (Fig. 7 and Table 1). Areas were chosen based on their proximity to the bay and the abundance of mappable moraines.
 Display large image of Figure 7
 Display large image of Table 1
RESULTS
Moraines
24 Moraines are present below the marine limit throughout the study area. However, west of Penobscot Bay large areas above the marine limit are decorated with flutes rather than moraines. Further west, De Geer moraines reappear on the landscape, but these were not mapped for this study. Moraines virtually disappear in the Penobscot Lowland north of the head of Penobscot Bay, and also north of Pineo Ridge where eskers dominate the landscape.
Retreat rates
25 The rate of ice margin retreat increased inland from the coast. Smaller, more closely-spaced moraines closer to the coast suggest that after deposition of the Pond Ridge moraine, retreat maintained a mean rate of ~45 m a-1 (observable ~5 km north of Steuben (Fig. 6)) for ~300 years. It then gradually increased to ~170 m a-1 near the head of Penobscot Bay, likely reflecting the warming during the onset of the Bølling-Allerød (Fig. 3). The absence of DeGeer moraines in the Penobscot Lowland suggests rapid steady retreat during the Bølling-Allerød, rather than the earlier annual oscillatory patterns, but it could also reflect some other difference in conditions at the grounding line.
Projections across study area
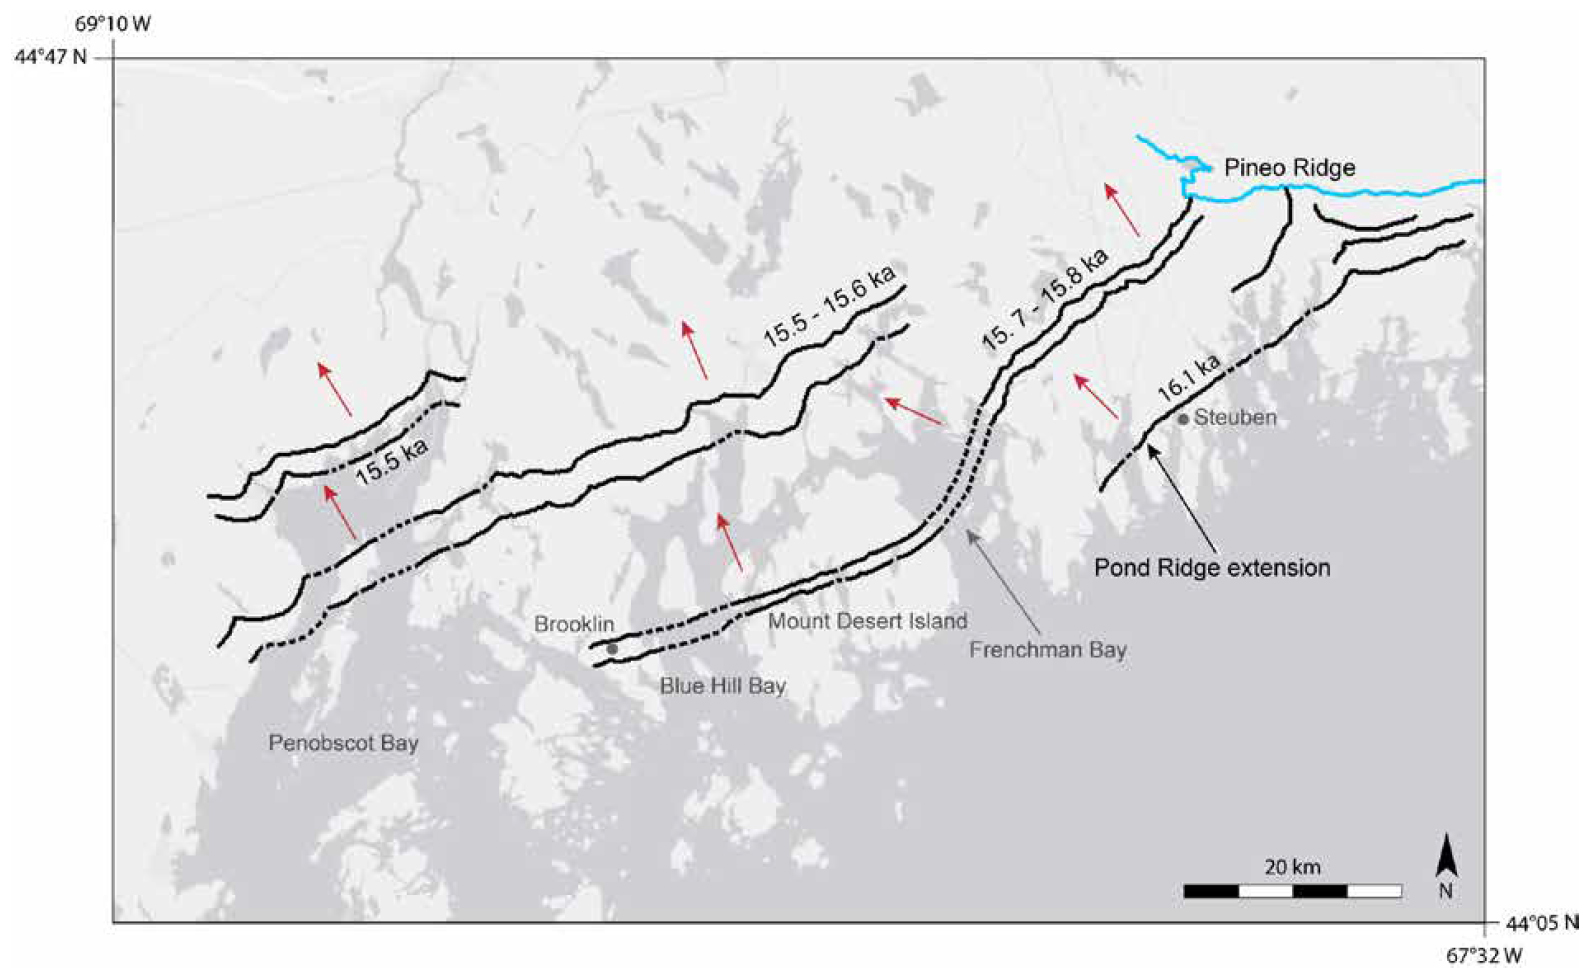
26 Two prominent moraines, continuous for about 25 km, extend southwestward from a delta at the western end of Pineo Ridge (Figs. 6, 8a, and 9). Moraine sequences between the two suggest a mean retreat rate of ~50 m/yr. As these large moraines are ~1500 m apart, the more northerly one was deposited ~30 years after the southerly one. We projected these two moraines across Frenchman Bay based on the trends of moraines to the north and south and correlate them with two large moraines on Mt. Desert Island. Moraine sequences at this location on Mt. Desert suggest a retreat rate that is consistent with an elapsed time of 30 years between the two. To the west of Mount Desert Island, Blue Hill Bay creates another disruption in the moraine path. In Brooklin, just west of Blue Hill Bay (Fig. 6), two large moraines are in line with the projection of the moraines on Mt. Desert Island and are separated by exactly 30 smaller moraines. We thus correlate these two with those on Mt. Desert Island and those east of Frenchman Bay.
 Display large image of Figure 8
 Display large image of Figure 9
27 To the northwest of these moraines, two more pairs of relatively continuous, though not particularly large moraines are delineated in Figure 6. The correlations of these moraines across Penobscot Bay are based on retreat rates on opposite sides of the bay, as described above.
Variations in flow direction
28 In our study area, moraines generally trend N70E–S70W (Fig. 6), with local exceptions where they arc north as they cross topographic lows (e.g., Fig. 5, left of center) or south as they approach topographic highs (e.g., Fig. 10). This provides convincing evidence that the moraines were formed at the grounding line beneath an ice shelf. The base of the shelf would have sloped downward to the NNW and intersected the bed further north in north-south trending valleys (much as a dipping sedimentary bed forms a V as it crosses a valley), and further south on north-south trending highs. As our study area is in an area where relative sea level was ~70 m higher during retreat of the margin, the water depth was such that the presence of a narrow ice shelf is not surprising.
 Display large image of Figure 10
29 A more significant variation in flow direction occurs across Penobscot Bay. On the east shore moraines indicate an average flow direction of ~170 ± 15° (Fig. 7a and Table 1). As they cross the bay, they assume a northeast-southwest trend; the flow here was ~131 ± 20° (Fig. 7a and Table 1). These flow directions appear to converge on North Deer Isle (Fig. 7b), suggesting that from North Deer Isle, ice retreated in two directions: northerly onto the present mainland and northwesterly across Penobscot Bay. The retreat across the bay was ~11% faster than that to the north, a result consistent with there being deeper water in the bay.
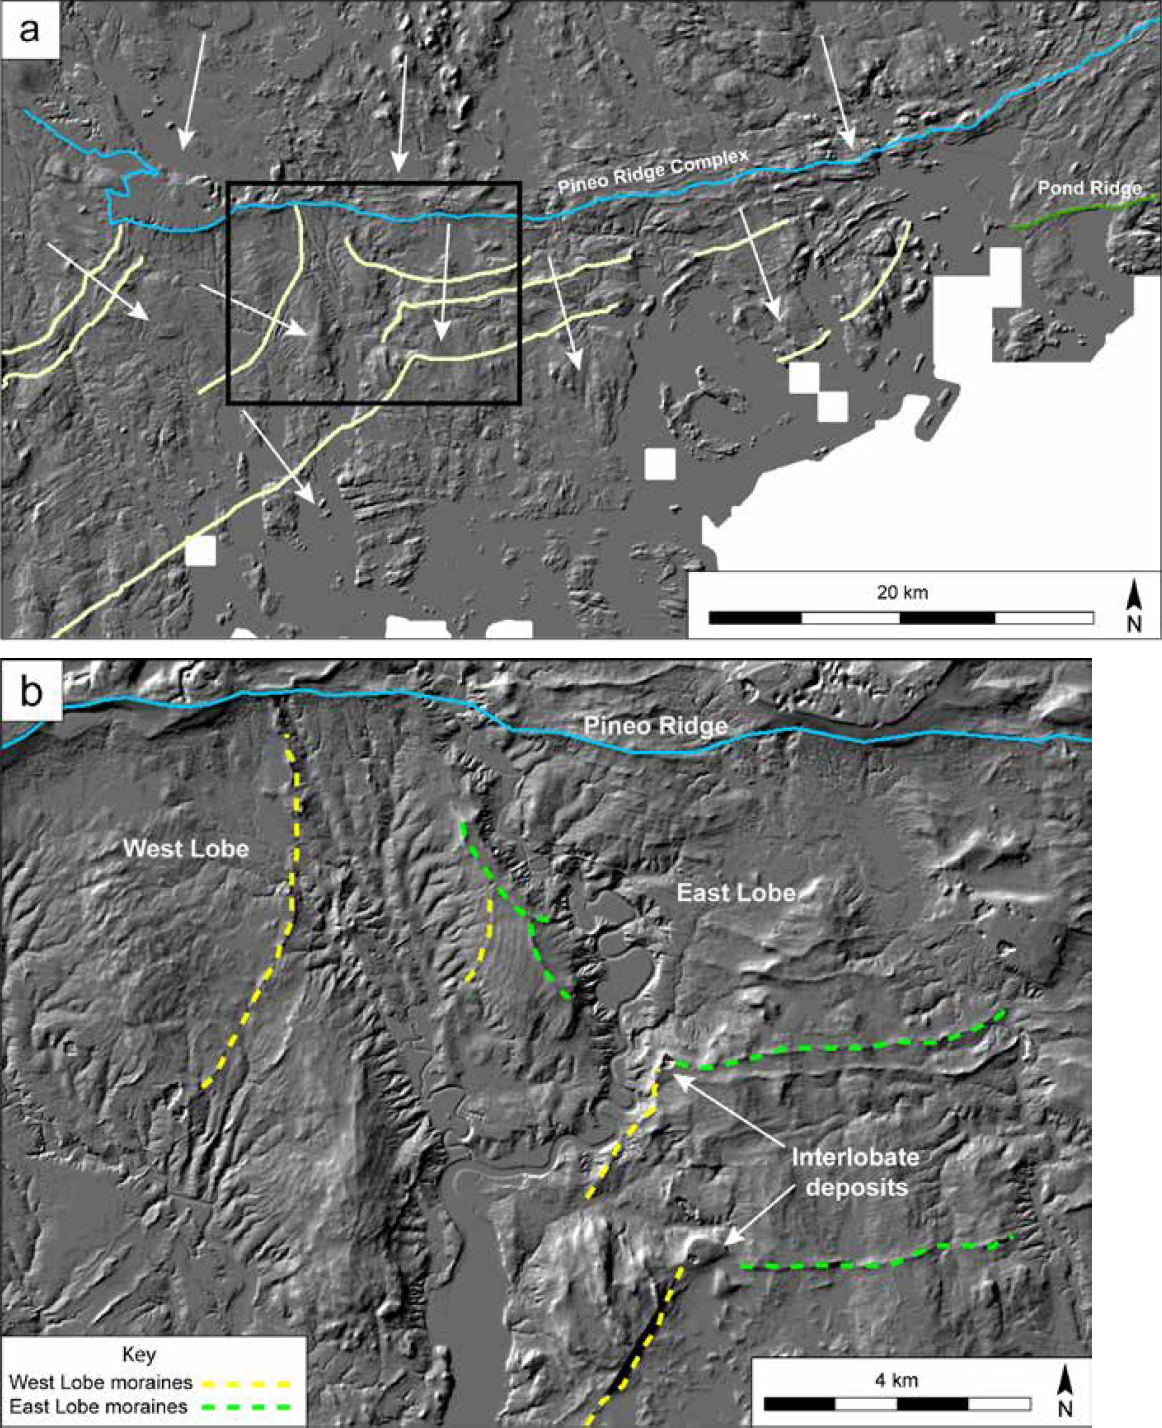
30 As noted years ago, (Borns 1967, p. 8), moraine sequences south of Pineo Ridge also indicate two primary flow directions: south and southeast (Fig. 8). The moraine sequence built by southeasterly flow is west of that built by southerly flow. The latter has numerous larger moraines while the former is largely composed of smaller, evenly-spaced moraines. In two places where these two flow directions converge, ~5 km and ~8 km south of Pineo Ridge, there are massive sediment deposits (Fig. 8b). The southerly of the two interlobate junctions was mapped by Borns (1967, Fig. 1), but he does not mention the deposits. Northwest of these, Pineo Ridge appears to partially bury the northeasterly-trending moraines formed by the southeasterly flow (Figs. 6, 8, and 9).
DISCUSSION
Ages
31 Northwest of our westward extension of the Pond Ridge moraine the retreat rate averaged ~45 m a-1. The pair of moraines that we traced to Mt. Desert Island and Brooklin, is ~13 km NW of this extension, suggesting an elapsed time slightly less than 300 years between retreat from the Pond Ridge moraine and deposition of this pair of moraines. If we assume retreat from Pond Ridge moraine began slightly after 16.1 ka, this suggests an age of 15.7–15.8 ka for these (Fig. 6). This is consistent with the observation that these moraines are crosscut by the western delta of the Pineo Ridge complex (Fig. 9), and thus somewhat older than the retreat from Pineo.
32 Northwestward from this pair of moraines, the retreat rate maintained an average of ~45 m a-1 for about 5 km, then increased to an average of ~120 m a-1 for 4 km, and finally to an average of ~170 m a-1 for 5 km. The next pair of moraines, the first that we correlate across the bay (Fig. 6), is ~14 km northwest of the first pair. Based on these retreat rates, these moraines were deposited ~200 years after the first pair, or between 15.5 and 15.6 ka. Further northward, retreat maintains a mean rate of ~170 ± 15 m a-1, again based on several calculated rates. Thus, the third and most northerly pair of moraines, ~8 to ~11 km farther north-northwest, were deposited ~15.5 ka.
Implications for ice margin positions and behavior
33 During retreat from the current coastline, ice margins inferred from the moraines are relatively straight, oriented N70E–S70W, and roughly parallel to the coast. However, evidence for significant differences in flow direction are found around Penobscot Bay and south of Pineo Ridge.
34 The variation in retreat direction and slight increase in apparent retreat rate across Penobscot Bay appears to be the extent of development of a calving bay there.
35 The orientations of the interlobate moraines south of Pineo Ridge (Fig. 8) indicate that a western lobe retreated to the northwest while an eastern lobe retreated to the north as noted by Borns (1967). Based on the spacing of moraines between the two massive interlobate deposits, the initial rates of retreat to the north and to the northwest were comparable, and ~70 m a-1. However, the moraines built by the eastern lobe are larger, suggesting that it may have been more active. Furthermore, once the western lobe had retreated ~15 km, the eastern lobe either paused or readvanced slightly, and a delta built out from it buried the northeasterly ends of post-interlobate moraines deposited by the western lobe. This interpretation is consistent with that of Smith and Hunter (1989) and of Borns et al. (2004), both of whom argue for a relatively minor readvance to form Pineo.
CONCLUSIONS
- The landscape of De Geer and other moraines along the current Maine coast reveals many details of the shape and behavior of the ice sheet margin during retreat.
- The Pond Ridge moraine was deposited over a period of a few decades to a century, likely centered on ~16.1 ka, Pineo Ridge was deposited over a time span of two to three centuries likely centered on ~15.7 ka, and ice retreated north of the present head of Penobscot Bay by ~15.5 ka.
- There is minimal evidence for a calving bay in the area of the present Penobscot Bay, although the apparent northwesterly retreat, at a slightly higher rate, from North Deer Isle may reflect somewhat higher calving rates where the water was deeper.
- Evidence for the onset of the Bølling warming is found in the transition to more widely-spaced moraines after ~15.8 ka. The steady increase in spacing from 15.8 ka to 15.5 ka and the lack of moraines after 15.5 ka likely reflect rapidly increasing temperatures during this time period (Figs. 2 and 3).
- As noted previously (Borns, 1967; Borns et al. 2004), there were two ice lobes in the vicinity of Pineo Ridge: an eastern and a western lobe. We identified two large deposits, at interlobate sites. As the western lobe retreated to the northwest, the eastern lobe retreated to the north. A pause or slight readvance of the eastern lobe resulted in the Pineo Ridge moraine-delta complex that buried the northeasterly ends of the last moraines deposited by the western lobe.
ACKNOWLEDGMENTS
The Mt. Holyoke College's Lynk UAF Program and the University of Maine Geomorphology Research Fund provided primary funding for this study, with additional support from the School of Earth and Climate Sciences at the University of Maine. Constructive reviews by Dan Belknap and an anonymous referee led to significant improvements in the manuscript. RLH was introduced to the glacial geology of downeast Maine by the late Hal Borns (1927– 2020), whose pioneering work and perceptive analyses have inspired generations of glacial geologists.
REFERENCES
Editorial responsibility: Denise Brushett