Article
Interpretation of lineaments and faults near Summerville, South Carolina, USA, using LiDAR data:
implications for the cause of the 1886 Charleston, South Carolina, earthquake
doi:10.4138/atlgeol.2020.003
Abstract
LiDAR (light detection and ranging) data acquired near Summerville, South Carolina, reveal numerous lineaments trending in various directions across the Middleton Place-Summerville seismic zone (MPSSZ) and surrounding area. These lineaments are defined by linear depressions and stream valleys that are developed within late Eocene to Holocene marine, marginal marine, and fluvial sediments of the Atlantic Coastal Plain. The 40-kmlong, ENE-WSW-oriented Deer Park lineament coincides with the Woodstock epicenter of the 1886 Charleston earthquake, suggesting that the main shock may have occurred along a fault associated with this lineament. The proximity of the 17-km-long, ENE-WSW-oriented Middleton Place lineament to the Middleton Place epicenter suggests that it too may have ruptured in 1886. Several E-W-oriented topographic scarps are also located near the area of modern seismicity, including the 3- to 5-km-long, south-facing McChune and Summerwood scarps. The McChune scarp is aligned with the E-W-trending portion of the Summerville scarp to the west, suggesting that both scarps may be from uplift to the north along the same fault. The McChune scarp and the Otranto and Middleton Place lineaments coincide with faults interpreted from previously acquired seismic-reflection profiles, suggesting that these features are surface expressions of Quaternary faults. Other lineaments east of the MPSSZ are associated with Neogene structural domes, indicating that the interpreted faults along these lineaments have been active during the late Cenozoic. The LiDAR data also revealed a ~350-m dextral offset of a mid-Pleistocene beach ridge along the Woodstock fault and a ~20-km-long, NW-SE-oriented lineament to the east (Canterhill lineament) that appears to be the surface expression of the Charleston fault.
Résumé
Les données acquises par télédétection par laser (LiDAR) dans la région de Summerville en Caroline du Nord révèlent de nombreux linéaments se reflétant dans diverses directions à travers la zone sismique Middle Place-Summerville (ZSMPS) et ses environs. Ces linéaments sont définis par des dépressions linéaires et des vallées de cours d’eau qui sont développées dans les sédiments marins, de la marge continentale et fluviaux de l’Éocène tardif à l’Holocène de la plaine côtière de l’Atlantique. Le linéament de Deer Park, d’une longueur de 40 km et orienté ENE-OSO, coïncide avec l’épicentre de Woodstock du tremblement de terre de Charleston en 1886, ce qui suggère que la secousse principale peut s’être produite le long d’une faille associée à ce linéament. Le linéament de Middleton Place de 17 km de long et orienté ENE-OSO est situé à proximité de l’épicentre de Middleton Place, suggérant qu’il a lui aussi pu se rompre en 1886. Plusieurs escarpements topographiques orientés est-ouest sont également situés près de la zone de sismicité moderne, notamment les escarpements McChune et Summerwood, chacune de longueur allant de 3 à 5 km et exposés plein sud. Plus à l’ouest, l’escarpement de McChune est aligné avec la partie à tendance est-ouest de l’escarpement de Summerville, ce qui suggère que les deux escarpements peuvent s’être soulevés vers le nord le long de la même faille. L’escarpement de McChune et les linéaments Otrante et Middleton Place coïncident avec des failles interprétées à partir de profils de réflexion sismique précédemment acquis, suggérant que ces caractéristiques sont des expressions de surface de failles quaternaires. D’autres linéaments à l’est de la ZSMPS sont associés à des dômes structuraux néogènes, ce qui indique que les failles interprétées le long de ces linéaments ont été actives au Cénozoïque tardif. Les données LiDAR ont également révélé un mouvement dextre d’environ 350 m d’une crête de plage du Pléistocène moyen le long de la faille de Woodstock et un linéament d’environ 20 km de long, orienté NO-SE à l’est (linéament de Canterhill), qui semble être l’expression en surface de la faille de Charleston.
[Traduit par la redaction]
INTRODUCTION
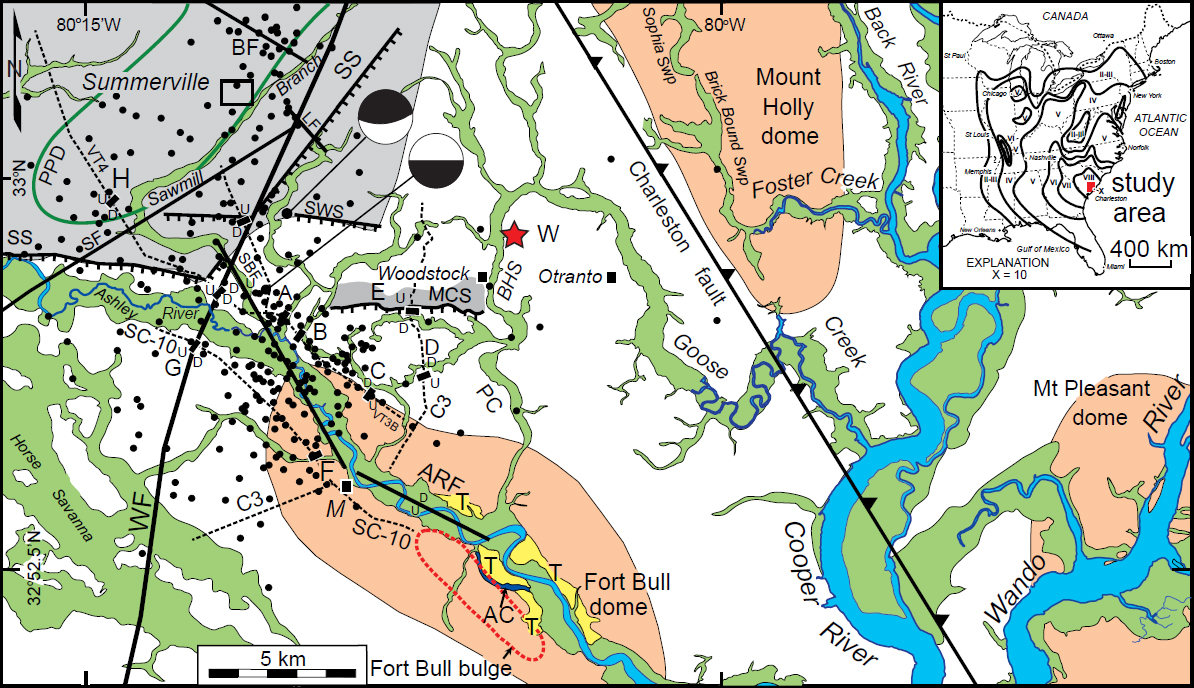
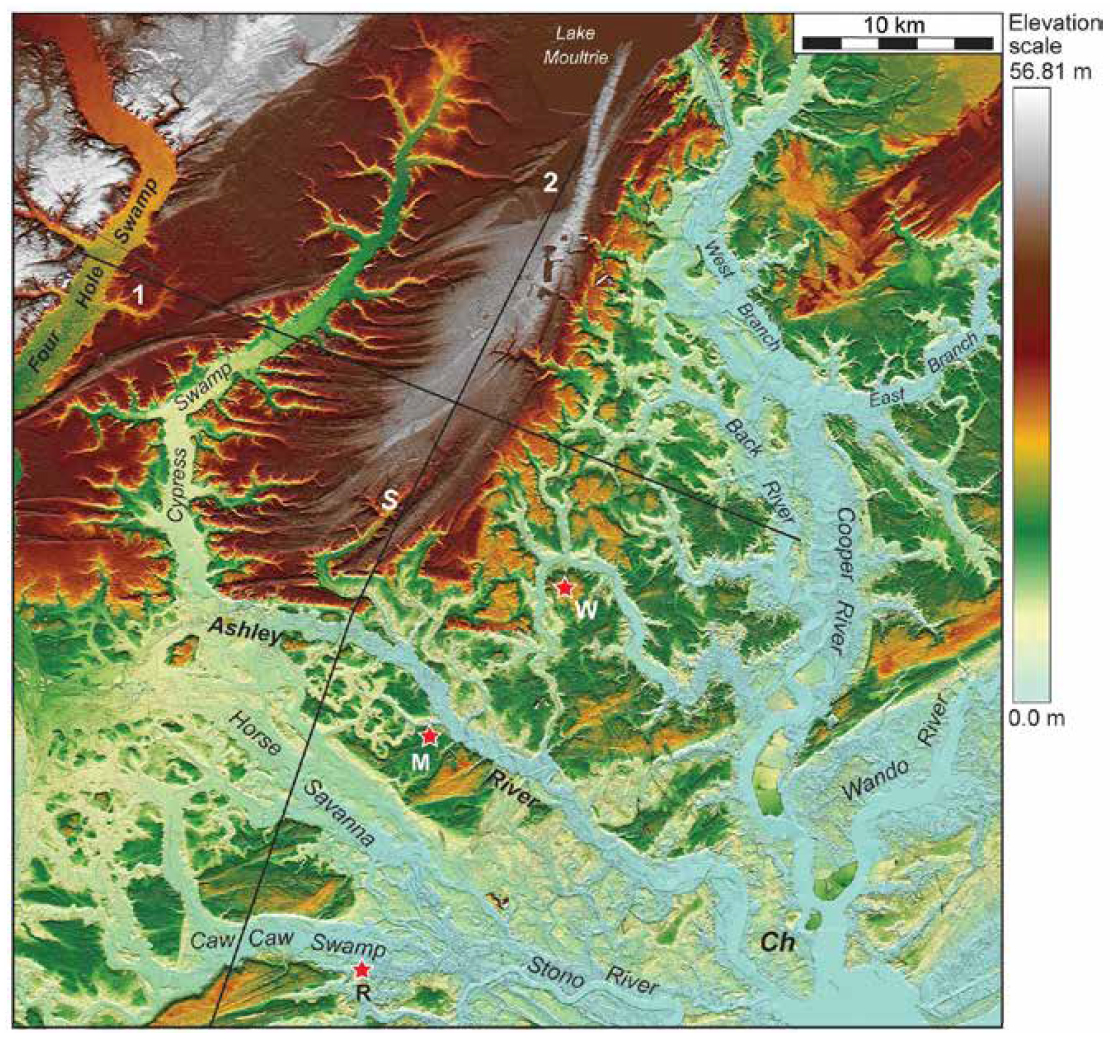
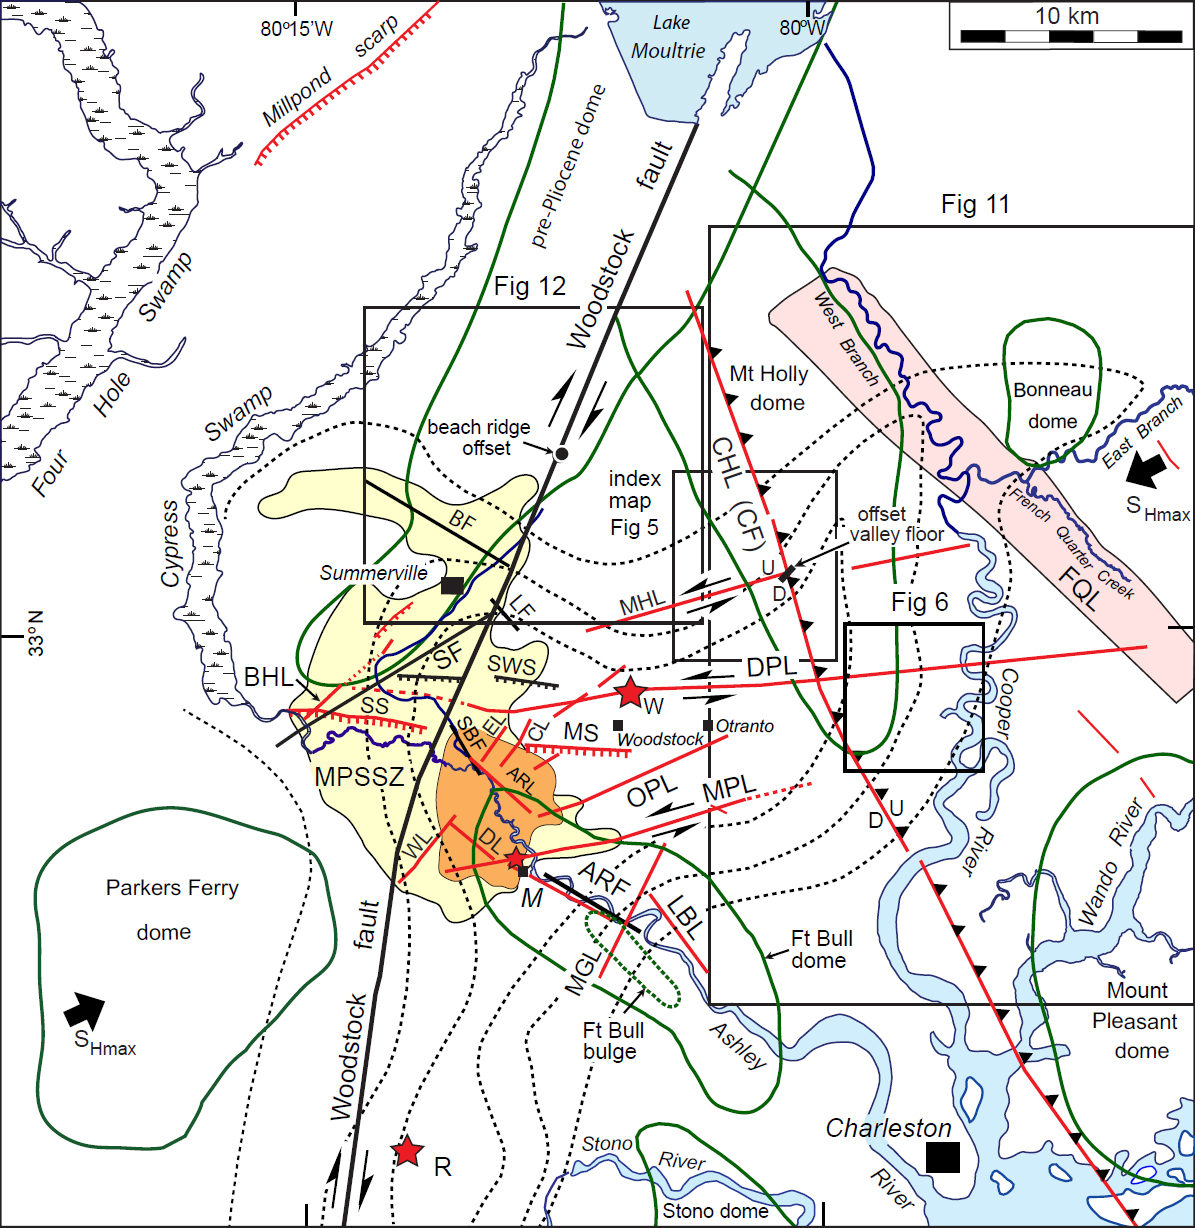
1 The main shock of the 1886 Charleston, South Carolina, earthquake was the largest historical earthquake to have occurred along the Atlantic seaboard of the eastern United States. Moment magnitude estimates of the earthquake range from Mw 6.9 (Bakun and Hopper 2004) to Mw 7.3 (Johnston 1996). Most of the recent seismicity is located within the Middleton Place-Summerville seismic zone (MPSSZ), with the greatest concentration along the Ashley River valley northwest of Middleton Place (Fig. 1). No exposures of fault planes have been located in the area, except possibly for a 10-cm left-lateral offset of the northern and southern walls of Old Fort Dorchester near the northern side of the Ashley River valley (Talwani et al. 2011). Contemporary reports suggest that as many as three epicenters may have been associated with the 1886 Charleston earthquake: one near Woodstock that is thought to have been associated with the main shock, a second epicenter west of Rantowles, and a third one near Middleton Place (Dutton 1890; McKinley 1887) (Fig. 2).
 Display large image of Figure 1
 Display large image of Figure 2
2 Several models have been proposed to explain the 1886 Charleston earthquake and modern seismicity. Using an integration of river morphology, seismic-reflection profiles, and other geological data, Marple and Talwani (2000) hypothesized that the earthquake occurred along the southern end of the ~200-km-long, NNE-SSW-trending Woodstock fault (Fig. 1). The Woodstock fault dips steeply to the west and is associated mainly with right-lateral strike-slip displacements (Talwani 1982). Marple and Miller (2006) postulated that the Charleston earthquake and MPSSZ are associated with a 12° bend in the Woodstock fault as shown in Figure 1. Talwani and Dura-Gomez (2009), in contrast, hypothesized that the MPSSZ is associated with a ~6 km right-step offset in the Woodstock fault along the Ashley River. More recently, Chapman et al. (2016) postulated that the Charleston earthquake occurred on a west-dipping, NNESSW-trending reverse fault.
3 Our goal was to search for evidence of surface faults in the MPSSZ and surrounding area using mainly LiDAR data and previously acquired seismic-reflection data. Our results suggest that the main shock of the 1886 Charleston earthquake may have occurred along the 40-km-long, E-W-oriented Deer Park lineament. They also suggest that the MPSSZ is associated with several intersecting faults oriented in various directions east of the bend in the Woodstock fault. A ~350-m right-lateral offset of a middle Pleistocene beach ridge along the Woodstock fault northeast of Summerville suggests that the fault has locally broken the ground surface numerous times in the past (Marple and Hurd 2020). Lastly, our study revealed several relatively long (>15 km) lineaments east of the MPSSZ that appear to have been active during the late Cenozoic.
GEOLOGIC AND SEISMOTECTONIC SETTING
4 Sea-level changes during the Pliocene–Pleistocene have produced a series of terraces underlain by emergent marine landforms in the Atlantic Coastal Plain, including estuarine plains, back-barrier marshes, lagoonal deposits, and sandy barrier-island ridges (Colquhoun et al. 1991; Weems et al. 1997). The terraces are bounded on the seaward (southeast) side by eroded emergent littoral scarps, such as the Summerville scarp along the southeastern edge of the Penholoway terrace in the Summerville area (Fig. 1). The locations of the Penholoway terrace and the Summerville and other Pliocene–Pleistocene shorelines to the northeast were influ-enced by gentle uplift along the Woodstock fault (Marple and Talwani 2000).
5 Beneath the Coastal Plain, a coastward-thickening wedge of consolidated to poorly consolidated Cretaceous and Cenozoic sediments that is up to 1.1 km thick near Charleston (Weems and Lewis 2002) unconformably onlaps and buries early Mesozoic rift basins and pre-Mesozoic suspect and exotic terranes (Daniels et al. 1983). Four of the near surface formations, the Oligocene (30 Ma) Ashley Formation, the middle Pleistocene (700–970 ka) Penholoway Formation, and the late Pleistocene Ten Mile Hill beds (200–240 ka) and Wando Formation (100 ka) (Weems et al. 1997), are briefly described here because they are integrated later with some of the geomorphic observations. The Ashley Formation consists of dense, erosion-resistant, weakly cemented, light-olive-brown, phosphatic and quartzose calcarenite that accumulated in an open-marine-shelf environment (Weems et al. 1997). The Penholoway Formation consists of sand, clayey sand, and clay deposited in shallow-marine to marginal-marine environments, the most notable of which is the barrier and back-barrier complex near Summerville (Weems et al. 1997) (Fig. 2). The Ten Mile Hill beds consist of poorly consolidated, easily eroded clays and clayey sands deposited in back-barrier and shallow shelf environments (Weems and Lemon 1993). The Wando Formation consists of poorly consolidated, easily eroded sand, clayey sand, and clay that were also deposited in back-barrier and shallow shelf-marsh environments (Weems and Lemon 1988, 1993).
6 Modern seismicity within the epicentral area of the 1886 Charleston earthquake is low level and clustered within the MPSSZ, the greatest concentration of which is located along the Ashley River northwest of Middleton Place (Fig. 1). Studies of focal mechanisms from the MPSSZ show a wide variety of fault-plane orientations and displacement sense (e.g., Shedlock 1988; Madabhushi and Talwani 1993). Hypo-central depths of these earthquakes range from 2 to 12 km (Madabhushi and Talwani 1993).
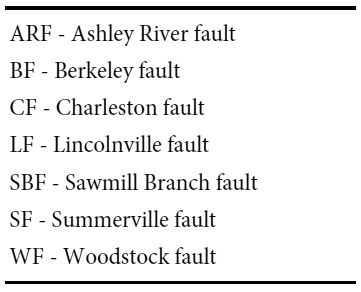
7 Previously mapped faults within the study area include the Ashley River, Berkeley, Charleston, Lincolnville, Sawmill Branch, Summerville, and Woodstock faults (Fig. 1). The largest fault is the ~200-km-long, NNE-SSW-oriented Woodstock fault that is associated with right-lateral strike-slip displacements (Marple and Talwani 2000). Southeast of the Woodstock fault is the NW-SE-oriented, SW-dipping Ashley River reverse fault (Fig. 1) (Durá-Gómez and Talwani 2009). Southwest of Summerville is the NE-SW- oriented, NW-dipping Summerville fault (Fig. 1) (Weems and Lewis 2002; Marple and Miller 2006). East of the MPSSZ is the NW-SE-oriented, ~50-km-long, high angle, NE-dipping reverse fault known as the Charleston fault that was interpreted based on borehole data (Colquhoun et al. 1983). The NW-SE-trending Sawmill Branch and Lincolnville faults (Fig. 1), as inferred from seismicity studies (e.g., Durá- Gómez and Talwani 2009), dip to the northeast and are associated mainly with reverse displacement. The NW-SE- oriented Berkeley fault north of Summerville (Fig. 1) was interpreted by Marple and Miller (2006) based on seismicity. Its dip and style of displacement, however, are unknown. Table 1 shows abbreviations of faults used in the figures.
Structural domes
8 Several structural domes and areas of gentle warping have been mapped in the South Carolina Coastal Plain (Fig. 1). One such area is the ~200-km-long “zone of river anomalies” (ZRA) that is associated with gentle uplift along the Woodstock fault (Marple and Talwani 2000). Along the ZRA and between the Ashley River and Lake Moultrie is a topographically high area (Figs. 1 and 2) that Marple and Talwani (1993, 2000) postulated was from late Cenozoic uplift. The pre-Pliocene surface along this area is upwarped 10–15 m (Weems and Obermeier 1989) (Fig. 1).
9 The Fort Bull bulge and dome southeast of the MPSSZ are associated with late Pleistocene and/or Holocene uplift along the Ashley River fault (Weems and Lewis 2002) (Fig. 1). Northeast of the Fort Bull dome are the Mount Holly and Mount Pleasant domes that were produced by late Cenozoic uplift along the northeastern side of the Charleston fault (Weems and Lewis 2002) (Fig. 1). Other domes mapped in the Charleston region are summarized in Weems and Lewis (2002).
METHODS AND DATA USED
LiDAR data
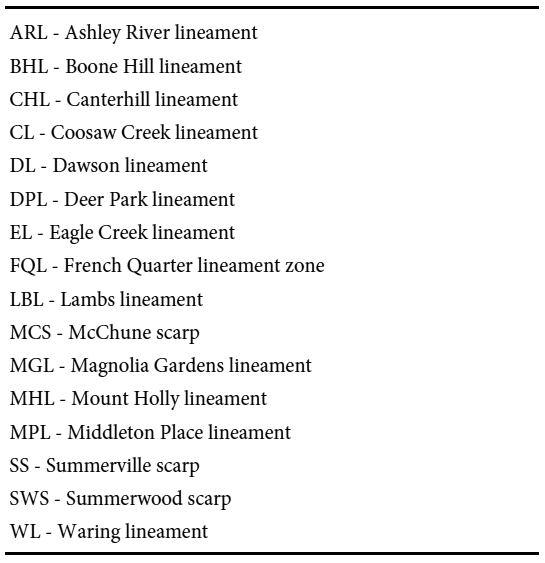
10 The LiDAR data that we used for this study were acquired in 2009 from the South Carolina Department of Natural Resources (DNR 2019). Digital elevation models (DEMs) were derived from the ground surface classified point cloud and converted into a 10 foot (~3 m) spatial resolution raster layer. The DEM represents the average surface elevation for each 10 foot raster grid. We used the Hillshade tool of ArcGIS to generate shaded relief images from the DEM data using various illumination azimuths, an elevation angle of 25°, and a vertical exaggeration of 10×. Color relief images were then generated using a color scheme based on elevations of the terrain. Basic contrast enhancement routines of Adobe Photoshop were used to digitally enhance the LiDAR images. Low contrast images were enhanced further using the intensity-hue-saturation (IHS) routine of Adobe Photo-shop. We were not able to generate elevation scales for these images because the IHS enhancement significantly changed their color schemes. The LiDAR data were also used to construct detailed topographic profiles across selected features to quantify elevation changes across them. Lineaments were compared to topographic and geologic maps at various scales to ensure that they are not associated with man-made or nontectonic landforms, such as streams that have formed between Pleistocene beach ridges. Geologic and topographic maps were also used to distinguish between potential fault scarps and linear cutbanks along the edges of stream valleys. The lineaments were also overlain with previously acquired seismic-reflection profiles, aeromagnetic data, and instrumentally recorded earthquakes to determine if they are fault-related and possibly active (Fig. 1). Some of the LiDAR lineaments were then field checked. Table 2 shows abbreviations of lineaments and scarps used in the figures.
Seismic-reflection profiles
11 The previously acquired seismic-reflection profiles that we used to search for evidence of faults along some of the Li-DAR lineaments in the study area are Consortium for Continental Reflection Profiling (COCORP) line C3, United States Geological Survey (USGS) line SC-10, and Virginia Polytechnic Institute (Virginia Tech) lines VT3B and VT4 (Fig. 1). Sites A–H in Figure 1 show the locations of faults offsetting Cretaceous, Paleogene, and Neogene strata along these profiles. Line C3 is a 24-fold Vibroseis seismic-reflection profile collected in 1978 using 5 vibrator trucks and a receiver group spacing of 67 m (Schilt et al. 1983). It was acquired in two parts with a ~3-km-wide gap across the Ashley River valley. Schilt et al. (1983) interpreted a SW-side-up fault within this gap. They also interpreted a small fault-bounded graben along this profile ~5 km north of the Ashley River valley (Fig. 1, site E). This graben extends up dip into the Cretaceous strata with a small, net N-side-up displacement across this structure (figure 10 of Schilt et al. 1983).
12 USGS seismic-reflection profile SC-10 is a 12-fold Vibroseis profile that was collected in 1979 along the south side of the Ashley River valley (Fig. 1) using 3 vibrator trucks and a receiver group spacing of 60 m (Hamilton et al. 1983). This profile revealed two faults. The fault toward the west end of the line (Fig. 1, site G) offsets Cretaceous and Cenozoic strata up to the west. Marple and Talwani (2000) interpreted this fault to be part of the Woodstock fault. A second SE-side-up fault occurs to the southeast that offsets Cretaceous and Cenozoic strata (Hamilton et al. 1983). This fault coincides with the Middleton Place lineament of this study (Fig. 1, site F).
13 Seismic-reflection profiles VT3B and VT4 were collected in 1981 across the MPSSZ (Fig. 1) by Virginia Tech in collaboration with the USGS using the RGL Vibroseis system (Chapman and Beale 2008). These 24-fold data were collected with a single vibrator truck and a receiver group spacing of 35 m (Chapman and Beale 2008). Several of the faults interpreted along these two lines offset Cretaceous and Cenozoic strata (Chapman and Beale 2010).
LIDAR OBSERVATIONS
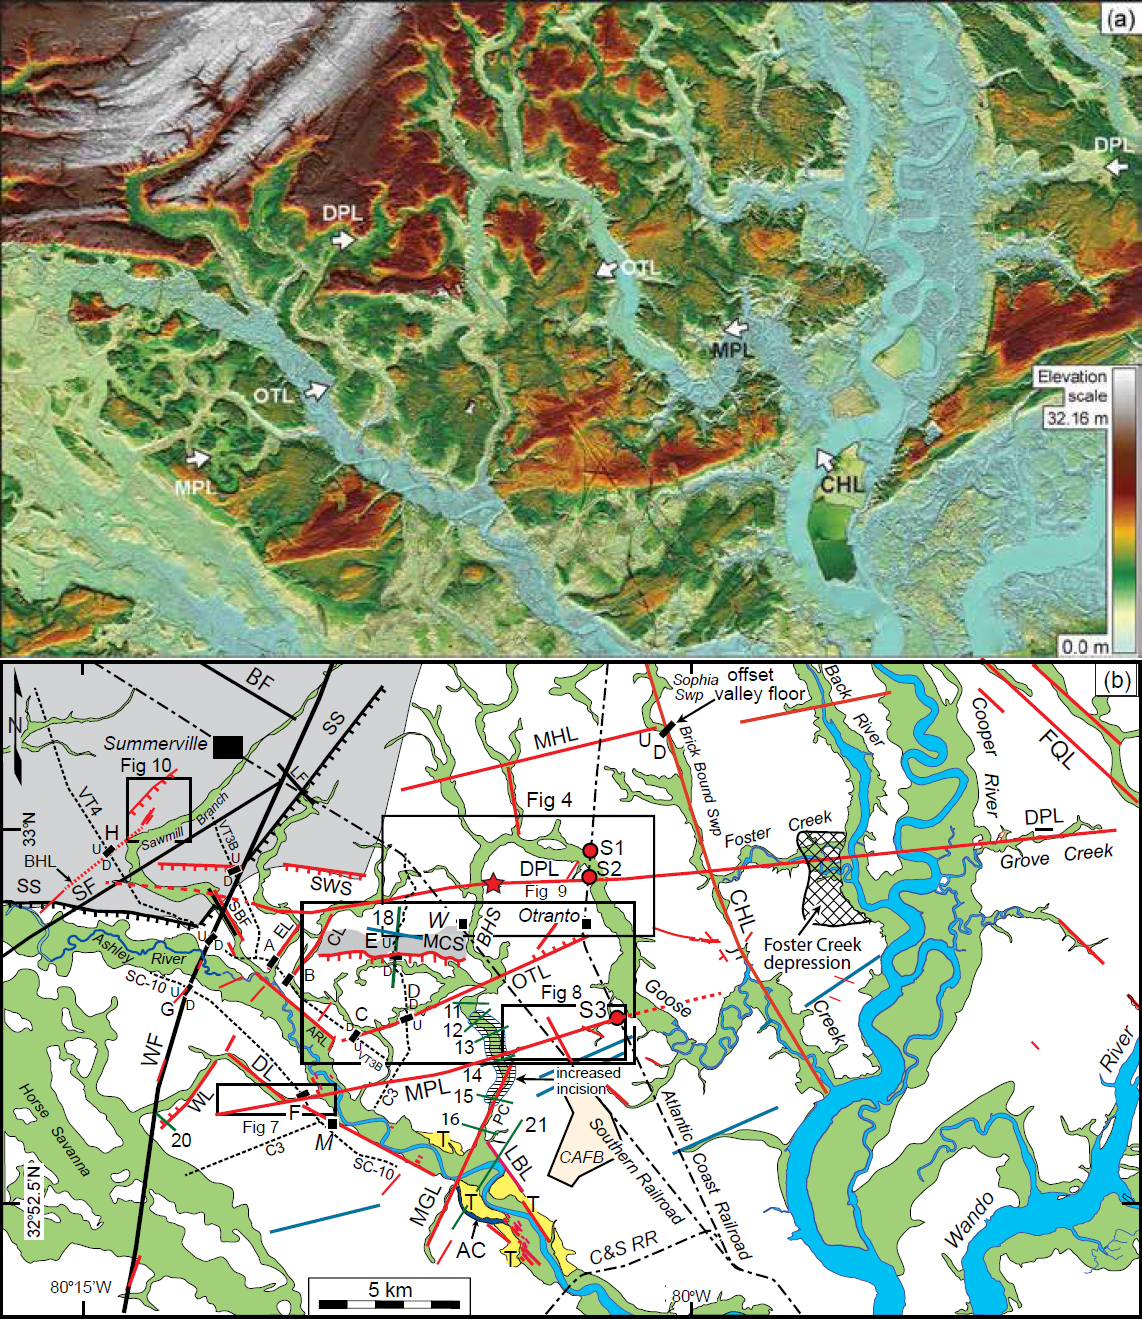
14 The LiDAR images of the MPSSZ and surrounding area revealed several lineaments oriented in many directions, the greatest concentration of which occurs east of the bend in the Woodstock fault (Fig. 3b). Selected lineaments and other geomorphic features are discussed further in the following sections.
 Display large image of Figure 3
Deer Park lineament
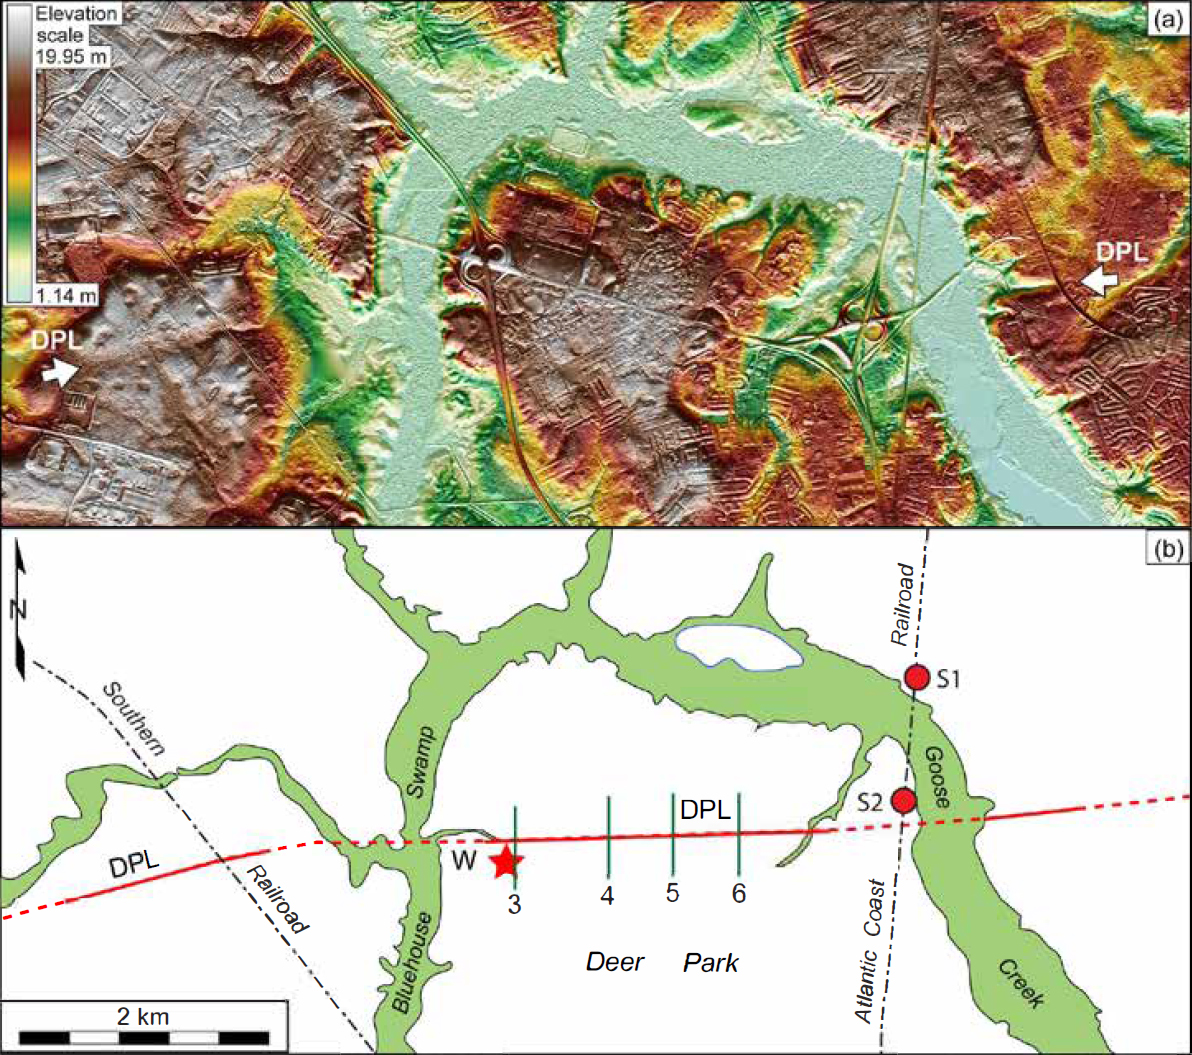
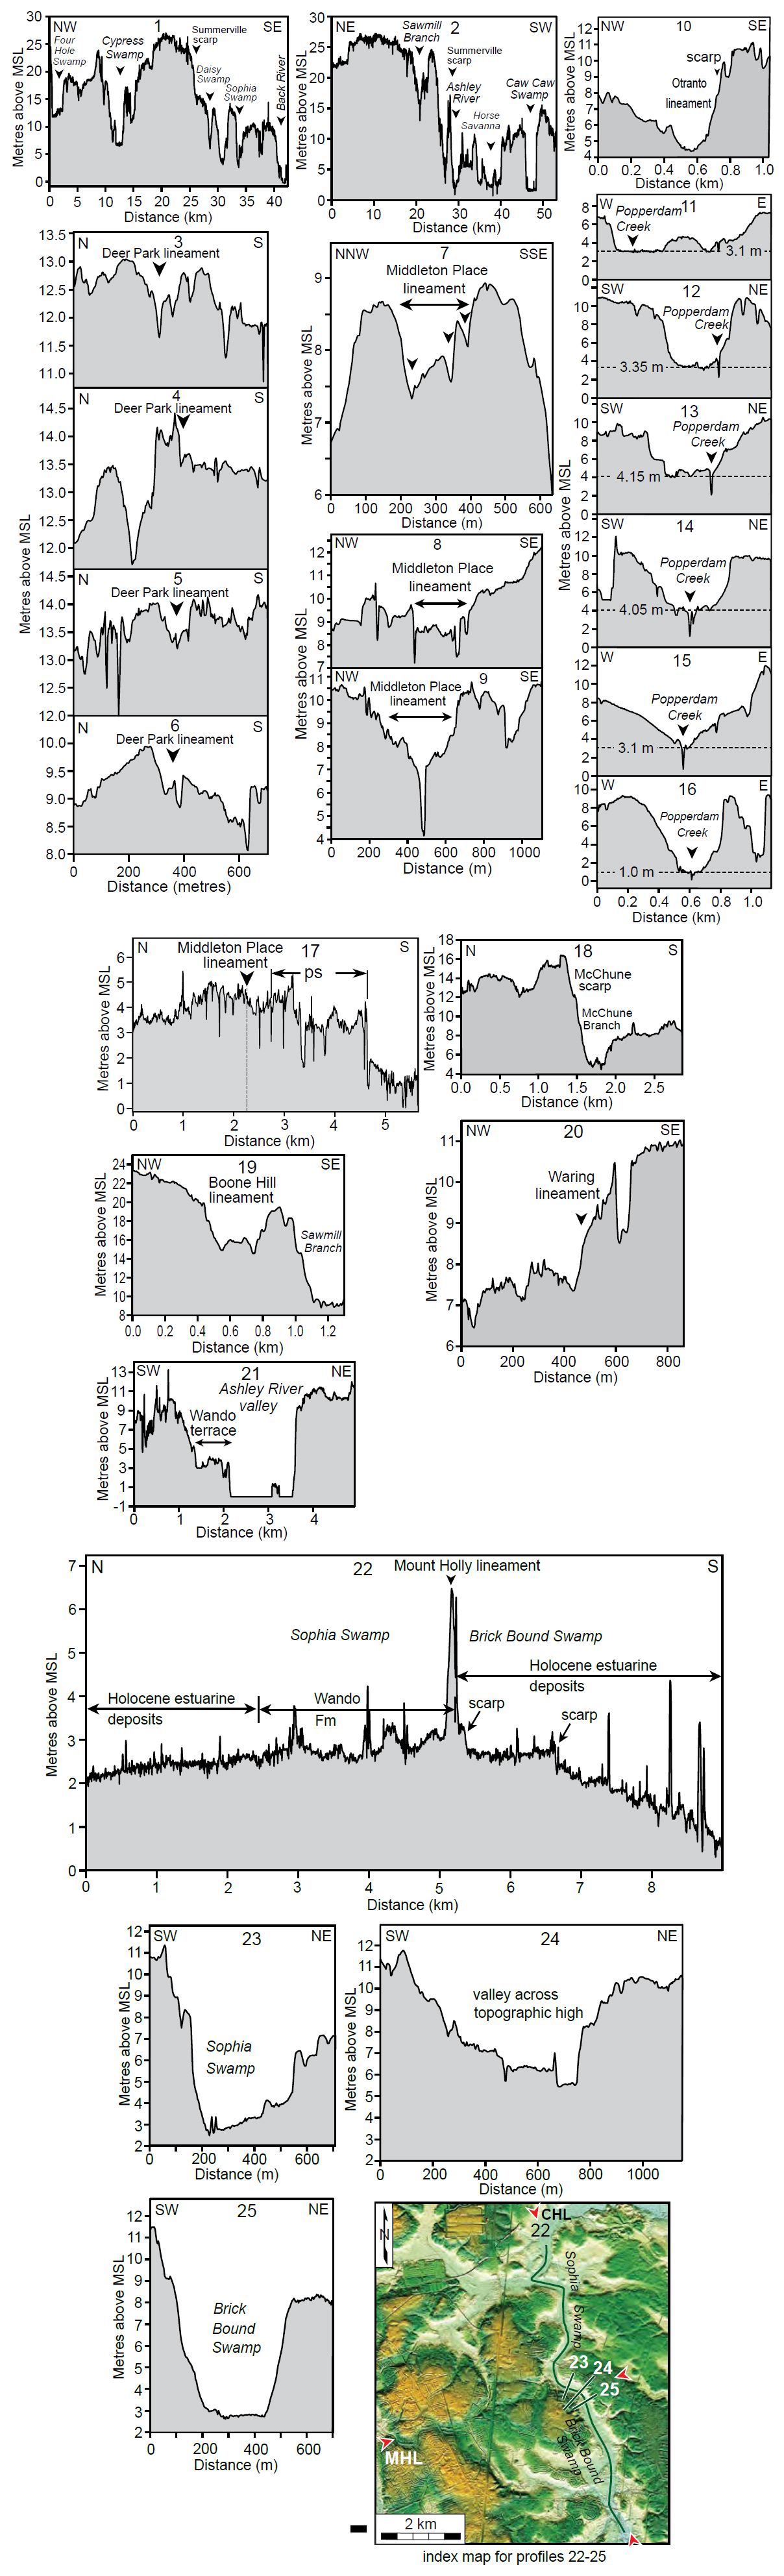
15 Crossing the community of Deer Park is a subtle, E-W-oriented linear depression, herein named the Deer Park lineament, that coincides approximately with the Woodstock epicenter (Figs. 3b and 4). The Deer Park lineament between Bluehouse Swamp and Goose Creek valley is defined by a subtle 0.5- to 1.5-m-deep depression and a gentle 0.5- to 1-m-high, south-facing scarp (Figs. 4 and 5, profiles 3–6). The depression along this part of the lineament deepens into short streams that cut into the valley walls of the Bluehouse and Goose Creek swamps. The Deer Park lineament continues to the west along E-W-oriented segments of Coosaw and Eagle creeks and Sawmill Branch (Fig. 3). East of Goose Creek valley, the Deer Park lineament is collinear with the E-W-oriented segment of Foster Creek valley (Fig. 3).
 Display large image of Figure 4
 Display large image of Figure 5
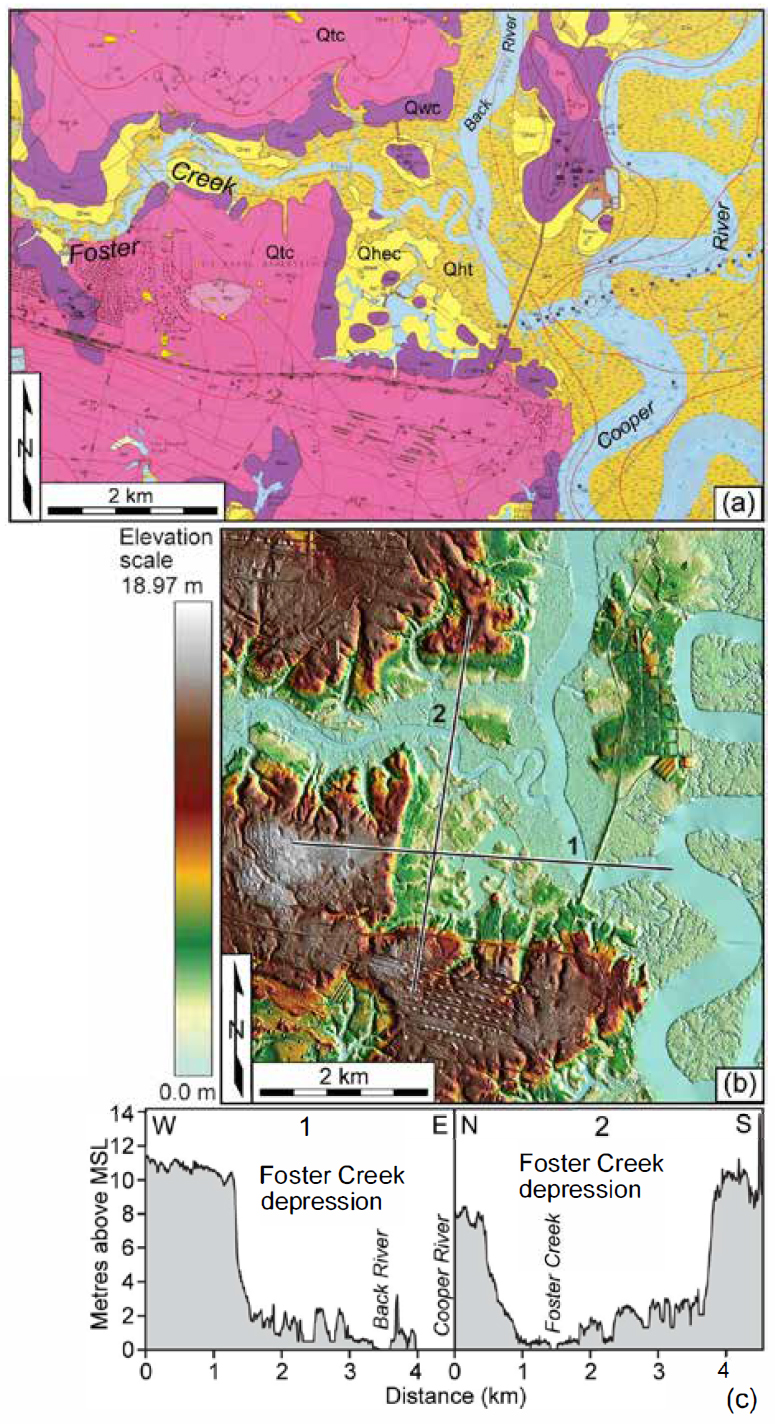
16 Near the mouth of Foster Creek and along the trend of the Deer Park lineament is an unusual, 2 × 2.5-km-size, 7- to 8-m-deep, 3-sided depression bounded by relatively steep scarps intersecting at ~90° and stepping down from the back-barrier deposits of the Ten Mile Hill beds to those of the Wando Formation (Figs. 3 and 6a). The near right angles between the scarps cannot be explained easily by a laterally migrating stream or estuary wave action, which led Weems and Lemon (1993) to conclude that the depression is a tectonic feature younger than the Ten Mile Hill beds (200 ka, Weems and Lemon 1993). We have named this feature the Foster Creek depression.
 Display large image of Figure 6
17 East of the Foster Creek depression and the Cooper River, the Deer Park lineament is collinear with the Grove and Little Johnson creeks (Fig. 3). A 2-km-long eastward-plunging anticlinal fold in the pre-Quaternary surface is located approximately 4 km east of Little Johnson Creek (Weems and Lemon 1989, 1993).
Middleton Place lineament
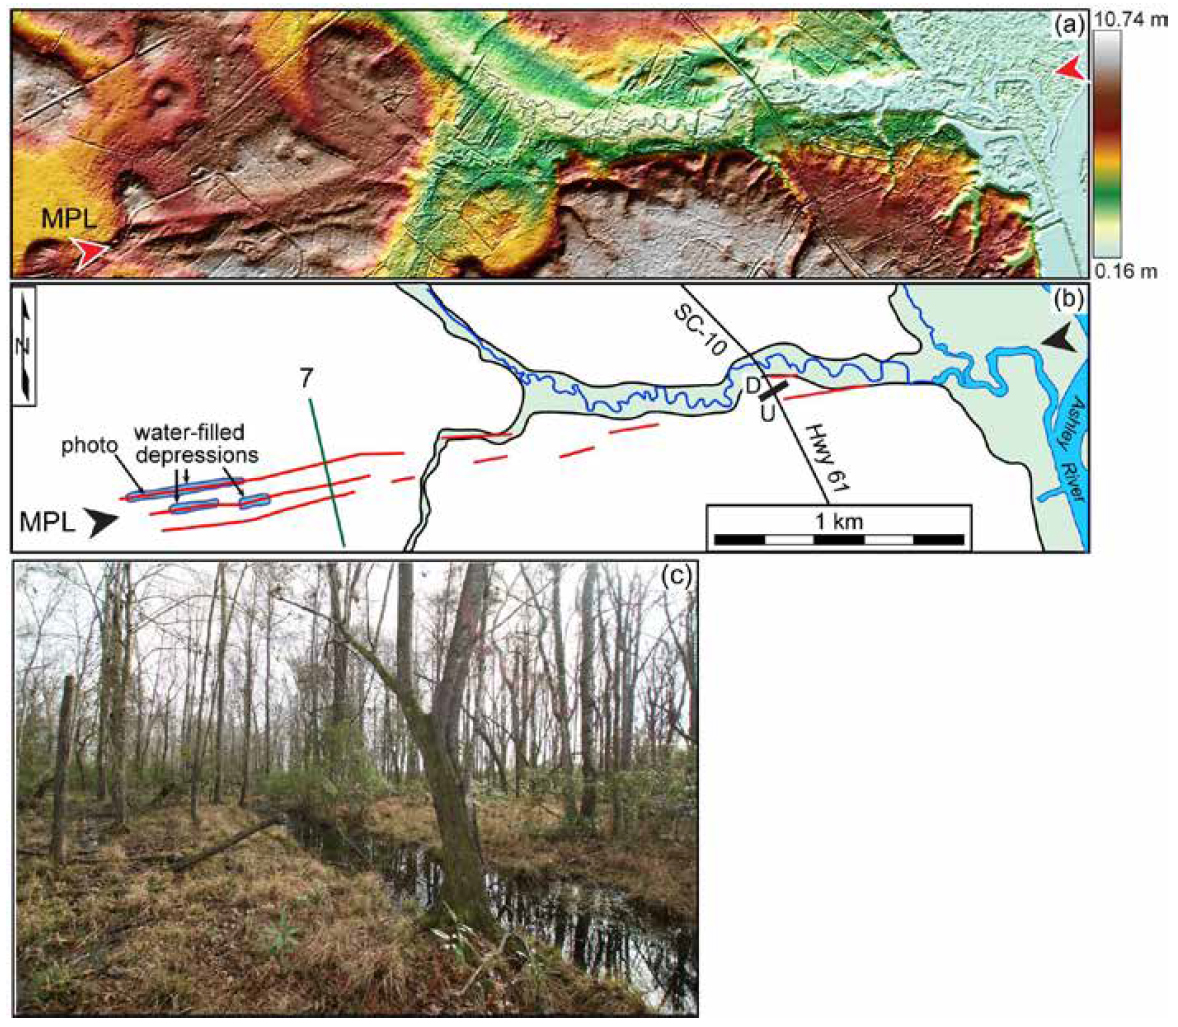
18 The ~17-km-long Middleton Place lineament extends ENE-WSW across the southern end of the MPSSZ to the Goose Creek valley (Fig. 3). Its southwestern end is characterized by an ~180-m-wide zone of 1- to 1.5-m-deep, ~30-m-wide linear depressions that converges with left-stepping en échelon stream segments that drain into the Ashley River to the east (Figs. 5 and 7, profile 7). Within these depressions are linear, ~1-m-wide, water-filled depressions up to 350 m long and only a few cms deep in most places that are developed within late Pleistocene to Holocene swamp sediments (Fig. 7c). East-northeast of this location, the Middleton Place lineament coincides with a steeply dipping, SE-side-up fault interpreted from seismic-reflection profile SC-10 (Fig. 7b). To the east-northeast, the Popperdam Creek is more deeply incised (~2 m) and its floodplain is terrace-like, rather than swampy, where it intersects the lineament (Figs. 3b and 5, profiles 11–16). The valley floor is 1–2 m higher near the lineament than that upstream and downstream (Fig. 5, profiles 13 and 14). A longitudinal profile along the valley floor is convex upward at least 2 m (Fig. 5, profile 17). The lower valley below the lineament, however, is covered in places with 2–3 m of phosphate spoil from mining of phosphate during the last 120 years (Fig. 5, profile 17) (Weems and Lemon 1988), thus making interpretation of incision along the lower valley difficult. East of Popperdam Creek, the Middleton Place lineament is characterized by a subtle, 2- to 6-m-deep linear depression where it crosses the community of Ashley Heights (Fig. 5, profiles 8 and 9) and a sharp ~90° bend in a small tributary of Goose Creek (Fig. 8).
 Display large image of Figure 7
 Display large image of Figure 8
Otranto lineament
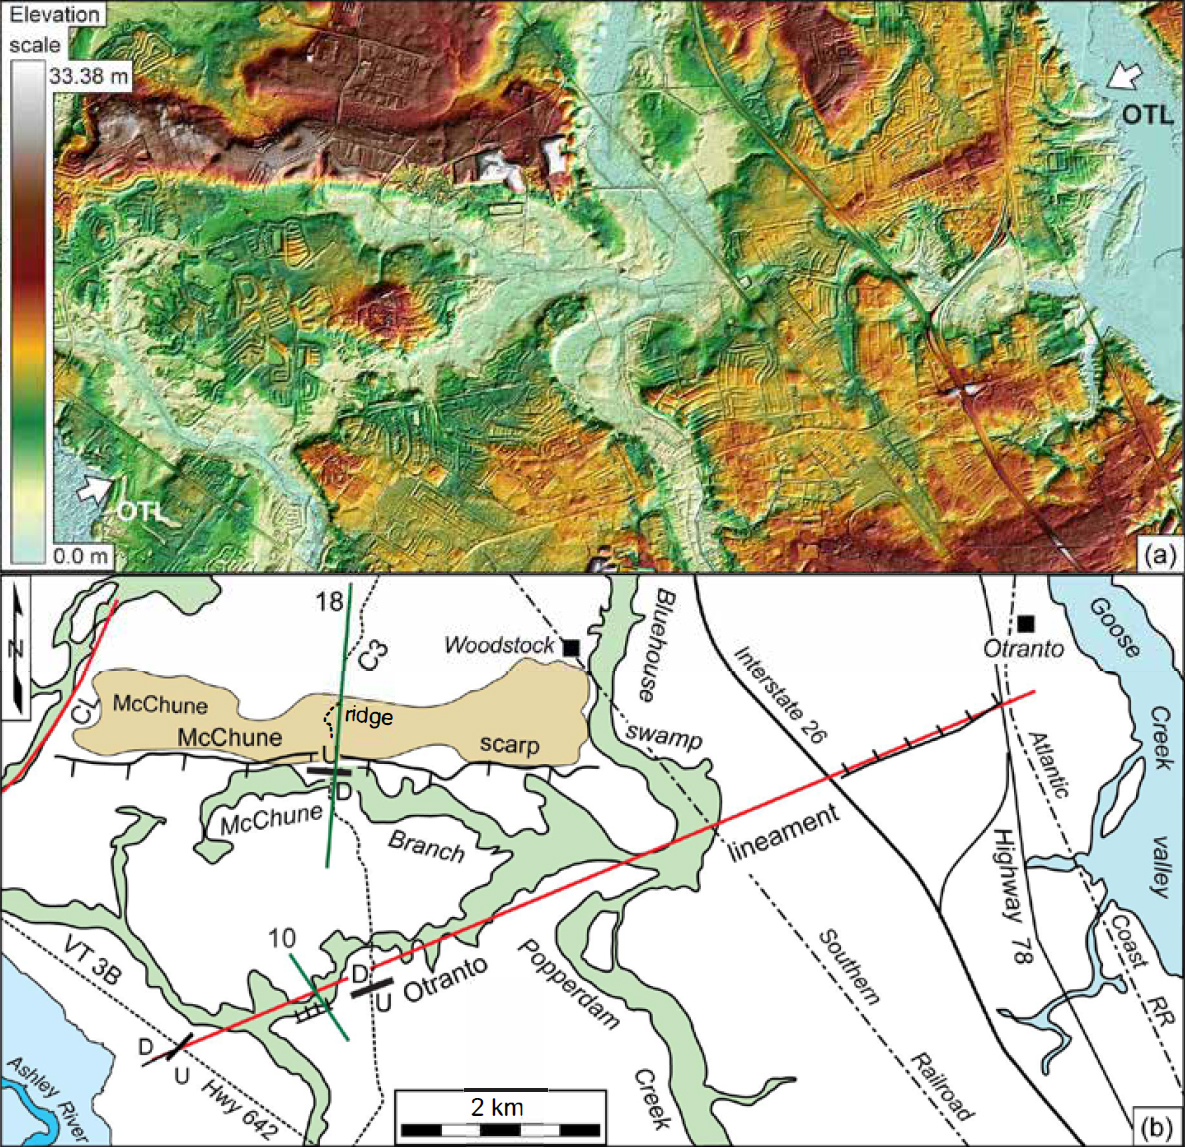
19 The ~10-km-long, NE-SW-trending Otranto lineament extends from the eastern side of the MPSSZ to just south of Otranto (Fig. 3). It is defined by a 3- to 7-m-deep, 5-km-long linear depression (Fig. 5, profile 10) and a 1.5-km-wide, right-stepping deflection of the Bluehouse Swamp (Fig. 9). Along this deflection, the Bluehouse Swamp and Popper-dam Creek valley collectively form an S-shaped curve (Fig. 9). Near Otranto, the Otranto lineament coincides with a 2.5-km-long, north-facing, ~3-m-high gentle scarp. At its southwestern end, the Otranto lineament coincides with two buried, SW-dipping, SW-side-up faults on seismic- reflection profiles VT3B and C3 that offset Cretaceous and Cenozoic strata (figures 2 and 5 of Chapman and Beale 2010) (Fig. 9b).
 Display large image of Figure 9
McChune and Summerwood scarps
20 Just north of the Otranto lineament and extending beyond the topographically high area near Summerville (Fig. 3) is the 10- to 12-m-high, south-facing, E-W-oriented, ~5-kmlong McChune scarp and ~1-km-wide McChune ridge (Fig. 5, profile 18). The 2- to 4-m-deep McChune Branch of the Bluehouse Swamp coincides with the base of the scarp. The scarp also coincides with a small fault-bounded graben along seismic-reflection profile C3 (figure 10 of Schilt et al. 1983) (Fig. 9b). The Cenozoic strata display a small net N-side-up displacement across this structure. The McChune scarp is collinear with the E-W-oriented part of the Summerville littoral scarp to the west where the terrain drops 8 to 10 m to the south (Figs. 3 and 5, profile 2). These two scarps are separated by a ~4-km-wide gap where the Woodstock fault and the NE-SW-oriented Coosaw Creek and Eagle Creek lineaments cross the trend of these 2 scarps (Fig. 3b). The McChune ridge and scarp end abruptly to the west along the Coosaw Creek lineament (Fig. 3b). The 3-km-long, south-facing, E-W-trending Summerwood scarp is northwest of the McChune scarp (Fig. 3). E-W- oriented focal mechanisms coincide with the trends of the McChune and Summerwood scarps (Fig. 1).
Mount Holly lineament
21 The 17-km-long, NE-SW-oriented Mount Holly lineament east of Summerville (Fig. 3b) is defined mainly by a discontinuous series of linear depressions. A ~200-m-wide portion of the valley floor is ~3.5 m higher than along the Brick Bound Swamp to the south and the Sophia Swamp to the north where the lineament intersects the Canterhill lineament, thus forming a drainage divide between these two swamps (Fig. 5, profiles 22–25). The valley floor along these and other swamps along this trend are concave upward (Fig. 5, profile 22). The Wando Formation underlies the 2.5-km reach of the Sophia Swamp along and north of the topographically higher part of the valley (Weems and Lemon 1984a) (Fig. 5, profile 22).
Boone Hill lineament
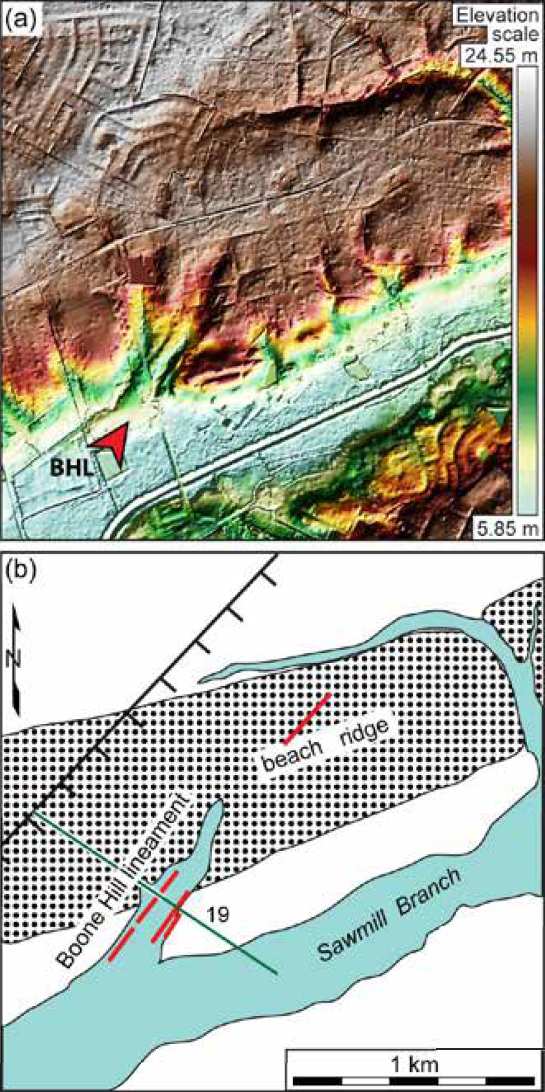
22 Approximately 7 km southwest of Summerville are two NE-SW-oriented linear depressions that collectively form the Boone Hill lineament (Fig. 3). Figure 10 shows an enlarged LiDAR image of the Boone Hill lineament where it intersects the Sawmill Branch valley. Here the lineament is defined by a ~200-m-wide, ~700-m-long zone of 1- to 2-m deep linear depressions within a small valley (Fig. 5, profile 19) that converges with the Sawmill Branch valley. Approximately 3 km to the southwest, the Boone Hill lineament is defined by a ~2.3-km-long linear depression that obliquely crosses the Summerville scarp (Fig. 3b). The Boone Hill lineament is semi-parallel to the Summerville fault to the southeast and lies near a buried, NW-side-up fault on seismic- reflection profile VT-4 (Fig. 3b) that offsets Cretaceous and Cenozoic strata (figure 7 of Chapman and Beale 2010).
 Display large image of Figure 10
Other lineaments
23 The 4-km-long, NW-SE-oriented Ashley River lineament is formed by a relatively straight segment of the Ashley River’s northern valley wall where it crosses the MPSSZ (Fig. 3). The Oligocene Ashley Formation is exposed along the base of this part of the northern valley wall but not along the corresponding south valley wall (Weems and Lemon 1984b), suggesting N-side-up displacement along this lineament. The lineament ends abruptly to the southeast where it intersects the southwest projection of the Otranto lineament (Fig. 3b).
24 The 4-km-long, NE-SW-oriented Waring lineament crosses the southern part of the MPSSZ southwest of the Ashley River lineament (Fig. 3). This lineament is defined by a straight segment of a tributary that drains into the Ashley River and a gentle, 1- to 2-m-high, ~800-m-long, NW-facing scarp to the southwest (Figs. 3 and 5, profile 20). The base of the scarp coincides with a linear, 20–50-m-wide swampy depression. Northeast of and slightly off-trend from the Waring lineament is the ~3-km-long Coosaw Creek lineament that is formed mainly by a relatively straight reach of Coosaw Creek (Fig. 3). Approximately 1 km west of and parallel to the Coosaw Creek lineament is the ~2-km-long NNE-SSW-oriented Eagle Creek lineament that is defined by a straight segment of Eagle Creek (Fig. 3). The Coosaw and Eagle creek lineaments coincide with small buried faults at sites A and B of Figure 3b (figure 4 of Chapman and Beale 2008).
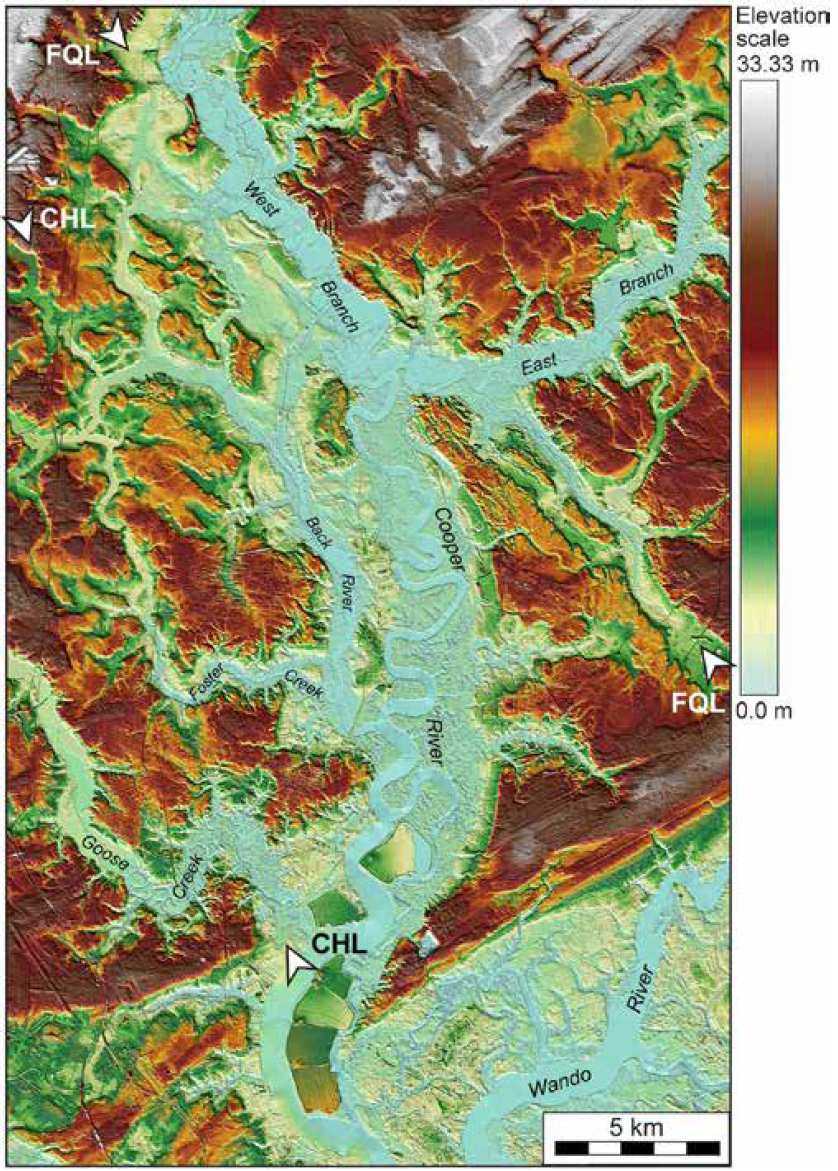
25 The 20-km-long Canterhill lineament east of the MPSSZ is formed primarily by the alignment of the Brick Bound, Sophia, and Canterhill swamps and the NNW-SSE-oriented reaches of the Foster and Goose Creek valleys (Fig. 11). It parallels the nearby Charleston fault (Fig. 1). A prominent, ~20-km-long, 2- to 3-km-wide zone of NW-SE-oriented lineaments, northeast of the Canterhill lineament and collectively named the French Quarter Creek lineament zone, is primarily formed by the alignment of the West Branch of the Cooper River valley and other linear depressions to the northwest with the French Quarter Creek valley and Chipper Swamp to the southeast (Fig. 11). Unlike most streams crossing the Coastal Plain, French Quarter Creek flows northwest away from the coast before emptying into the Cooper River. Other lineaments were interpreted across the study area (Fig. 3b), but are not described here for the sake of brevity.
 Display large image of Figure 11
Dextral offset of a middle Pleistocene beach ridge and other geomorphic features north of Summerville
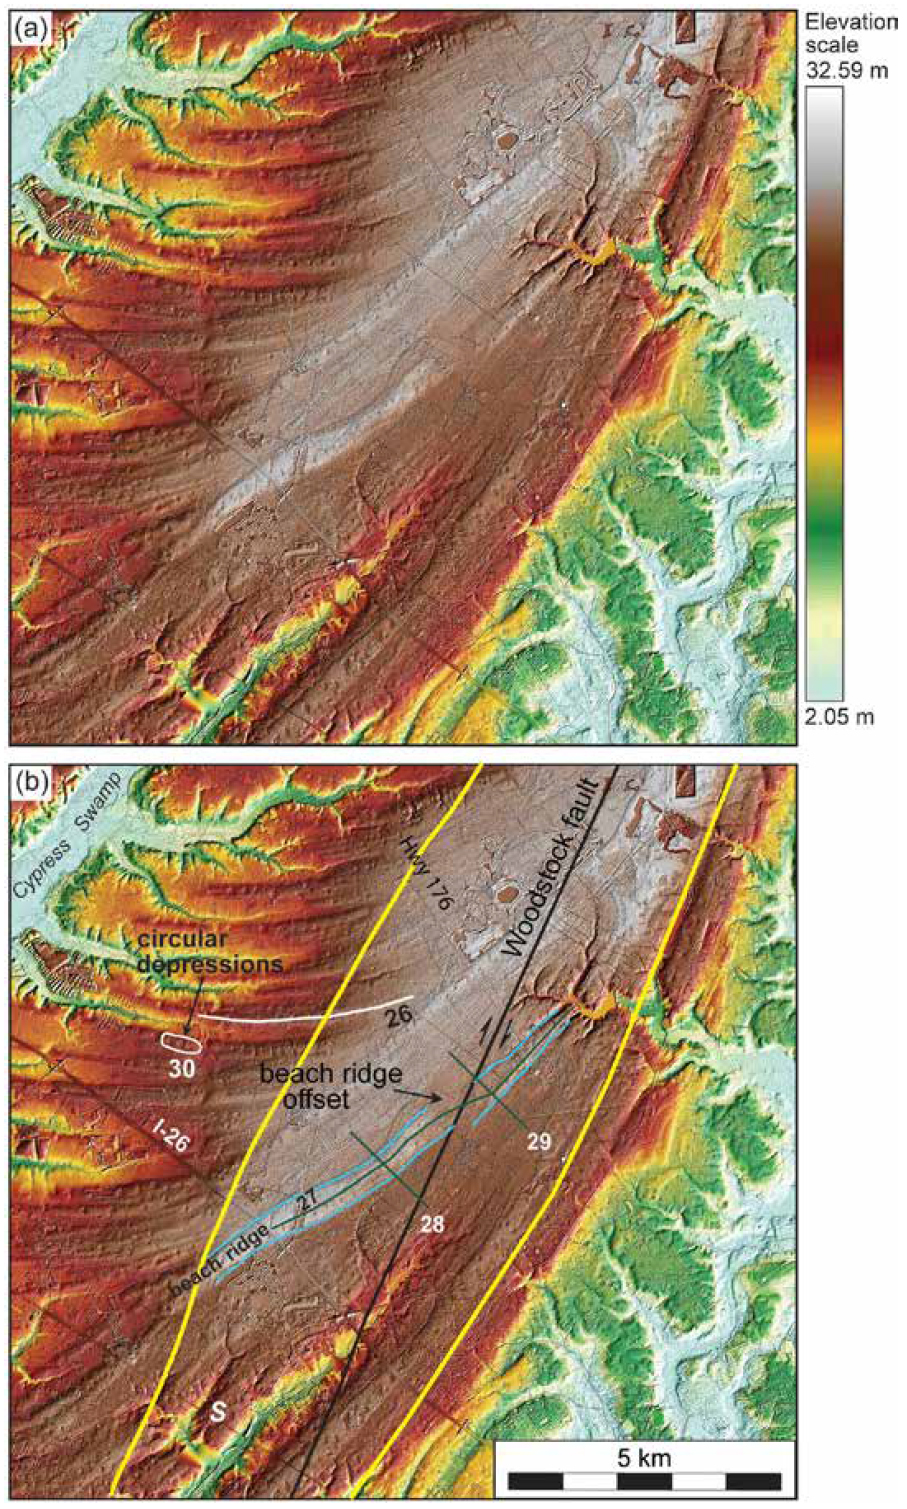
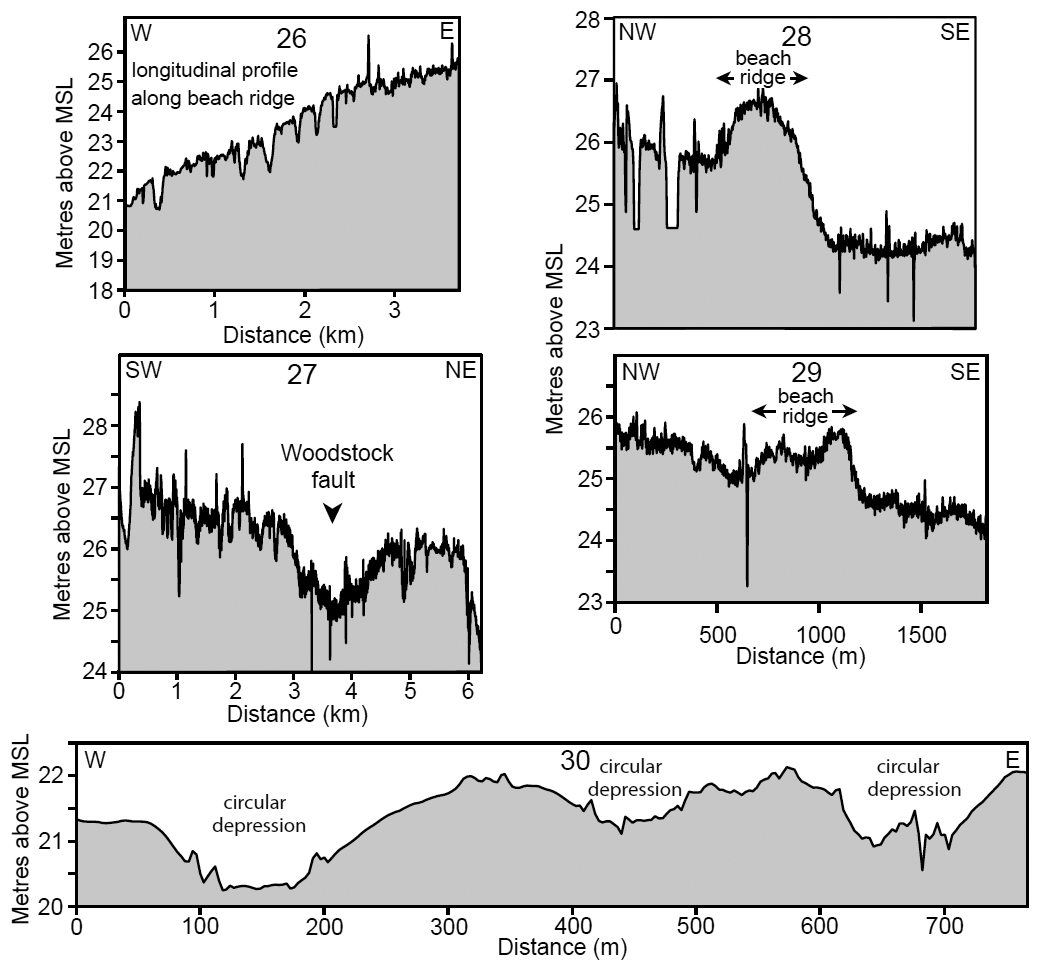
26 Approximately 8 km northeast of Summerville, a middle Pleistocene beach ridge displays ~350-m of dextral offset where it crosses the Woodstock fault at a low angle (Marple and Hurd 2020) (Fig. 12). Approximately 1.5 km of the ridge appears to have been eroded away at this offset (Fig. 13, profile 27). Between Lake Moultrie and the Ashley River, a change in color on the LiDAR image from dark brown (lower elevations) to off-white (higher elevations) indicates that the numerous beach ridges across the Penholoway terrace are 10–15 m higher near the trend of the Woodstock fault (Figs. 2, 12b, and 13, profile 26). This area of elevated beach ridges coincides approximately with the upwarped pre-Pliocene surface of Weems and Obermeier (1989) (Fig. 1). Numerous 30- to 100-m-wide, shallow, 0.7–1.5 m deep circular depressions also exist across the Penholoway terrace and the rest of the study area (e.g., Figs. 12 and 13, profile 30).
 Display large image of Figure 12
 Display large image of Figure 13
DISCUSSION
Origin of the LiDAR lineaments
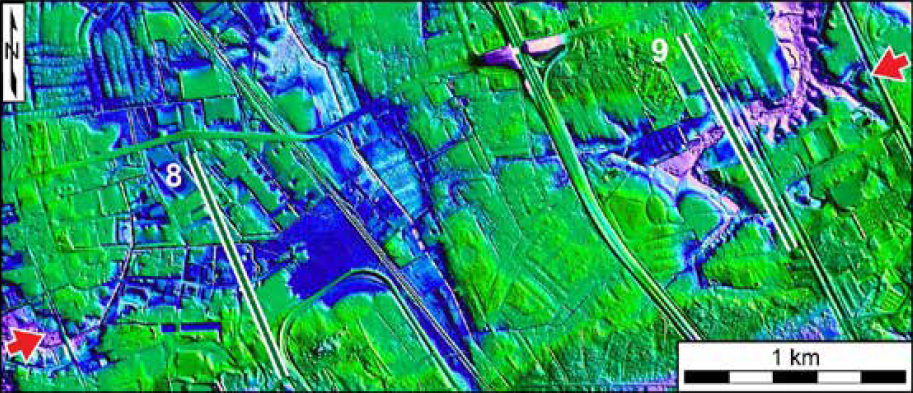
27 Because some of the lineaments coincide with faults interpreted from the seismic-reflection profiles (Figs. 3b and 7b), such as the Middleton Place and Otranto lineaments, it is more likely that they formed from increased erosion along brittle faults that reach the surface. Such a process could explain why many of the lineaments coincide with linear stream valleys (Figs. 3 and 11). Other evidence supports the association of the lineaments with surface faults. The Middleton Gardens lineament (Fig. 3), for example, occurs along the northwestern edge of a buried graben beneath this part of the Ashley River valley (Lennon 1986). Another mechanism that has produced a few lineaments is erosion along linear Pleistocene barrier island deposits, like the blue lineaments in Figure 3b, that formed along Pleistocene beach ridges.
Origin of the McChune and Summerwood scarps
28 Rhea (1989) proposed that the area north and west of the Summerville scarp and east of Four Hole Swamp (Fig. 1) is associated with uplift. The alignment of the E-W-oriented part of the Summerville scarp with the McChune scarp (Fig. 3b), the coincidence of the small fault along seismic-reflection profile C3 with the McChune scarp (Fig. 3b), and the E-W-oriented focal mechanisms along this trend (e.g., Fig. 1) suggest that these two scarps and higher terrain north of the E-W-oriented part of the Summerville scarp may be from N-side-up Quaternary displacements along a buried E-W-oriented fault beneath these two scarps. The greater thickness of the Oligocene Ashley Formation along the northern wall of this part of the Ashley River valley (Weems and Lemon 1984b) further supports uplift north of the Summerville scarp. Moreover, the McChune scarp extends eastward beyond the southern edge of the topographically higher terrain near Summerville (Figs. 2 and 3b). Therefore, the higher terrain north of the Ashley River is likely from gentle uplift that caused the Penholoway terrace and Summerville scarp to develop in their present location, as proposed by Marple and Talwani (2000). The gap between these two scarps is likely from increased erosion along faults associated with the NNE-SSW-oriented Coosaw and Eagle creek lineaments that cross the gap (Fig. 3b). The E-W- oriented focal mechanisms that coincide with the trend of the Summerwood scarp to the north (e.g., Fig. 1) suggest that it too could be fault related.
Possible association of the lineaments with the bend in the Woodstock fault
29 Most of the LiDAR lineaments occur east of the bend in the Woodstock fault where they cross the greatest concentration of seismicity (Fig. 14). This spatial association supports the hypothesis of Marple and Miller (2006) that the interpreted faults east of the bend formed to compensate for the increased compression and change in volume produced by dextral motion along the bend in the Woodstock fault. The clustered seismicity east of the fault bend reflects the anomalously high amount of stress expected at this location. Secondary faults are common along restraining bends in strike-slip faults (e.g., Cunningham and Mann 2007 and references therein). Furthermore, fault bends and associated cross-faults can produce large earthquakes, such as the M 7.9 1857 Fort Tejon, Ms 7.1 1989 Loma Prieta, and Ms 7.5 1992 Landers earthquakes in California, USA (Schwartz et al. 1990; Sieh and Williams 1990; Du and Aydin 1996), and the Ms 1976 Tangshan, China, earthquake (King and Nábělek 1985).
 Display large image of Figure 14
Cause of the 1886 Charleston earthquake
30 Certain observations suggest that the main shock of the 1886 Charleston earthquake may have occurred along a fault associated with the Deer Creek lineament. First, the Deer Creek lineament coincides approximately with the Wood-stock epicenter (Fig. 4b). Secondly, the reversal of compressional thrusting of the railway tracks near the lineament east of the Woodstock epicenter (Fig. 4b, site S2) and the area of compressional ground bulges along the Atlantic Coast Railroad just north of this area in 1886 (page 291 of Dutton 1890) (Fig. 4b, site S1) suggests that the fault associated with the 1886 earthquake crosses this area. Third, the 40-km length of the Deer Park lineament is long enough to have been associated with such a large earthquake. Four, analyses of building damage in parts of Charleston by G.E. Manigault suggest that the seismic waves from the main shock came from the northwest and north (page 96 of Peters and Herrmann 1986), which favors displacement along an E-W- oriented fault long enough to have produced seismic waves from across the northern part of the meizoseismal area, like that associated with the Deer Park lineament. Moreover, the orientation of the Deer Park lineament relative to SHmax (Fig. 14) favors sinistral strike-slip displacement along the postulated fault. Five, we postulate that the Foster Creek depression (Figs. 3 and 6) is evidence for increased erosion caused by a broad zone of fractures along the trend of the Deer Park lineament. Finally, the southward movement of the crust east of the Woodstock fault to the north favors additional loading of strain on the fault associated with this lineament (Fig. 14) until it eventually ruptures in an earthquake.
31 Several observations suggest that the interpreted fault along the Middleton Place lineament may also have ruptured in 1886, although its 17-km length is too short for the main shock to have occurred along it. First, it is located near the Middleton Place epicenter (Fig. 14). Secondly, recent deformation is supported by the convex-up Popperdam Creek valley floor where it crosses the Middleton Place lineament (Fig. 5, profiles 11–17). Third, the shallow, water-filled linear depressions along the southwestern end of the Middleton Place lineament (Fig. 7c) are developed within Holocene swamp deposits (Weems et al. 2014). Similar shallow linear depressions were also noted along part of the Bootheel fault trace in the New Madrid seismic zone (Marple and Schweig 1992, figure 5). Lastly, the Middleton Place lineament crosses the Atlantic Coast Railway where a significant flexure developed in the tracks during the 1886 earthquake (Fig. 3b, site S3).
32 The upwarped valley floors of the Sophia and Brick Bound swamps across the Mount Holly lineament, the increased incision of the Sophia Swamp, and the interpreted 200-m-wide topographically high area between the Sophia and Brick Bound swamps (Figs. 3b and 5, profiles 22–25) suggest that late Pleistocene or Holocene deformation has also occurred along this lineament. The Wando Formation sediments present along Sophia Swamp north of the lineament (Fig. 5, profile 22) suggests that uplift has been sufficient to cause any estuarine sediments that may have once existed along this part of the swamp to be eroded away. Despite the evidence for Holocene deformation along the Mount Holly lineament, it is unlikely that the interpreted fault associated with this lineament ruptured in 1886 because it does not cross the main area of earthquake damage (Fig. 14).
Association of lineaments with domal uplift
33 The coincidence of the Dawson, Magnolia Gardens, and Lambs lineaments along the Ashley River valley with the Fort Bull dome (Fig. 14) suggests that late Cenozoic uplift along these lineaments produced this dome. The local terraces along the Ashley River valley that are developed in the late Pleistocene Wando Formation (Figs. 1 and 5, profile 21) support this conclusion. The entrenched lower Popper-dam Creek valley where it converges with the Ashley River valley (Fig. 5, profile 16) is also likely from Quaternary uplift along the Fort Bull dome (Fig. 1). The orientation of the NW-SE-oriented lineaments with respect to SHmax favors further reverse displacement along these interpreted NW-SE-oriented faults. The coincidence of the Canterhill lineament, which we postulate is the surface expression of the Charleston fault, with the southwestern edge of the Mount Holly and Mount Pleasant domes (Fig. 14) suggests that this interpreted fault has also undergone NE-side-up Quaternary displacements.
Evidence for active tectonics near Summerville
34 Although instrumentally recorded seismicity along the Woodstock fault near Summerville shows that this part of the fault is currently active (Fig. 1), little modern seismicity has occurred along the fault to the northeast where repeated dextral displacements along the Woodstock fault have dextrally offset the middle Pleistocene beach ridge ~350 m (Fig. 12). This observation suggests that numerous large earthquakes have occurred along the Woodstock fault northeast of Summerville in the past. The elevated middle Pleistocene beach ridges along the Penholoway terrace (Figs. 2, 12, and 13, profile 26) and the elevated pre-Pliocene surface beneath this area (Fig. 1) further support long-term deformation along the Woodstock fault. Despite the evidence for late Quaternary deformation along the Woodstock fault, the main shock in 1886 likely did not occur along this fault as it is located northwest of the worst earthquake damage in 1886 (Fig. 14).
35 We also postulate that the numerous 30- to 100-m-wide, 1- to 2-m-deep circular depressions in the northwestern part of the study area (e.g., Fig. 12) may be from earthquake- induced liquefaction, which is outside the area of previously documented liquefaction (e.g., Talwani and Schaeffer 2001). These depressions are not likely Carolina bays since they are commonly circular, rather than elliptical like most Carolina bays (e.g., Moore et al. 2016). If true, then these features may be surface expressions of sand blows associated with large earthquakes along the Woodstock fault northeast of Summerville.
Holocene deformation along the Mount Holly lineament
36 Evidence for Holocene deformation along the Mount Holly lineament is based mainly on the upwarped valley floors of the Brick Bound and Sophia swamps where they intersect the lineament (Fig. 5, profile 22). The V-shaped floor of Sophia Swamp compared to the relatively flat floor of Brick Bound Swamp on opposite sides of the lineament and the exposed Wando Formation sediments along the 2.5-kmreach of the Sophia Swamp north of the lineament (Fig. 5, profiles 22–25) suggest that the Sophia Swamp is incising downward in response to uplift north of the Mount Holly lineament. We hypothesize that the 200-m-wide high area between the two swamps (Fig. 5, profile 22) is from local uplift along the lineament. If true, then these two swamps may have once been a continuous drainage system that has been disrupted by uplift along the Mount Holly lineament.
Advantages of LiDAR data in urban and swampy areas
37 The LiDAR data used in this study demonstrate that subtle tectonic lineaments can be interpreted even in areas where modern urbanization has modified the original landscape. The best two examples are the Deer Park and Middleton Place lineaments where they cross Deer Park and Ashley Heights, respectively (Figs. 4a and 8). Such features would be difficult to interpret using older conventional satellite images and aerial photos. LiDAR data are also useful for searching for evidence of faulting in swampy areas where it is often difficult to traverse the terrain on foot.
CONCLUSIONS
38 In conclusion, we hypothesize that most of the LiDAR lineaments in the study area are associated with active faults that ruptured the ground surface either in 1886 or during previous Holocene earthquakes. The greater concentration of interpreted faults east of the bend in the Woodstock fault suggests that they are associated with compressional stresses caused by dextral motion along the fault bend. We postulate that the main shock of the 1886 Charleston, South Carolina, earthquake may have been caused by sinistral strike-slip displacement along the 40-km-long, ENE-WSE-oriented Deer Park lineament based on its orientation relative to SHmax and its close proximity to the Woodstock epicenter. The proposed 17-km-long Middleton Place fault may have also ruptured in a smaller earthquake in 1886 based on its proximity to the Middleton Place epicenter and a severe flexure that developed in the Atlantic Coast Railroad tracks where they intersect the eastern end of the Middleton Place lineament. Despite the lack of seismicity east of the MPSSZ, the Fort Bull dome along the Ashley River fault zone and the Mount Holly and Mount Pleasant domes along the northeastern side of the Canterhill lineament (Charleston fault) indicates that these faults have been active during the late Tertiary. Evidence for late Quaternary deformation along the Woodstock fault north of the Ashley River includes the elevated beach ridges and the ~350-m dextral offset of the middle Pleistocene beach ridge along the Woodstock fault, which indicates that the fault has ruptured the ground surface numerous times in the past. Lastly, the numerous 30–100-m-size shallow circular depressions that exist across the study area are likely related to earthquake-induced liquefaction, rather than Carolina bays.
39 Further geological and geophysical studies are needed to document faulting along the LiDAR lineaments and to better estimate the seismic hazard potential of the Charleston region because of the recent large increase in population in the meizoseismal area of the 1886 Charleston earthquake. A large earthquake today in the Charleston region would likely cause tremendous damage and loss of life.
ACKNOWLEDGEMENTS
We thank reviewers Randy Cox and John Adams for their many constructive comments that helped improve this paper. We also thank Atlantic Geology editor Sandra Barr for her scientific feedback and help in formatting this manuscript.
REFERENCES
Editorial responsibility: Sandra M. Barr