Articles
LIDAR and other evidence for the southwest continuation and Late Quaternary reactivation of the Norumbega Fault System and a cross-cutting structure near Biddeford, Maine, USA
ABSTRACT
High-resolution LiDAR (light detection and ranging) images reveal numerous NE-SW-trending geomorphic lineaments that may represent the southwest continuation of the Norumbega fault system (NFS) along a broad, 30- to 50-km-wide zone of brittle faults that continues at least 100 km across southern Maine and southeastern New Hampshire. These lineaments are characterized by linear depressions and valleys, linear drainage patterns, abrupt bends in rivers, and linear scarps. The Nonesuch River, South Portland, and Mackworth faults of the NFS appear to continue up to 100 km southwest of the Saco River along prominent but discontinuous LiDAR lineaments. Southeast-facing scarps that cross drumlins along some of the lineaments in southern Maine suggest that late Quaternary displacements have occurred along these lineaments. Several NW-SE-trending geomorphic features and geophysical lineaments near Biddeford, Maine, may represent a 30-km-long, NW-SE-trending structure that crosses part of the NFS. Brittle NWSE-trending, pre-Triassic faults in the Kittery Formation at Biddeford Pool, Maine, support this hypothesis.
RÉSUMÉ
Des images haute résolution prises par LiDAR (détection et télémétrie par ondes lumineuses) dévoilent de nombreux linéaments orientés du NE vers le SO qui pourraient représenter la continuité au sud-ouest du système de failles de Norumbega (SFN) le long d’une vaste zone de 30 à 50 km de largeur de failles cassantes qui se poursuit sur au moins 100 km à travers le sud du Maine et le sud-est du New Hampshire. Ces linéaments se caractérisent par des dépressions et des vallées linéaires, un réseau hydrographique linéaire, des virages abrupts dans les rivières et des escarpements linéaires. Les failles de la rivière Nonesuch, de South Portland et de Mackworth du SFN semblent se poursuivre jusqu’à 100 km au sud-ouest de la rivière Saco, le long de linéaments proéminents, mais discontinus, mis en lumière par LiDAR. Les escarpements orientés vers le sud-est qui traversent des drumlins le long de certains des linéaments du sud du Maine donnent à penser que des déplacements remontant à la fin du Quaternaire se sont produits le long de ces linéaments. Plusieurs objets géomorphiques et linéaments géophysiques orientés du NO au SE près de Biddeford, au Maine, pourraient représenter une structure de 30 km de longueur allant du NO vers le SE et traversant une partie du SFN. Les failles cassantes orientées du NO au SE, datant d’avant le Trias et présentes dans la formation de Kittery à Biddeford Pool appuient cette hypothèse.
[Traduit par la redaction]
INTRODUCTION
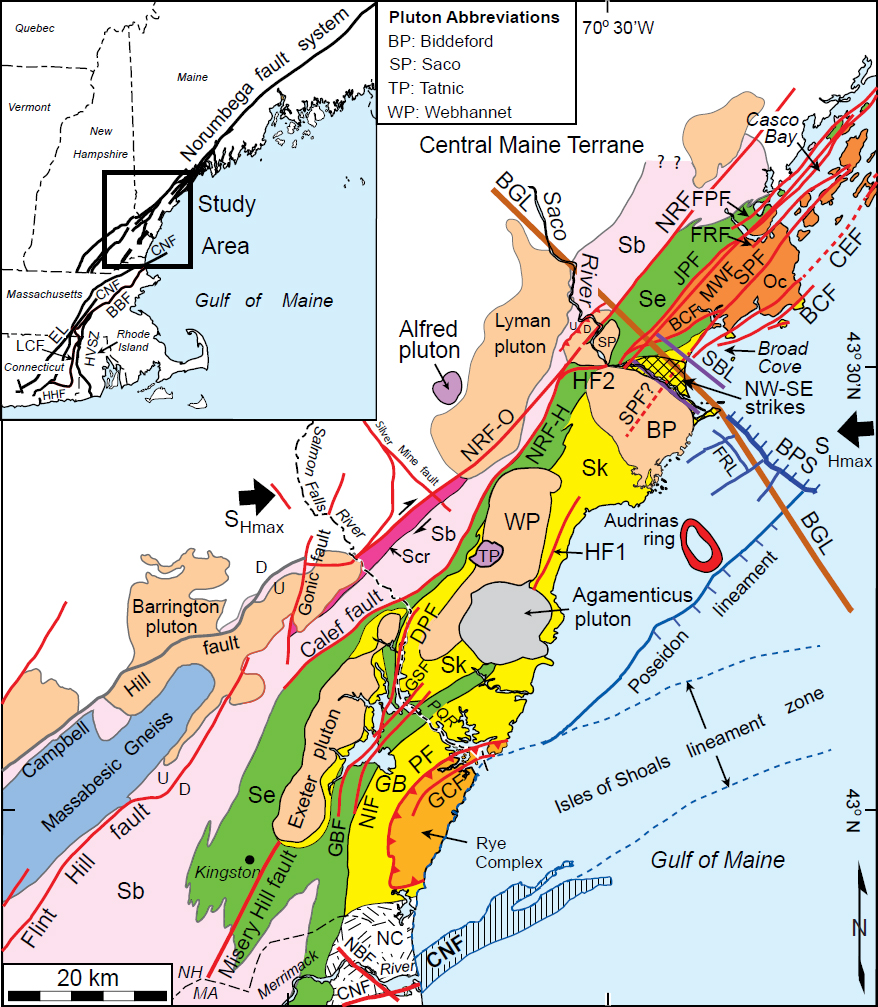
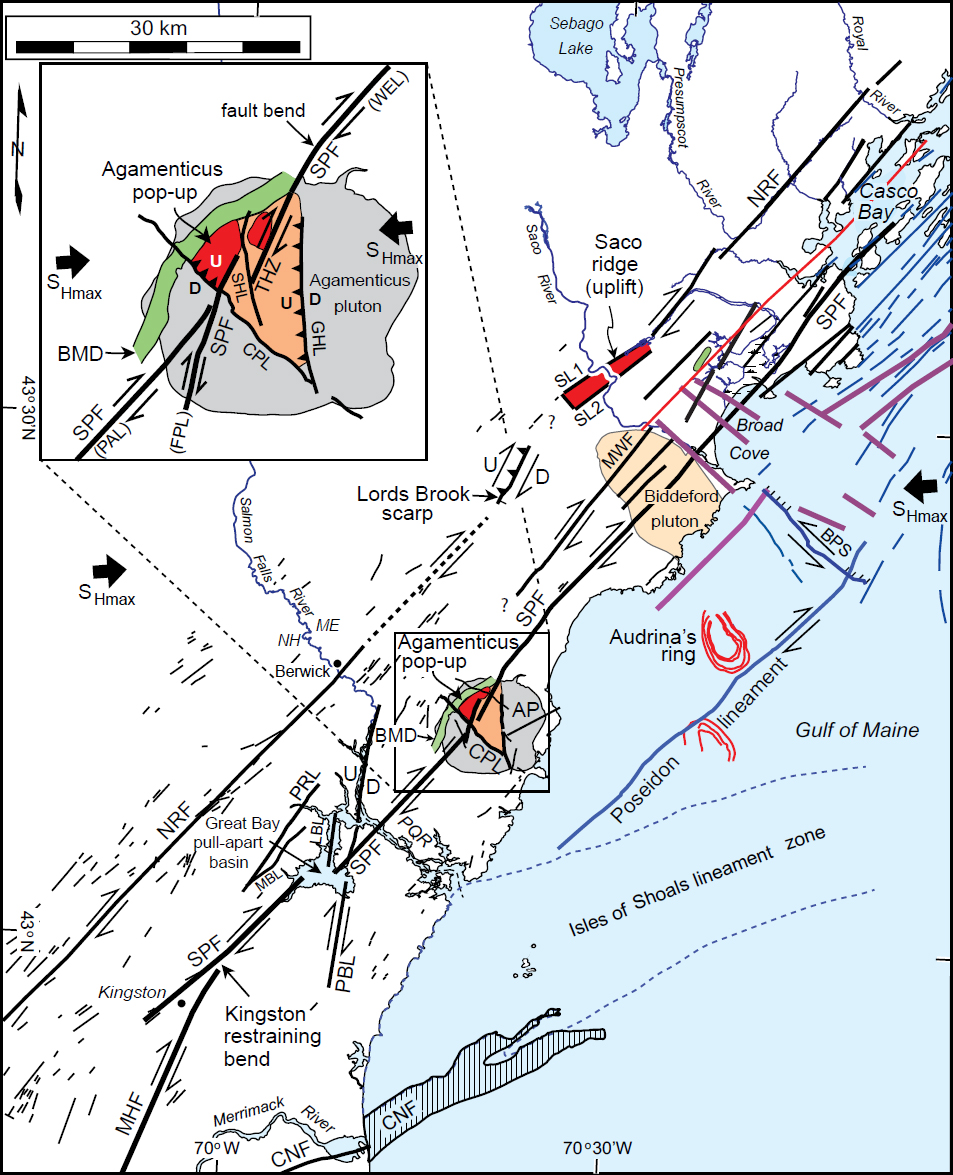
1 The Norumbega fault system (NFS) is a NE-SW-trending, predominantly dextral transpressive fault system that continues from southwestern New Brunswick to the Saco River in southern Maine (e.g., Ludman and West 1999) (Fig. 1). It is generally characterized by a zone of dextral shear tens of kilometres wide containing numerous <1 km wide mylonite zones (West and Hubbard 1997; Wang and Ludman 2004). The NFS dips steeply to the northwest and offsets the Moho (Doll et al. 1996). Dextral shear along the NFS began during the Middle Devonian and may have exceeded 100 km (Ludman et al. 1999). Additional dextral strike-slip motion occurred along the NFS in northeastern Maine during the Late Devonian(?) through Mississippian and then changed to oblique, reverse-sinistral motion during the Permian (Wang and Ludman 2003). Normal displacements occurred along the NFS during Triassic-Jurassic rifting (Goldstein and Hepburn 1999) and again during the Early Cretaceous (Roden-Tice and West 2003).
 Display large image of Figure 1
2 The continuation of the NFS southwest of Casco Bay, Maine, has been controversial. Goldstein and Hepburn (1999) and Hibbard et al.(2006), for example, suggested that the NFS continued to the southwest along the Clinton-Newbury, Lake Char, Honey Hill, Wekepeke, and Bloody Bluff faults in southern New England, none of which have the same kinematics, orientation, and timing of deformation as the mid-Paleozoic dextral NFS (Goldstein and Hepburn 1999). Bothner and Hussey (1999) suggested that the NFS may be correlated with the Portsmouth fault zone in coastal New Hampshire and the Calef and Nannie Island faults in southern Maine and New Hampshire (Fig. 1). The Calef fault, however, shows no evidence for dextral movement (Gentry et al. 2018). Kuiper and Wakabayashi (2018), in contrast, postulated that the NFS ends abruptly near Biddeford, Maine, along a transform fault associated with a Devonian triple junction. However, the aeromagnetic and gravity anomaly maps of Daniels and Snyder (2004) and multibeam sonar data offshore (Marple and Hurd 2019) show no evidence for such a transform fault.
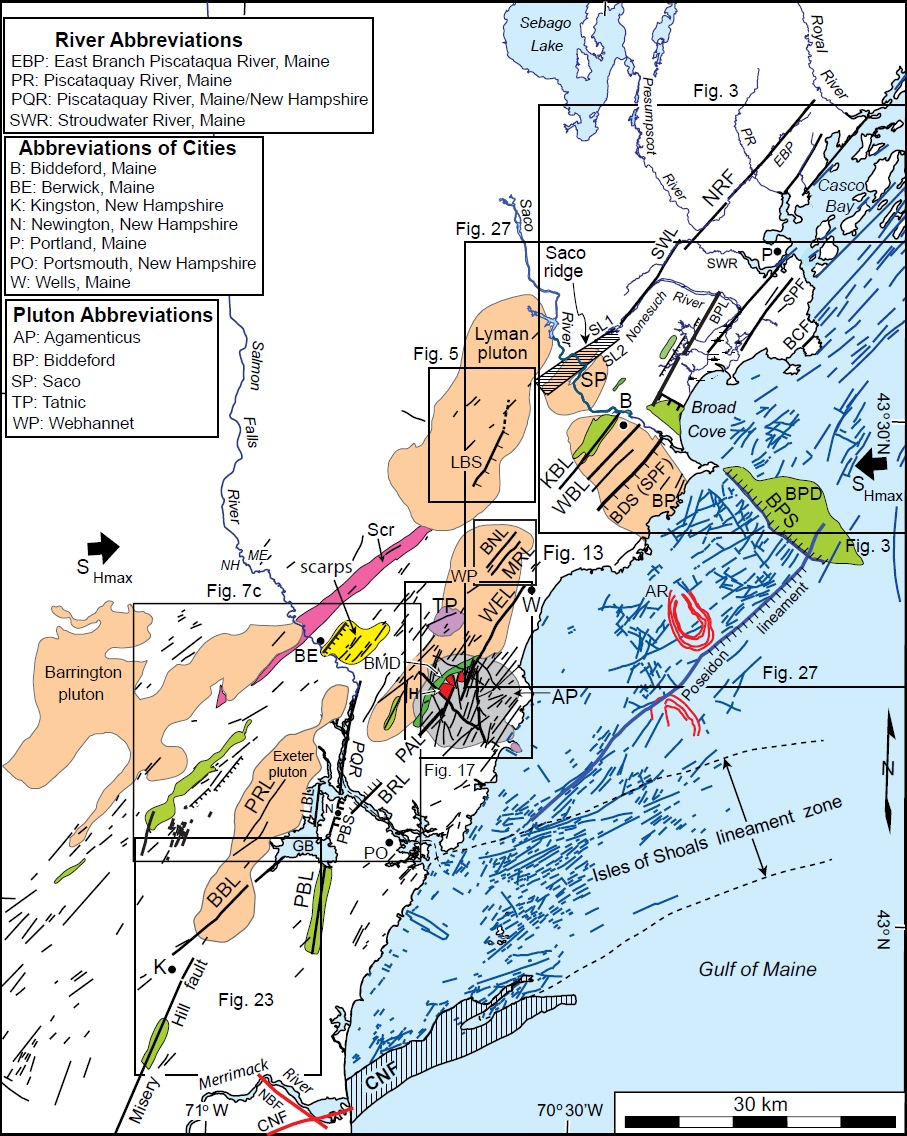
3 Our main goal in this study is to use primarily LiDAR data to determine if the NFS continues southwest of the Saco River. Our results reveal a 35- to 50-km-wide zone of mostly NE-SW-oriented lineaments that continue at least 100 km southwest of the Saco River (Figs. 2 and 3). They also reveal several NW-SE-trending features near Biddeford, Maine, that cross the trend of the NFS.
 Display large image of Figure 2
 Display large image of Figure 3
METHODS AND DATA USED
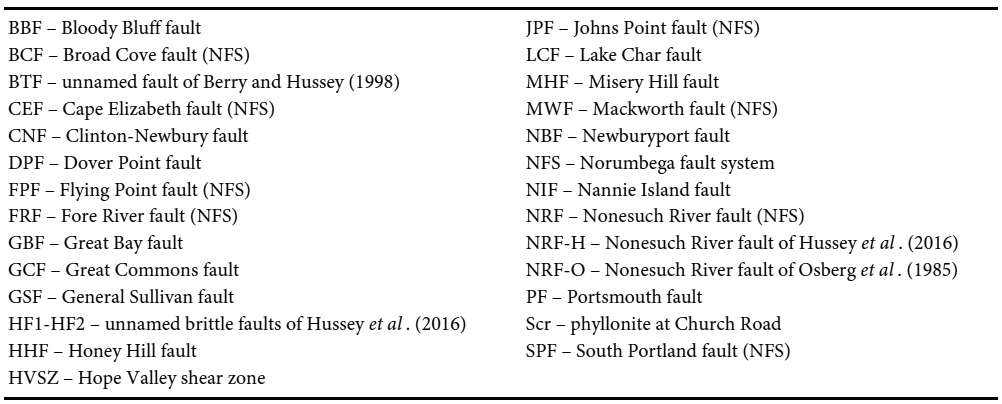
4 The LiDAR data used for this study were acquired from the MEGIS (2016) and NH GRANIT (2016) websites. We used the Hillshade tool of ArcGIS to generate shaded relief images from the DEM data using various illumination azimuths, an elevation angle of 25°, and a vertical exaggeration of ten times. Unless otherwise stated, the illumination azimuth used for images in this study was 080°. Color relief images were then generated using a color scheme based on elevations of the terrain. Basic contrast enhancement routines of Adobe Photoshop were used to digitally enhance the LiDAR images. Low contrast images were enhanced further using the intensity-hue-saturation (IHS) routine of Adobe Photoshop. We were not able to generate elevation scales for these images because the IHS enhancement significantly changes their color schemes. The LiDAR data were also used to construct detailed topographic profiles across selected features to quantify elevation changes across them. The vertical scale of exaggeration of these profiles was highly exaggerated to help highlight the various geomorphic features. Lineaments were compared to topographic and geologic maps at various scales to ensure that they are not associated with foliation planes, changes in lithology, or glacial landforms. Rose diagrams were also generated for the lineaments interpreted across the Biddeford and Agamenticus plutons of southern Maine using the stereonet programs of Allmendinger et al. (2013) and Cardozo and Allmendinger (2013). Some of the more prominent linear depressions and scarps were then field checked to visualize them on the ground and to look for evidence of faulting on them, such as slickensides, breccia, and offset bedrock units. Abbreviations of the various faults, lineaments, scarps, and topographic depressions and highs are summarized in Tables A1 and A2 in the Appendix.
GEOLOGIC SETTING OF THE STUDY AREA
Surficial geology and glacial landforms
5 The surficial sediments in the study area are predominantly Pleistocene glacial till, glaciomarine facies, and relatively thin Holocene fluvial deposits (e.g., Thompson and Borns 1985). The till consists of poorly sorted gravel, sand, silt, and clay. The glaciomarine facies generally consist of laminated pebbly mud, coarse-grained ice-rafted debris, gravelly sandy mud, and clayey silts (Thompson and Borns 1985).
6 The most common glacial landforms in the study area are drumlins, end moraines, and eskers. The up-ice side of drumlins is typically steep while the down-ice side is smooth and tapers gently in the direction of ice movement (Thompson and Born 1985). The orientations of the drumlins and end moraines indicate that the Laurentide ice sheet moved southeastward across the study area.
Terranes and plutons
7 The main geological terranes southwest of Casco Bay are the NE-SW-trending Central Maine and Merrimack terranes and the Casco Bay Group (Fig. 1). They consist primarily of metamorphosed shale, siltstone, and sandstone that accumulated in two ancient ocean basins, the Central Maine Basin to the west and the Merribuckfred Basin to the east (Hussey et al. 2010). The Early Silurian or Late Ordovician Eliot and Kittery formations form most of the Merrimack terrane in the study area and the Silurian Berwick Formation forms the eastern side of the Central Maine Basin (Fig. 1). The Eliot Formation consists of thin-bedded medium buff to grey-weathering calcareous metasiltstone and dark grey slate or phyllite and the Kittery Formation consists of a thin- to thick-bedded sequence of fine-grained calcareous and feldspathic metawacke and lesser metashale (Hussey et al. 2016). The Middle to Late Ordovician Casco Bay Group, northeast of the Kittery Formation, consists of phyllite, schist, granofels, amphibolite, marble, and gneiss (Berry and Hussey 1998). The Berwick Formation to the west consists of an interbedded sequence of calcareous and non-calcareous feldspathic metawacke with minor biotiterich schist (Hussey et al. 2016).
8 These terranes were intruded by Early Devonian to Cretaceous plutons that vary in size and shape (Hussey et al. 2016; Lyons et al. 1997) (Fig. 1). Except for the NW-SE-oriented Biddeford pluton, most of the Paleozoic plutons in the study area are elongate in a NE-SW direction. The Mesozoic plutons, in contrast, are roughly circular in map view. Because the plutons are more resistant to erosion than the surrounding terranes, they tend to form areas of higher terrain where the glacial and glaciomarine sediments are thinner. Consequently, geomorphic lineaments are more numerous and conspicuous across the plutons.
LIDAR OBSERVATIONS
9 Because the LiDAR images revealed numerous lineaments, only the most prominent lineaments are described here along the southwest projections of the Nonesuch River (NRF), Mackworth (MWF), and South Portland (SPF) faults. Except for the ENE-WSW-trending Broad Cove fault, most of the lineaments between Casco Bay and the Saco River coincide with or are nearly parallel to faults of the NFS (Fig. 3). These lineaments are characterized by linear depressions, straight stream segments, and ~90° bends in rivers (Fig. 3).
Lineaments along the trend of the NRF
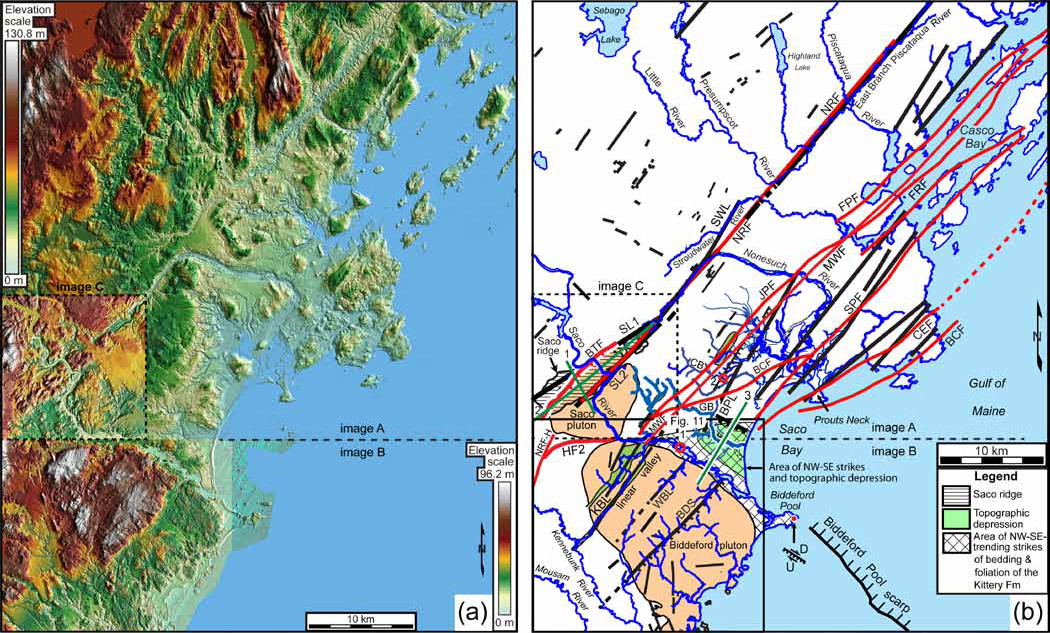
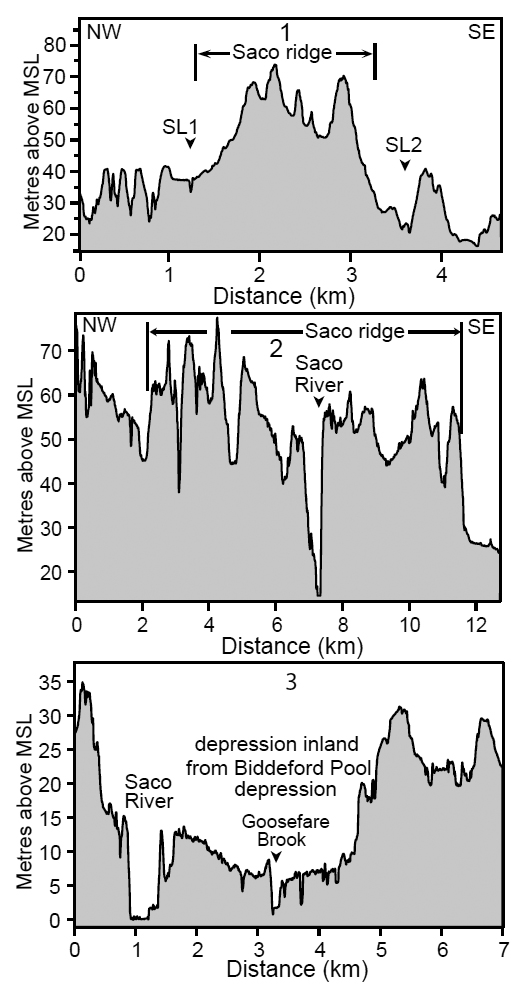
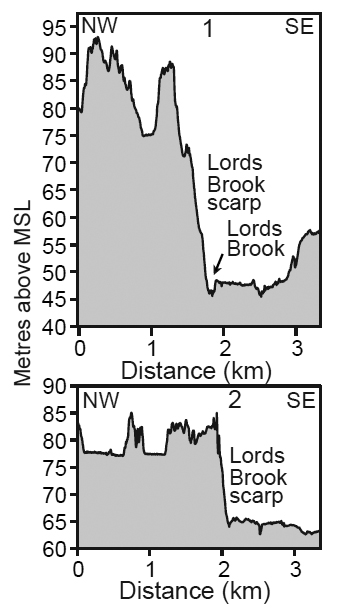
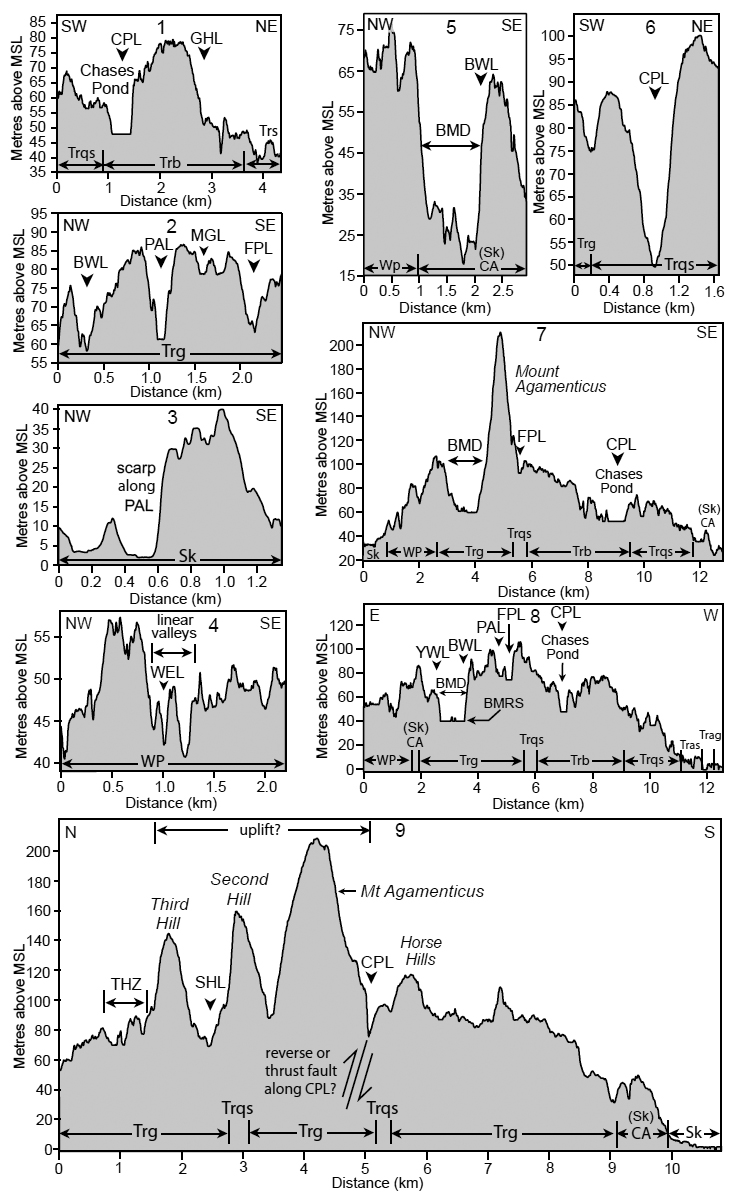
10 West of Casco Bay, the NRF coincides with linear NE-SW-trending segments of the Presumpscot River and the East Branch of the Piscatiqua River (Fig. 3). The next segment of the NRF to the southwest coincides with a lineament, herein named the Stroudwater lineament, that is formed by straight stream segments of the Stroudwater and Nonesuch rivers. The Stroudwater lineament is offset to the northwest ~2 km from the NRF to the northeast (Fig. 3). To the southwest, the Stroudwater lineament is collinear with lineaments SL1 and SL2 where they cross the Saco pluton and Berwick Formation (Fig. 3b). Here SL1 forms a ~14° counterclockwise (CCW) bend with the Stroudwater lineament (Fig. 3). SL1 and SL2 also bound a linear, ~2-km-wide, 10-km-long, NE-SW-oriented 30-m-high area, here named Saco ridge, between the two 90° bends in the Saco River (Figs. 3b and 4, profiles 1 and 2). SL2 coincides with the NRF and SL1 occurs near an unnamed southeast-dipping, NE-SW-oriented thrust fault of Berry and Hussey (1998) (Fig. 3b).
 Display large image of Figure 4
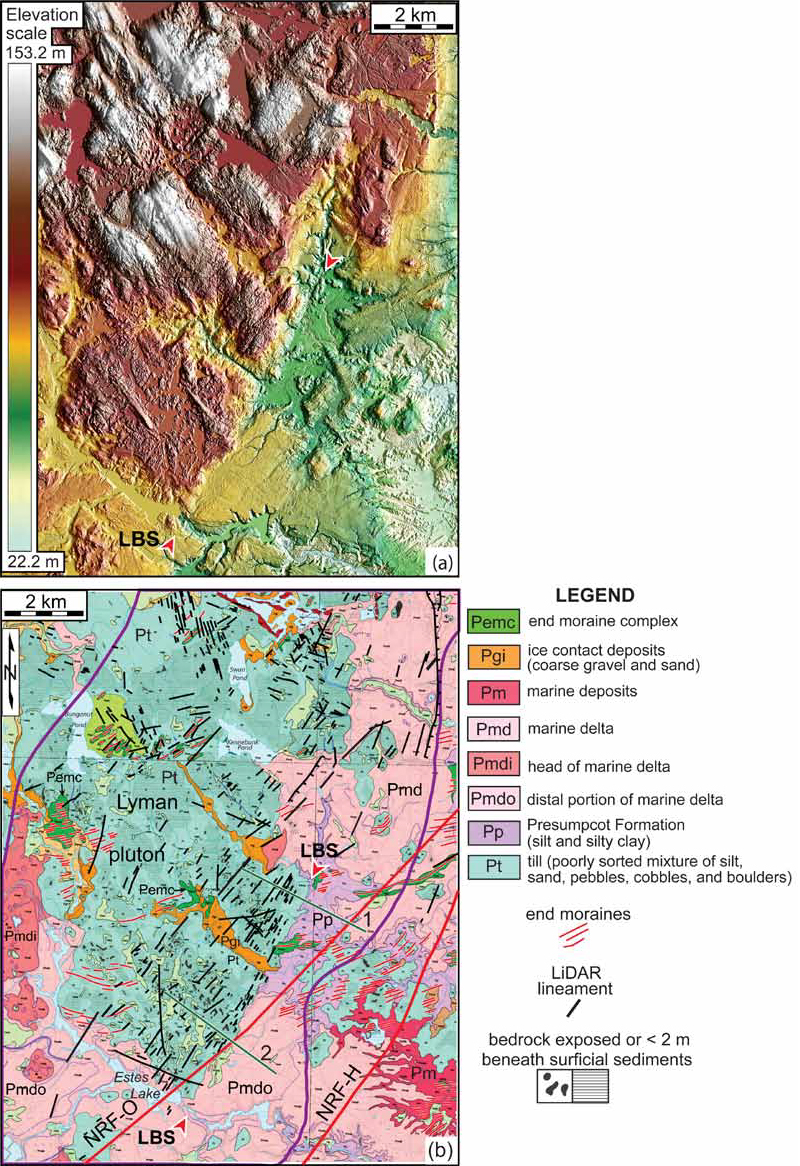
11 Approximately 3 km southwest of Saco ridge and along the NRF trend is the ~12-km-long, 40-m-high, NE-SW-trending, east-facing Lords Brook scarp that crosses the Lyman pluton at an angle of ~17° CCW to the general trend of the NRF to the northeast (Figs. 2, 5, and 6). The scarp is also highlighted on surficial geologic maps by a change from mostly glacial till above (west of) the scarp to glaciomarine sediments at the lower elevations east of the scarp (Fig. 5b).
 Display large image of Figure 5
 Display large image of Figure 6
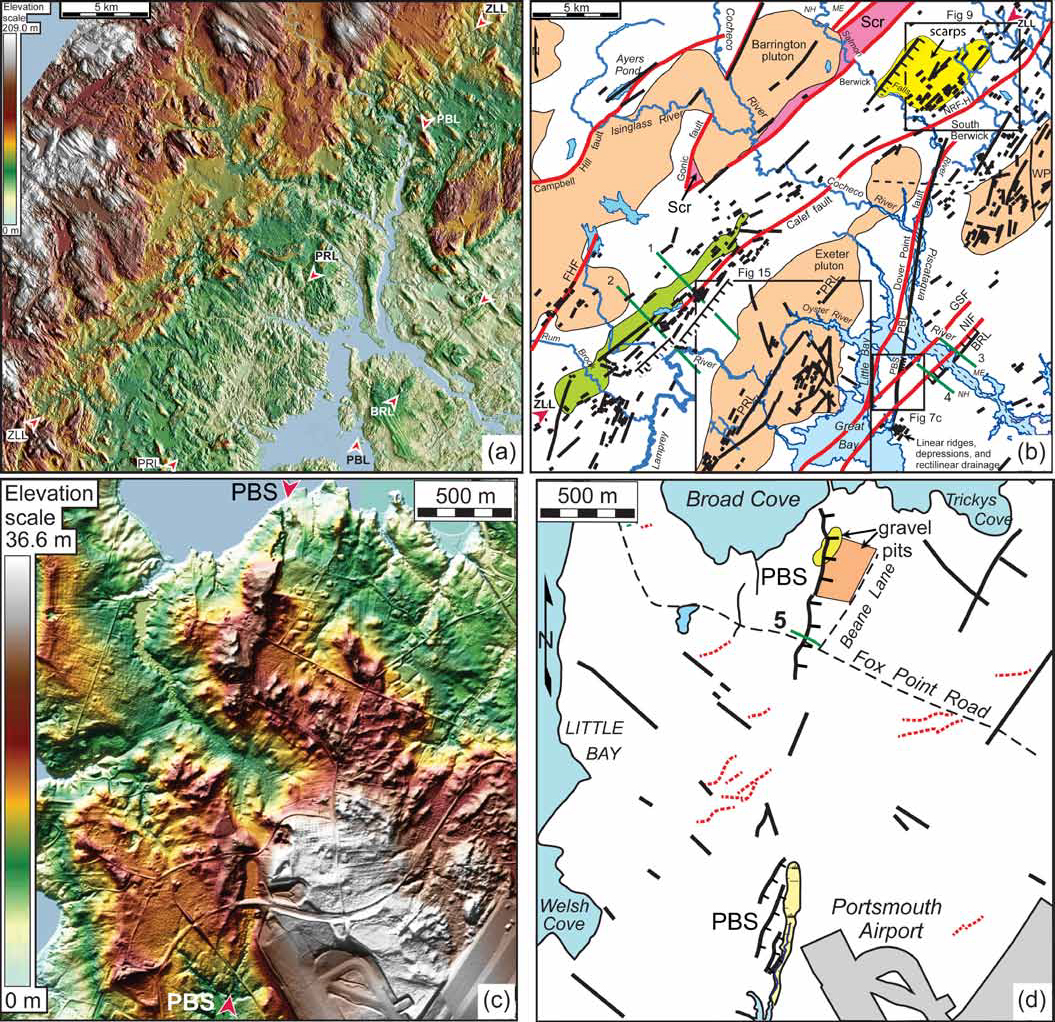
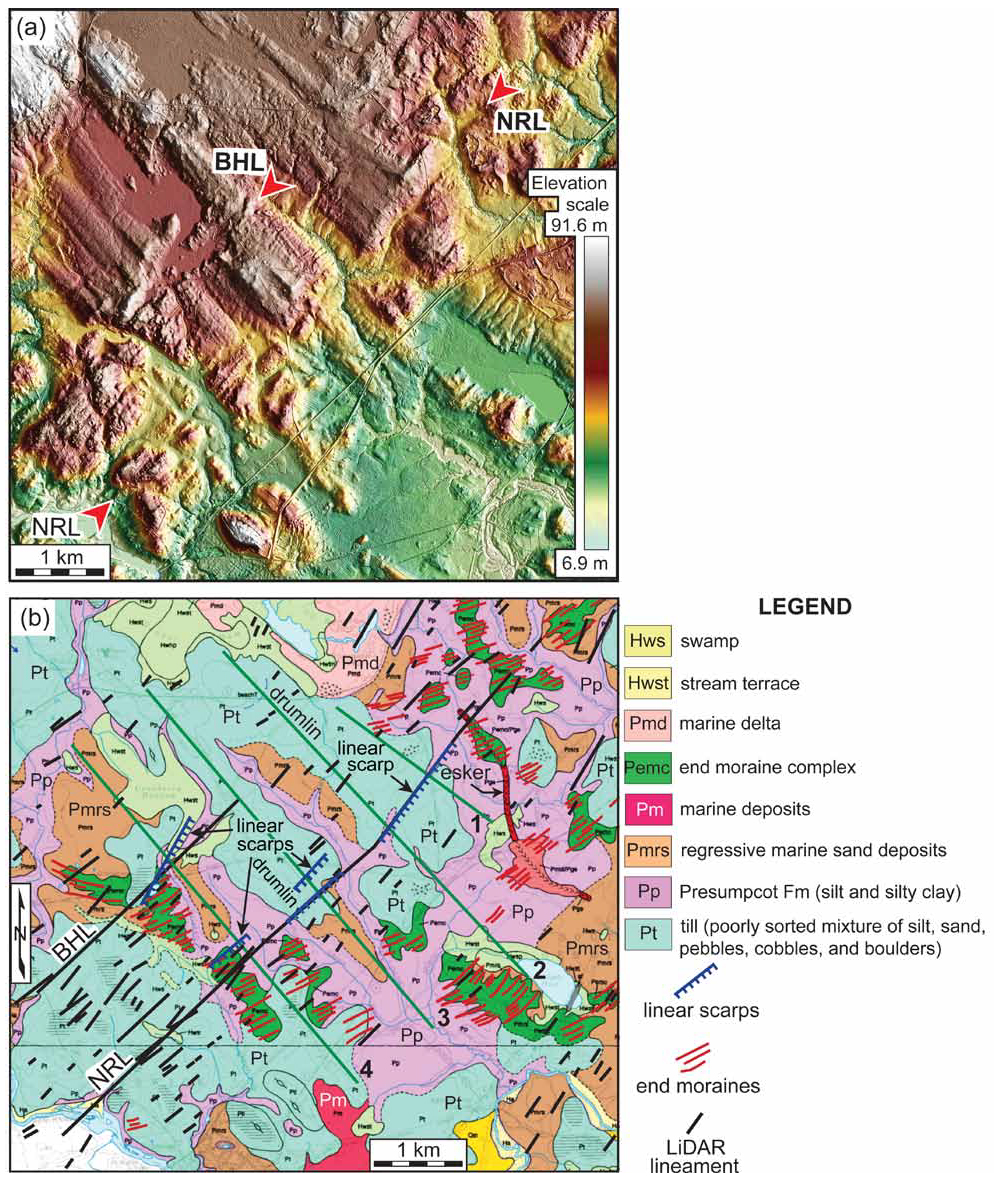
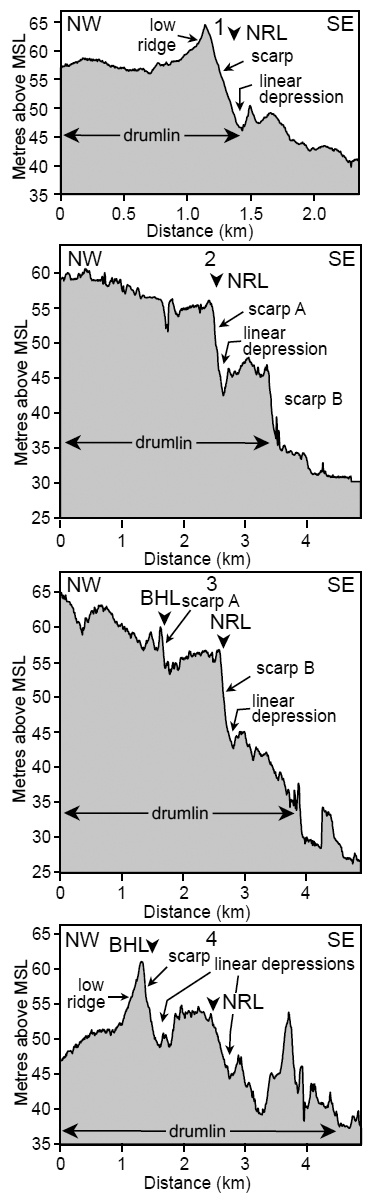
12 Approximately 20 km southwest of Lords Brook scarp and collinear with the NRF is a 3- to 4-km-wide, 40-kmlong zone of NE-SW-trending lineaments (Figs. 7a and 7b). Some of the linear depressions disrupt the otherwise streamlined appearance of the NW-SE-oriented drumlins in the northeastern part of this zone. These linear depressions coincide with the base of gentle SE-facing scarps that have as much as 15 m of relief where they cross drumlins (Figs. 8–10). The crests of some of these scarps coincide with linear ridges that are up to 10 m above the surrounding terrain (e.g., Figs. 9a and 10, profiles 1, 3, and 4). The zone of lineaments southwest of the Salmon Falls River coincides with a 1- to 3-km-wide, 10- to 25-m-deep depression, east of which is a SE-facing, ~40-m-high scarp (Fig. 8, profiles 1 and 2). The southwestern end of this zone coincides with the Calef/Nonesuch River fault of Hussey et al. (2016) (Fig. 7b).
 Display large image of Figure 7
 Display large image of Figure 8
 Display large image of Figure 9
 Display large image of Figure 10
Lineaments along the southwest projection of the MWF
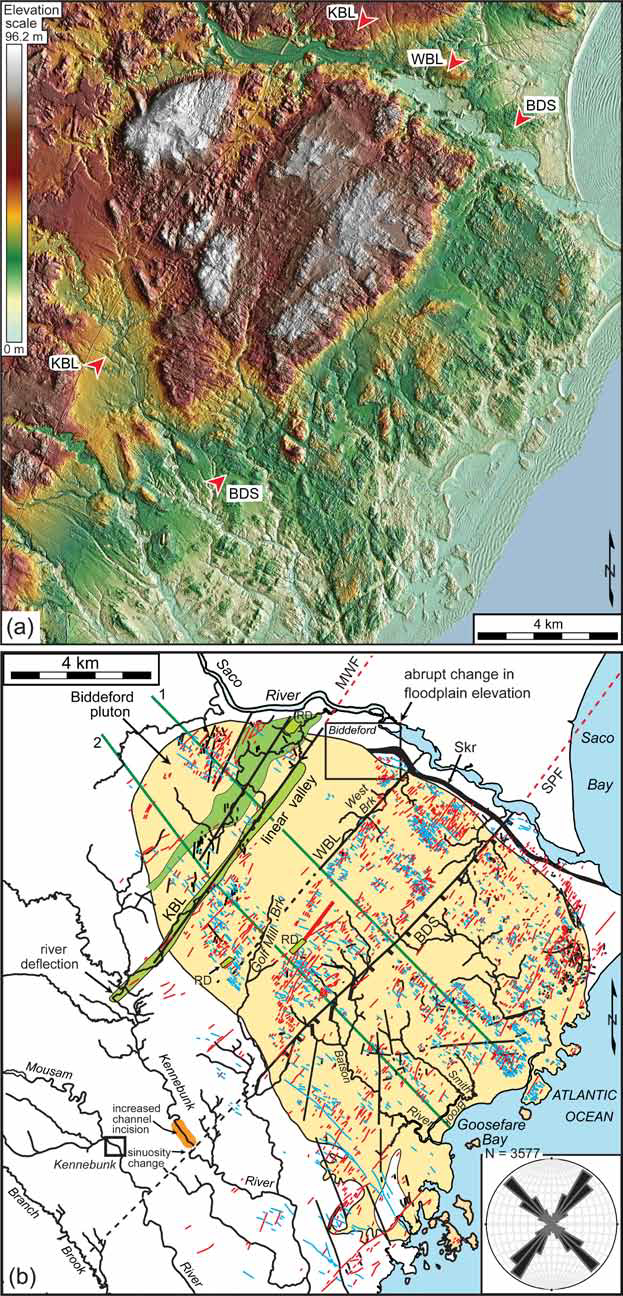
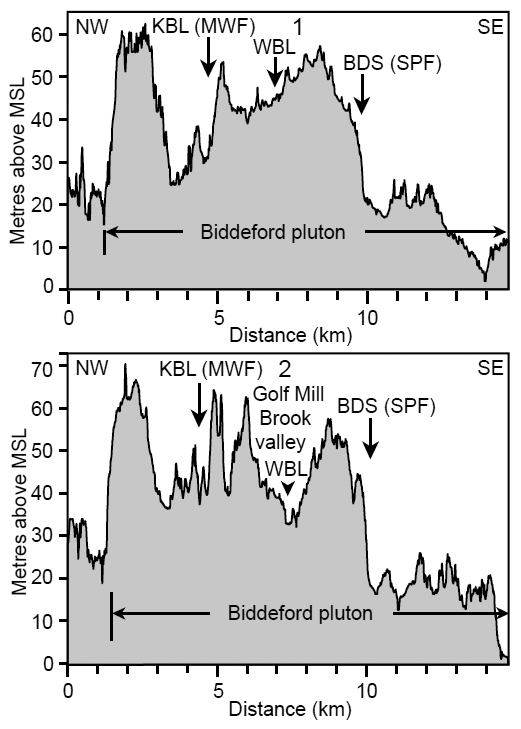
13 Along the southwest projection of the MWF (Fig. 3) is a conspicuous, ~400-m-wide, ~10-m-deep linear depression that defines the Kennebunk lineament where it crosses the Biddeford pluton and adjacent Kittery Formation (Figs. 11a and 12). The southwestern end of the Kennebunk lineament coincides with a 500-m-wide right-lateral deflection in the Kennebunk River where it crosses the Kittery Formation (Fig. 11b). The NE-SW lineament trend in the rose diagram of the Biddeford pluton parallels the trend of the Kennebunk lineament and other NE-SW-trending lineaments crossing the pluton (Fig. 11b).
 Display large image of Figure 11
 Display large image of Figure 12
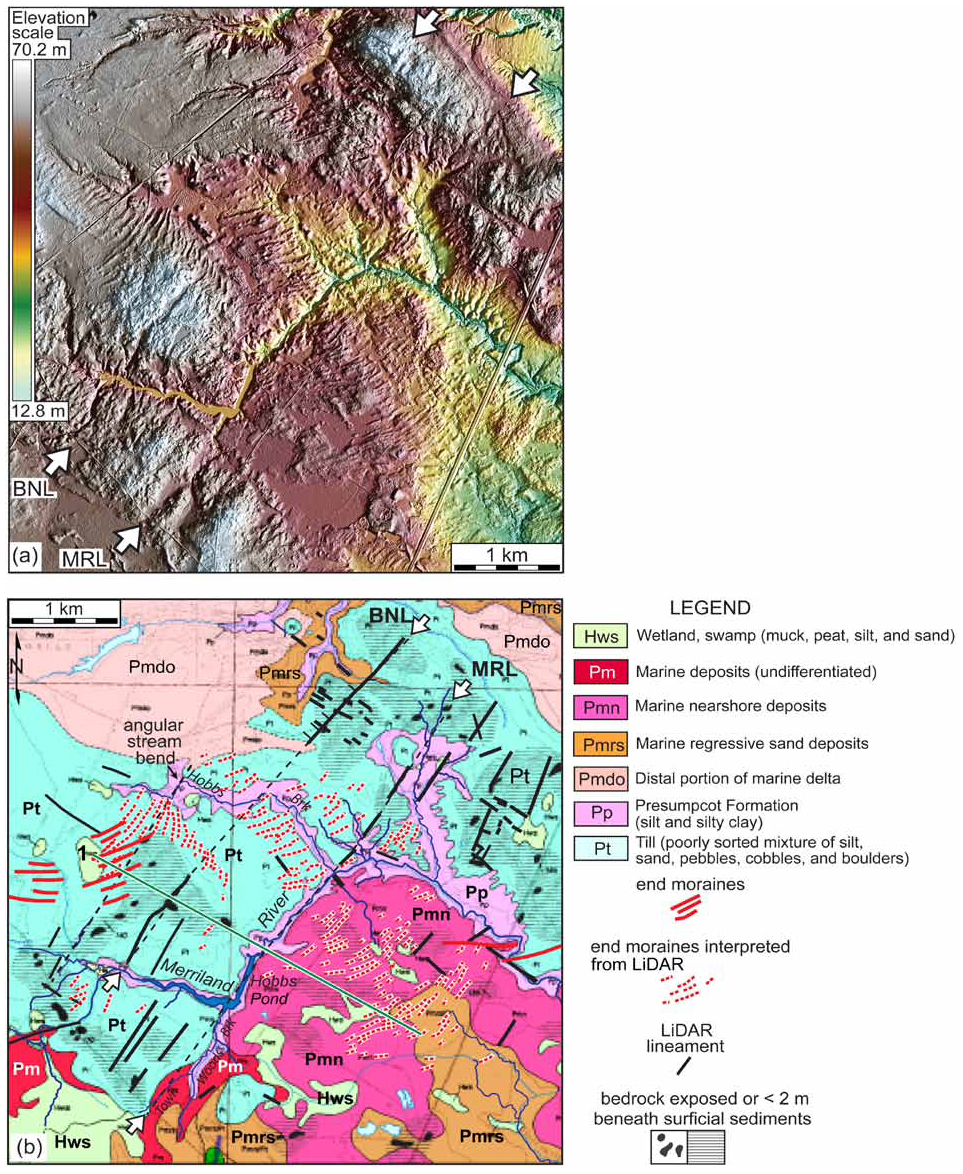
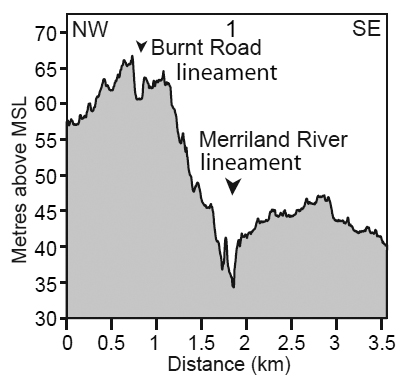
14 Approximately 10 km southwest of the Biddeford pluton are two parallel lineaments that are collinear with the Kennebunk lineament where they cross the Webhannet pluton (Fig. 2). The 5-km-long Merriland River lineament is defined by the alignment of the 90° bend in the Merriland River with the Town Woods Brook (Fig. 13) along the Mackworth fault trend. The area west of the river bend is up to 20 m higher than the area to the east (Fig. 14). This area, like that west of the Lords Brook scarp (Fig. 5b), is capped by till deposits whereas the topographically lower area to the east is covered by glaciomarine deposits (Fig. 13b). A second, less conspicuous lineament to the northwest (Burnt Road lineament) is formed by the alignment of a Merriland River tributary with a NE-SW-trending, 2- to 4-m-deep linear depression to the northeast (Fig. 13). In contrast to the areas underlain by the Biddeford and Webhannet plutons, few lineaments were observed in the topographically lower area underlain by the Merrimack terrane between these two plutons where the glaciomarine sediments are up to 70 feet (21.3 m) thick (Smith 1998).
 Display large image of Figure 13
 Display large image of Figure 14
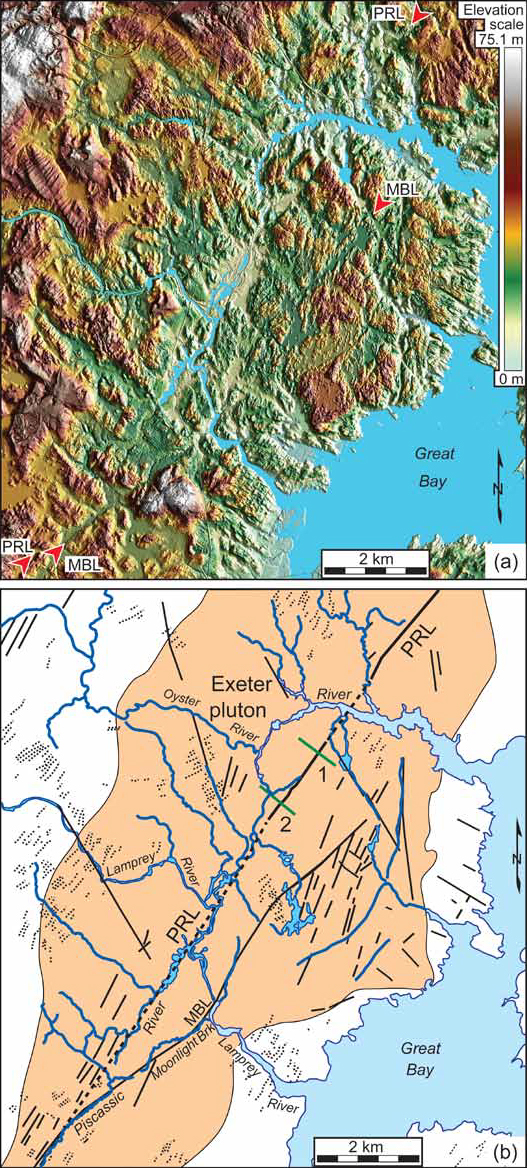
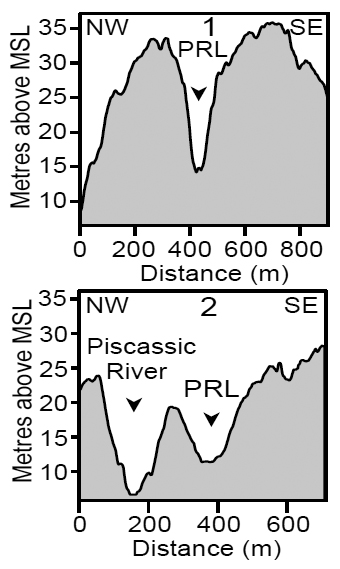
15 The 15-km-long, NE-SW-oriented Piscassic River lineament is approximately 30 km to the southwest along a similar trend (Fig. 15). It crosses the Exeter pluton northwest of Great Bay and is defined by a linear, 18-m-deep valley to the northeast and a linear river drainage pattern to the southwest (Figs. 15 and 16).
 Display large image of Figure 15
 Display large image of Figure 16
Lineaments along the southwest projection of the SPF
16 The most prominent lineament along the southwest projection of the SPF is the 30-m-high, ~10-km-long, southeast-facing Biddeford scarp where it crosses the Biddeford pluton (Figs. 11 and 12). Along the base of the scarp is a subtle 0.5- to 1-km-wide, 5- to 8-m deep depression (Fig. 12). The lineament continues another 4 km to the southwest across glaciomarine sediments underlain by the Kittery Formation where there is an abrupt increase in the sinuosity of the Kennebunk River downstream from this trend (Fig. 11b). Upstream from this trend, the channel is entrenched 3–4 m more than that downstream.
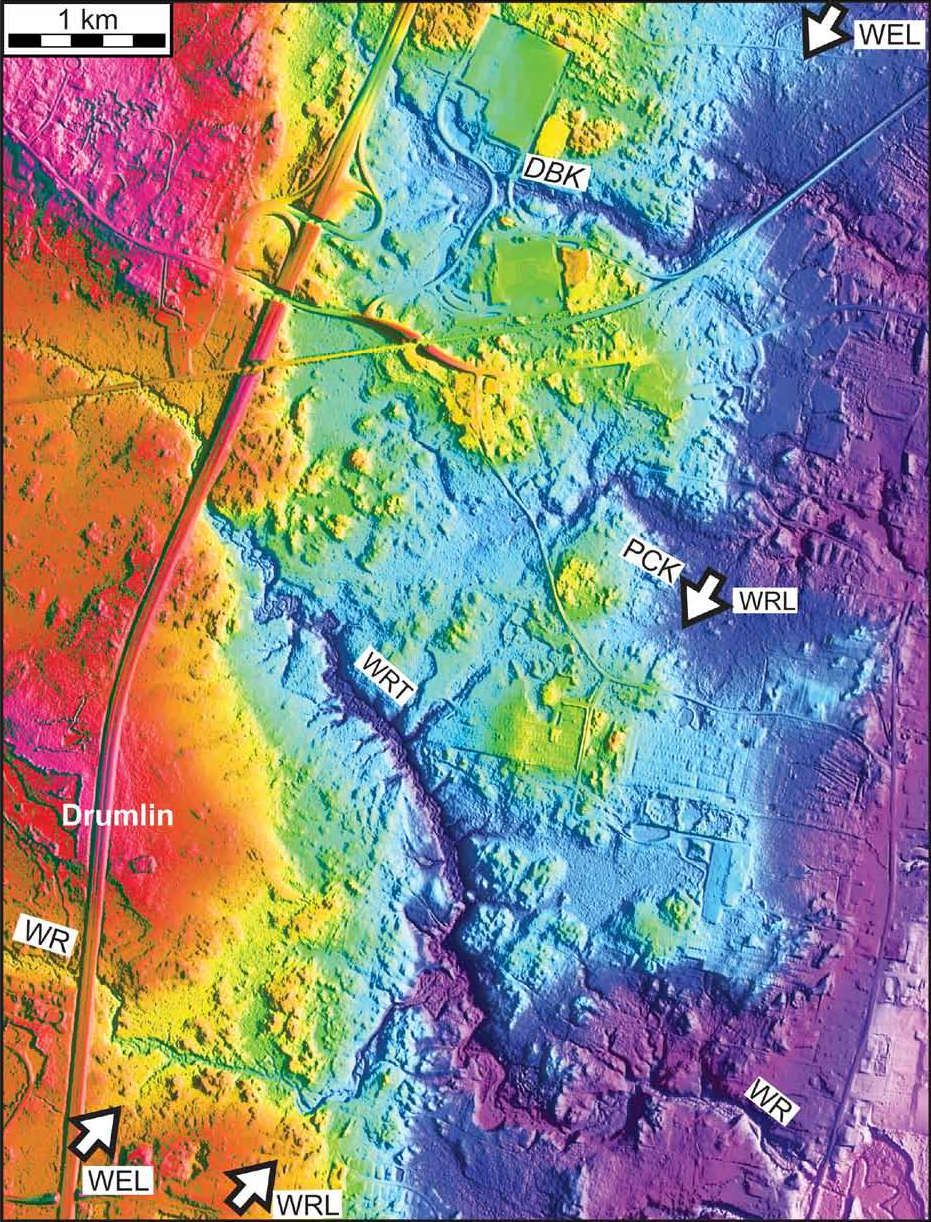
17 Approximately 10 km to the southwest and collinear with the Biddeford scarp is the Wells lineament, which is defined by the abrupt termination of a drumlin, linear depressions up to 8 m deep, and 90° bends in Green Brook, Depot Brook, and Pope Creek (Figs. 17b, 18, profile 4, and 19). The lineament is better defined across the Webhannet pluton than across the Kittery Formation to the northeast where the sediments are thicker (Fig. 17b). Approximately 600 m southeast of and parallel to the Wells lineament is the ~2-km-long Webhannet River lineament, southwest of which is a rectilinear drainage pattern formed by several NE-SW-trending stream segments of the Webhannet River (Fig. 19). Approximately 400 to 600 m southeast of the Wells lineament and nearly coincident with the Webhannet River lineament is the ~11 km long, NE-SW-trending Wells magnetic lineament interpreted from Daniels and Snyder (2004) (Fig. 17b).
 Display large image of Figure 17a
 Display large image of Figure 17b
 Display large image of Figure 18
 Display large image of Figure 19
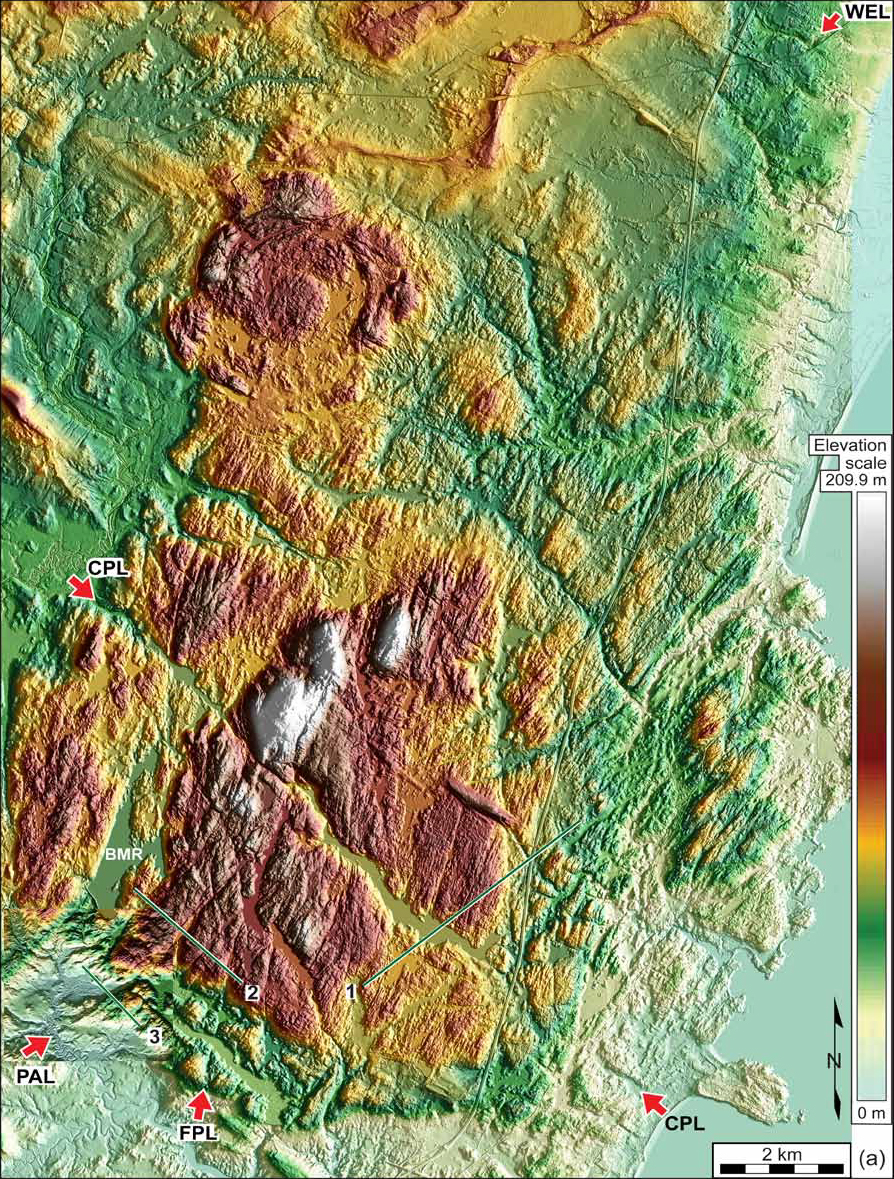
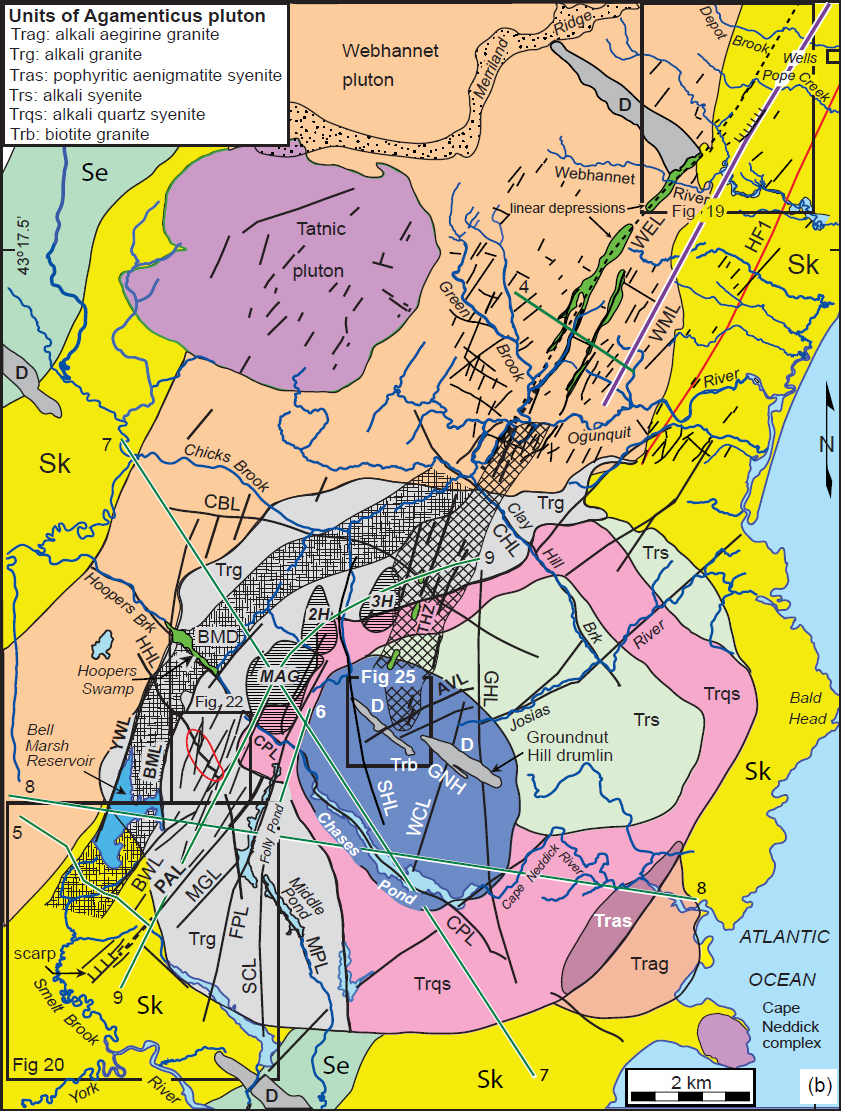
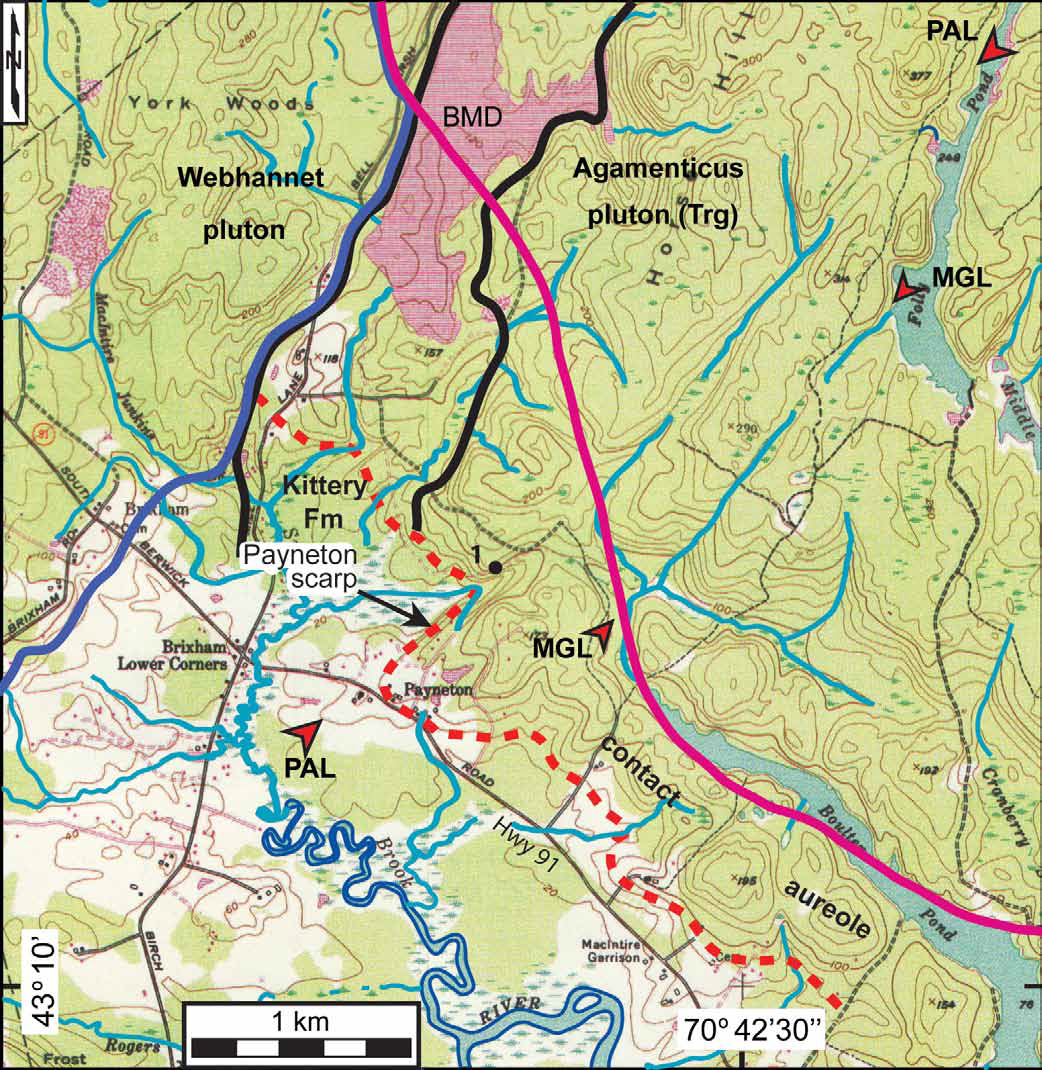
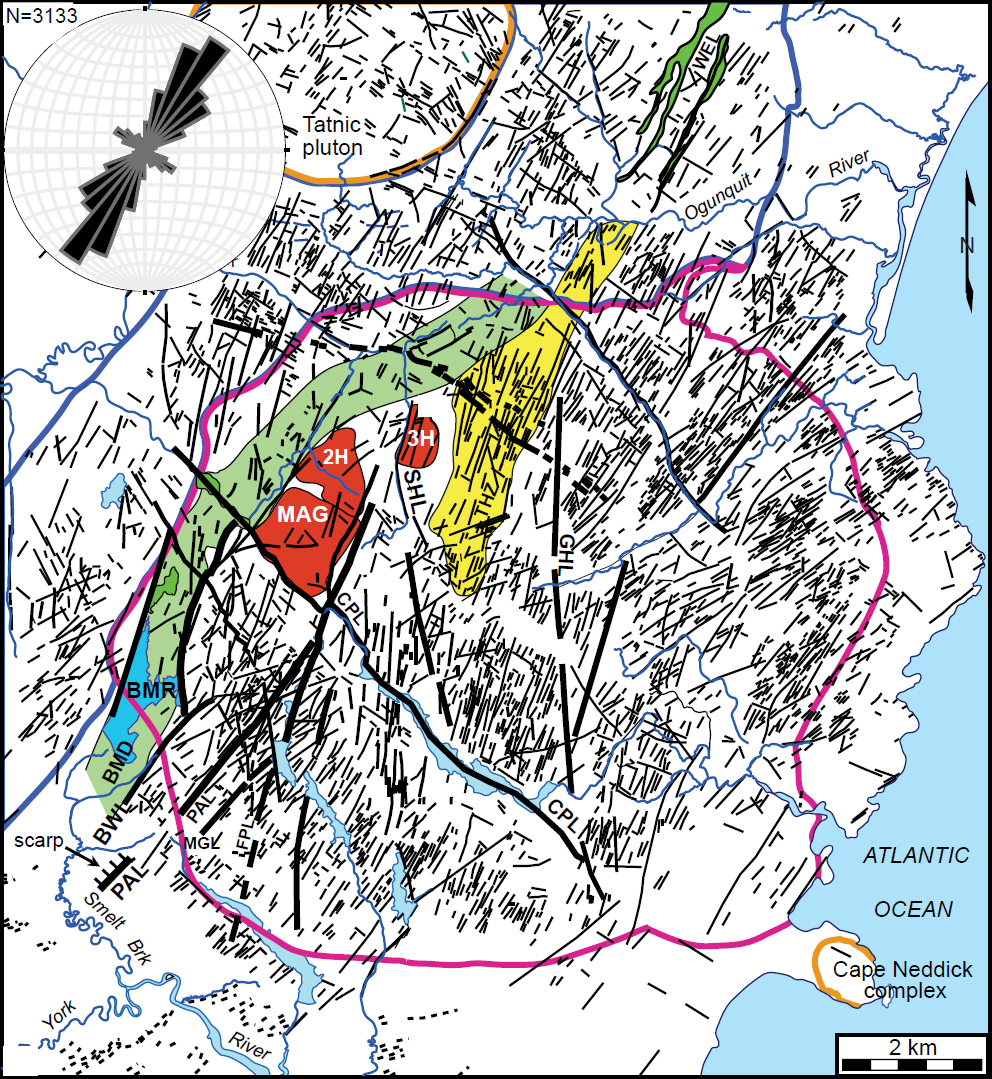
18 Continuing southwest across the Agamenticus pluton, the Wells lineament is collinear with both a curved, NNESSW-trending valley, here named the Bell Marsh depression (BMD), and a 1- to 1.5-km-wide zone of NNE-SSW-trending linear depressions to the east, here named the Third Hill zone of linear depressions (THZ) (Fig. 17b). The BMD is a 1.5- to 2-km-wide, 20- to 60-m-deep curved valley, part of which is dammed to form the Bell Marsh Reservoir (Figs. 17a and 18, profiles 5, 7, and 8). The BMD crosses alkali granite (unit Trg) along the west side of the pluton and the Kittery Formation to the south (Figs. 17b and 20). Along the east side of the BMD are three, 80- to 120-m-high areas known as Mount Agamenticus, Second Hill, and Third Hill that are also mostly underlain by unit Trg (Figs. 17b and 18, profiles 7 and 9). The southwestern end of the BMD is bounded by three distinct lineaments: the ~3-km-long York Woods lineament that coincides with a 30-m-high, east-facing scarp that crosses the Webhannet pluton, the curved Bell Marsh lineament that coincides with a 50-m-high, west-facing scarp that crosses the Agamenticus pluton, and the Berwick lineament at the southernmost end of the BMD that coincides with a steep 40-m-high, west-facing scarp that crosses the Agamenticus pluton and Kittery Formation (Figs. 17b, 18, profiles 5 and 8, and 21).
 Display large image of Figure 20
 Display large image of Figure 21
19 The THZ consists of numerous linear depressions, some of which are as deep as 14 m. Approximately 1 km west of and parallel to the THZ, the 9-km-long Folly Pond lineament is associated with a linear depression up to 25 m deep (Figs. 17 and 18, profiles 2 and 8). The THZ and Folly Pond lineament trend 21° more northerly than the NE-SW-trending linear depressions southwest of the NW-SE-trending Chases Pond lineament, the most prominent of which is the Payneton lineament (Fig. 17). The Payneton lineament, which crosses both the Kittery Formation and the Agamenticus pluton, coincides with a linear valley that is up to 25 m deep (Fig. 18, profile 2). The southwestern end of the Payneton lineament coincides with a steep (northeastern end) to gently sloping (southwestern end), ~700-m-long, northwest-facing scarp that is up to 27 m high to the northeast where it crosses the Kittery Formation (Figs. 18, profile 3, and 20). There are several near-vertical, 5- to 10-ft-high (~2–3 m) rock faces along the northeastern end of the scarp. The interpreted southern edge of the contact metamorphic aureole in the Kittery Formation is dextrally offset 300–500 m along this scarp (Fig. 20). The Payneton lineament abruptly terminates to the northeast along the Folly Pond lineament (Fig. 17). Near the southwestern end of the Payneton lineament are several near-vertical, 3- to 4-m-high rock faces in the Kittery Formation on both sides of the valley along the lineament. Other less prominent linear depressions, such as the Berwick and MacIntire Garrison lineaments, parallel the Payneton lineament (Fig. 17b). The southwestern end of the Berwick lineament forms a ~35-m-high, west-facing scarp in the Kittery Formation where it forms the southeastern wall of the southernmost BMD (Figs. 17 and 18, profile 5). Between the BMD and Payneton lineament are several NESW-trending lineaments along which segments of the NWSE-trending Horse Hills lineament are dextrally offset 30 to 80 m where it crosses the Agamenticus pluton (Fig. 22).
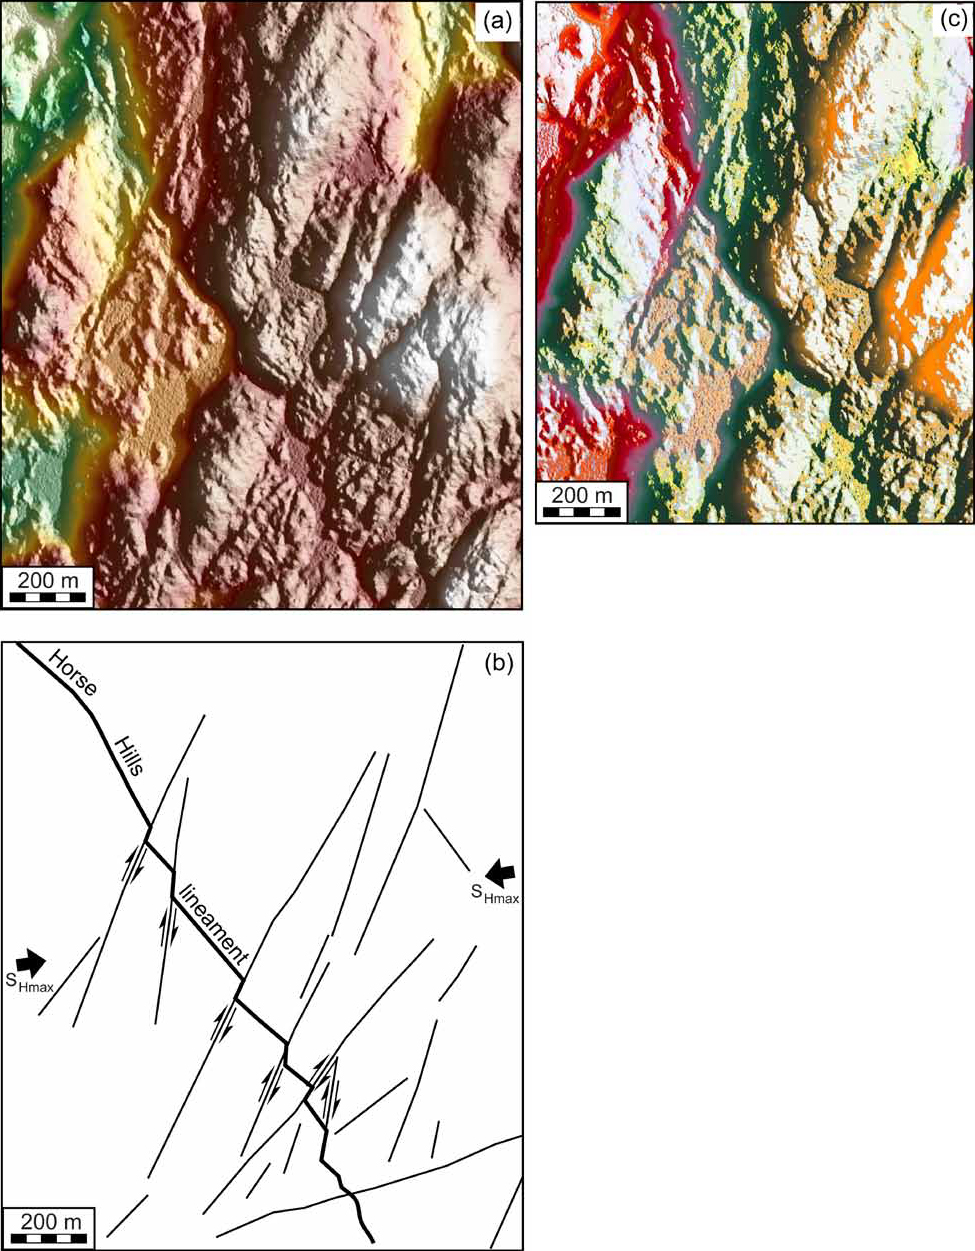 Display large image of Figure 22
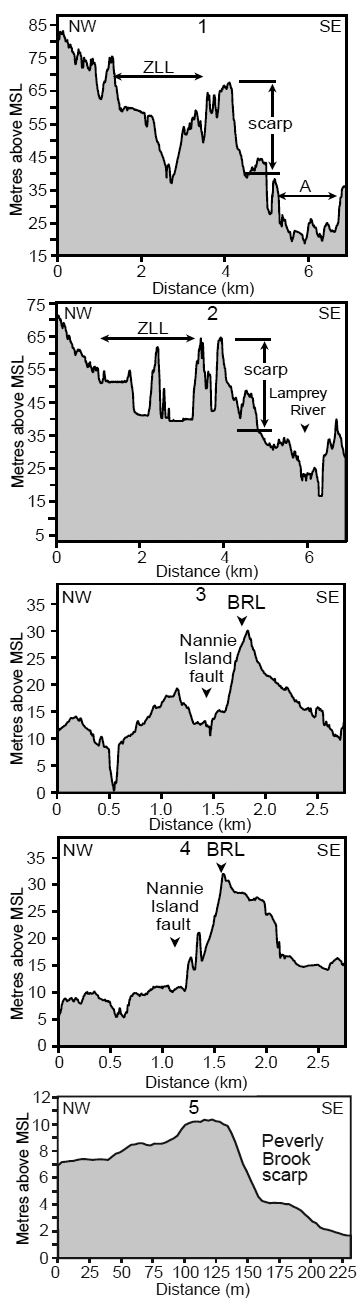
20 In contrast to the Agamenticus pluton, few lineaments were identified immediately to the southwest where several large drumlins and thick glaciomarine sediments obscure most of the underlying Merrimack terrane (Thompson and Borns 1985) (Fig. 2). However, along the southwest projection of the Payneton lineament and crossing the Piscataqua River is a NE-SW-trending, 500-m-wide, 15- to 30-m-deep depression and a gentle NW-facing, 15-m-high gentle scarp that form the Beech Road lineament (Figs. 7b and 8, profiles 3 and 4). The depression coincides with the northeastern end of the Nannie Island fault (Figs. 7b and 8). To the southwest and along the northern edge of Great Bay are several NE-SW-trending linear ridges and depressions and a rectilinear type drainage pattern (Fig. 7b) that are collinear with the Beech Road lineament.
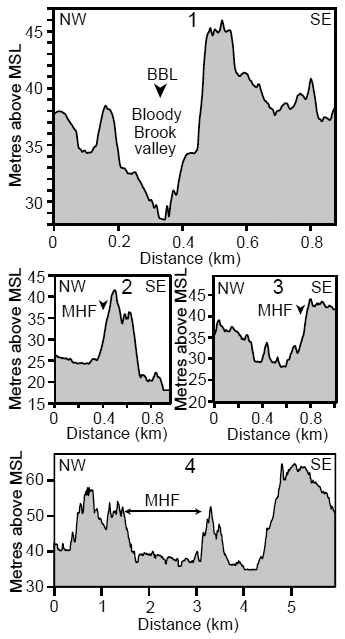
21 Southwest of the Great Bay estuary, the ~23-km-long, NE-SW-trending Bloody Brook lineament coincides with part of the Bloody Brook valley (Figs. 23 and 24, profile 1) and the abrupt termination of a drumlin to the southwest where it crosses the Exeter pluton and Eliot Formation (Fig. 23). The Bloody Brook lineament is offset ~1.5 km across the Great Bay estuary in a right-step direction from the trend of the Beech Road lineament to the northeast (Fig. 2). It continues northeast of Bloody Brook along the NESW-trending segment of the Squamscott River, but with a ~400-m-wide, right-step offset along the NW-SE-trending Stratham lineament near an abrupt southward bend in the Squamscott River (Fig. 23b).
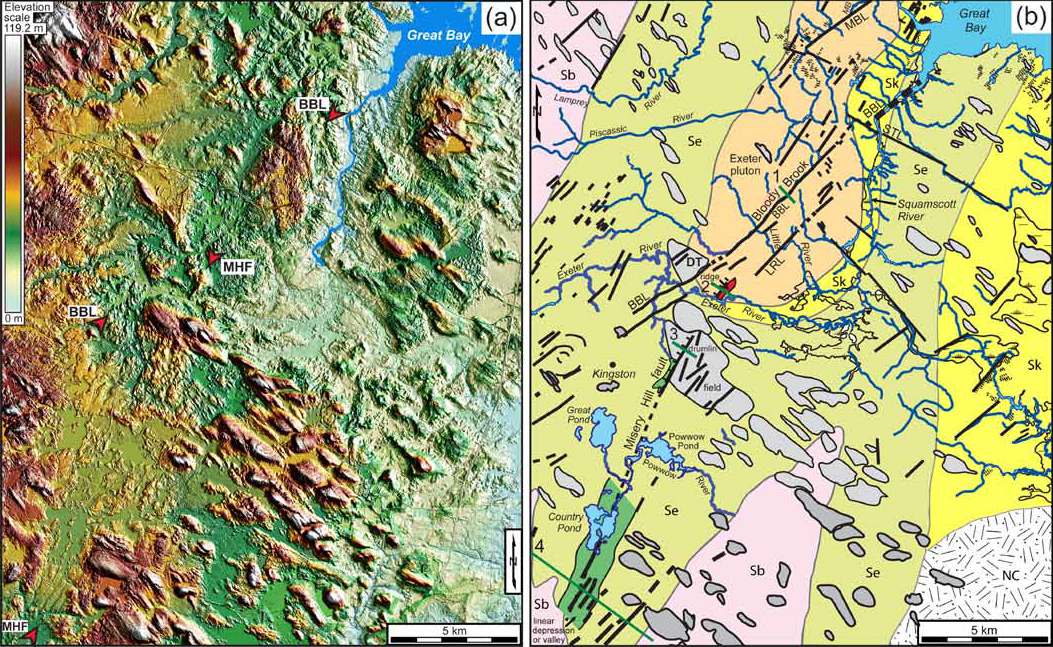 Display large image of Figure 23
 Display large image of Figure 24
22 The southern end of the Bloody Brook lineament intersects a NNE-SSW-oriented lineament associated with the Misery Hill fault at an angle of ~15° (Fig. 23). The northeast end of this lineament is defined by a 2.5-km-long, 10- to 15-m-high, NW-facing scarp and a 1.2-km-long, 15-to 20-m-high, NE-SW-trending ridge where it crosses the Exeter pluton and Eliot Formation (Fig. 24, profiles 2–3). To the southwest it coincides with a 1.5- to 2-km-wide, 15-m-deep linear valley (Fig. 24, profile 4) where it crosses the Eliot Formation (Fig. 23b).
NW-SE- and ENE-WSW-trending lineaments crossing the Agamenticus pluton
23 In contrast to other plutons, several prominent NW-SE-trending linear depressions and valleys, some of which are dammed to form man-made lakes, cross the Agamenticus pluton (Figs. 17b and 21). Some of these linear, canyon-like valleys are up to 50 m deep, such as the Chases Pond lineament (Fig. 18, profile 6), and form anomalous patterns across the Agamenticus pluton, such as the triangular-shaped area between the Groundnut Hill and Chases Pond lineaments that is up to 30 m higher than the surrounding terrain (Figs. 17a and 18, profile 1). Another anomalous observation is the abrupt increase in elevation north of the Chases Pond lineament and west of the Folly Pond lineament and southern end of the THZ without a change in bedrock type (Figs. 17 and 18, profile 9).
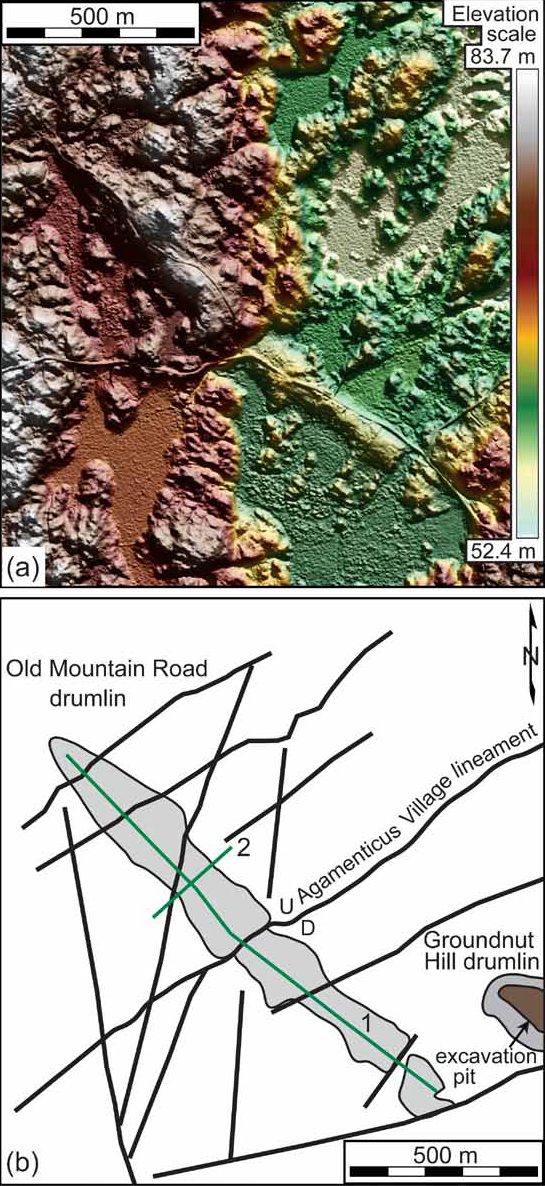
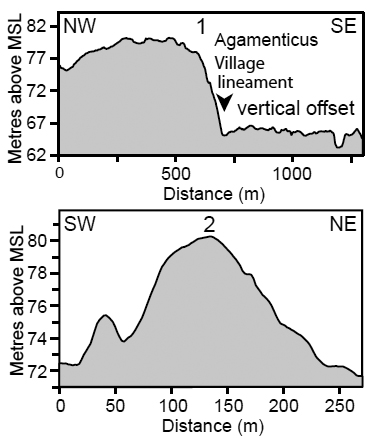
24 Lineaments trending ENE-WSW also occur toward the eastern side of the Agamenticus pluton (Fig. 21). One of these lineaments, the Agamenticus Village lineament, coincides with a 13-m-high, SE-facing scarp across a previously unmapped drumlin, here named the Old Mountain Road drumlin (Figs. 25 and 26).
 Display large image of Figure 25
 Display large image of Figure 26
Peverly Brook and Little Bay lineaments
25 The 30-km-long, NNE-SSW-oriented Peverly Brook lineament (Marple et al. 2015) crosses the general NESW trend of lineaments and faults in southeastern New Hampshire (Fig. 2). It is defined by the alignment of the Winnicut River valley south of Great Bay, the Peverly Brook drainage north of Great Bay, and the NNE-SSW-trending reach of the Piscataqua River north of Little Bay (fig. 7 of Marple and Hurd 2019). The PBL also coincides with part of the Dover Point fault (Fig. 1) along the Piscataqua River north of Little Bay. Near Newington, New Hampshire, the Peverly Brook lineament coincides with a few 3- to 4-m-high, east-facing en échelon scarps (Figs. 7c, 7d, and 8, profile 5) that are formed in Pleistocene sediments (Marple et al. 2015).
26 The north-south orientation of Little Bay north of Great Bay is nearly parallel to the Peverly Brook lineament and is here named Little Bay lineament. Like the Peverly Brook lineament, the Little Bay lineament cuts across the dominant NE-SW trend of lineaments in southeastern New Hampshire. Part of the Dover Point fault coincides with the east side of Little Bay (Fig. 1).
EVIDENCE FOR A NW-SE-TRENDING STRUCTURE NEAR BIDDEFORD, MAINE
Aeromagnetic lineaments near Biddeford, Maine
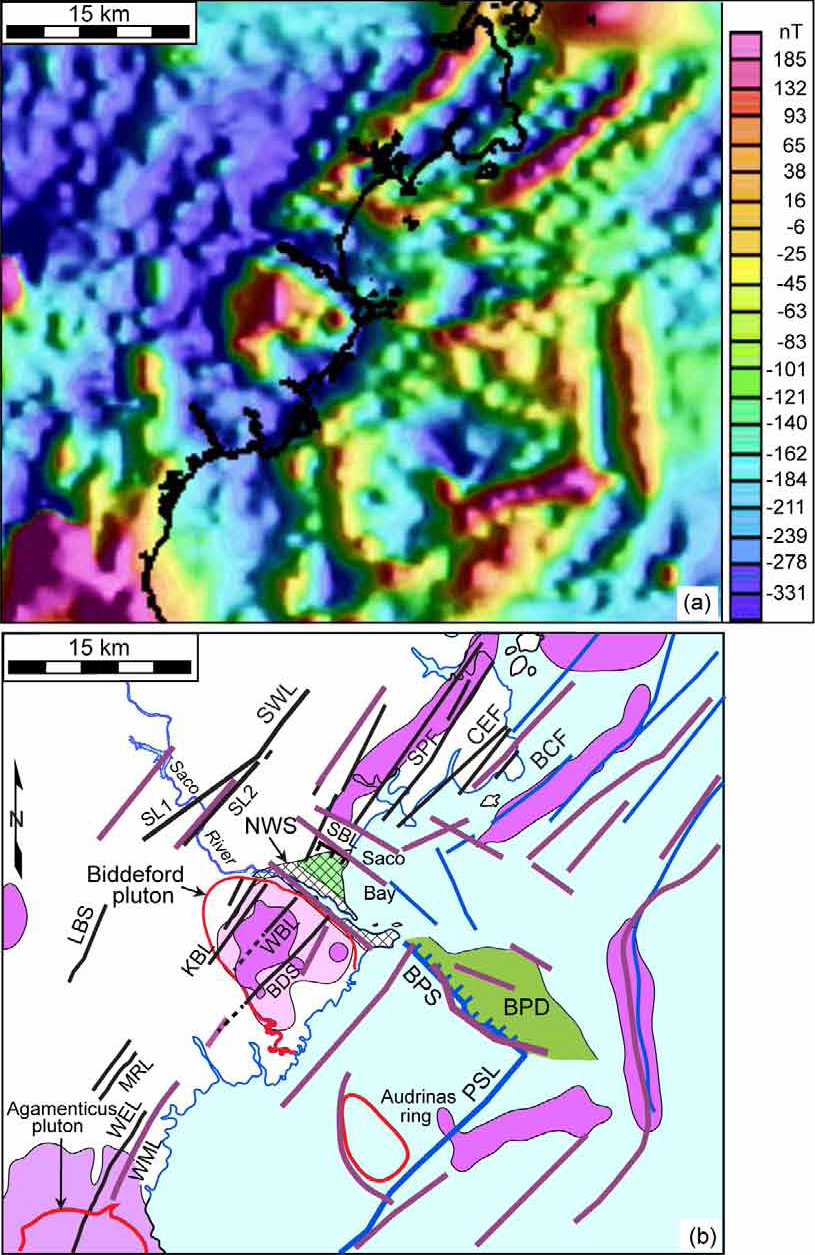
27 The aeromagnetic anomaly map of the Biddeford, Maine, area from Daniels and Snyder (2004) reveals several NESW-trending linear positive magnetic anomalies northeast of the Saco River that parallel or coincide with LiDAR lineaments and faults of the NFS (Fig. 27). Near Saco Bay, the NE-SW-trending magnetic lineaments terminate abruptly along NW-SE-trending magnetic lineaments, including the Saco Bay magnetic lineament, that coincide with the area of anomalous NW-SE-trending strikes of bedding and foliation of the Kittery Formation and other NW-SE-trending features near Biddeford Pool (Figs. 1 and 27b). The NW-SE-trending magnetic lineaments also parallel the Biddeford Pool scarp and depression offshore (Fig. 27b). The Biddeford Pool depression is collinear with a 6-km-long, 2.5-km-wide, 25-m-deep depression onshore northeast of the Saco River (Figs. 3b and 4, profile 3).
 Display large image of Figure 27
NW-SE-trending dextral-oblique brittle reverse fault at Biddeford Pool
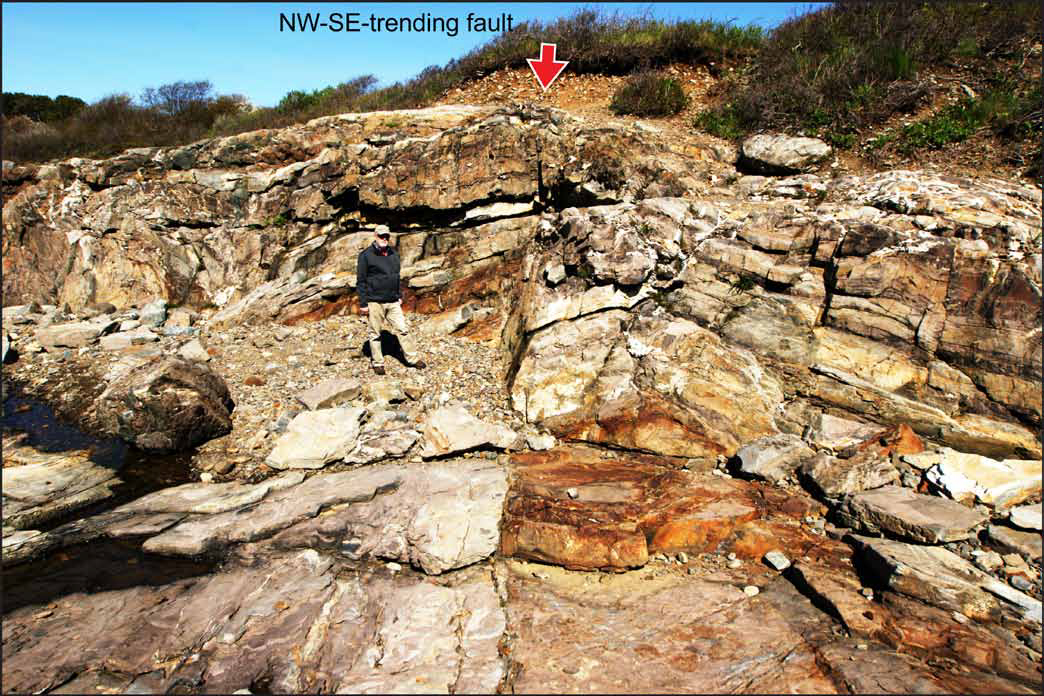
28 Near the trend of the Biddeford Pool scarp at Biddeford Pool, Maine, is a NW-SE-oriented (~N63°W) dextraloblique reverse brittle fault dipping ~73°SW in the Kittery Formation (Figs. 3b and 28). A slickenside on the footwall has a rake of 68°SE, indicating a small component of dextral motion, which is opposite the sinistral motion expected based on the current stress field orientation (Fig. 29). The dextral motion is confirmed by a 3- to 4-m-size dextral displacement of a subunit within the Kittery Formation along this fault (Fig. 28). The amount of reverse displacement is not known. A 0.5- to 1-m-thick Triassic dike cuts across the fault, indicating that it is pre-Triassic. A second, steeply dipping NW-SE-trending brittle fault occurs nearby, although the amount and style of displacement could not be determined.
 Display large image of Figure 28
 Display large image of Figure 29
DISCUSSION
Origin of the LiDAR lineaments
29 Although glacial features are common throughout the study area, they do not appear to be related to the LiDAR lineaments. The end moraines, for example, are relatively short, low-lying (<5 m high) ridges that are generally oblique to the much longer LiDAR lineaments (e.g., Figs. 13 and 15). The lineaments, in contrast, are associated with linear depressions and scarps. Nor are the scarps along the lineaments landslide-related because the head scarps of landslides are typically curved and formed mostly in the fine-grained sediments of the Presumpscot Formation along river valleys and the coast (Dickson and Johnston 2015) whereas the scarps along the lineaments are linear and formed in drumlin deposits (e.g., Fig. 9), which are less susceptible to slope failure. Furthermore, some scarps are formed in bedrock, such as the Biddeford and Lords Brook scarps (Figs. 5 and 11). The lineaments are also not related to lithologic boundaries or foliation because most of them cross plutons (Figs. 11 and 17), which lack foliation. Moreover, although the lineaments in some areas may parallel foliation in the Merrimack and Central Maine terranes, many of the longer lineaments, such as the BMD, lineaments SL1 and SL2, and the Kennebunk, Wells, Payneton, and Bloody Brook lineaments, cross both terranes and the adjacent plutons (Figs. 3b, 17b, and 23). We also considered the possibility that the curved BMD could be associated with a partial ring fracture that formed during emplacement of the Agamenticus pluton. However, the BMD continues southward across the Kittery Formation (Figs. 17b and 20). Lastly, a few of the lineaments coincide with mapped faults, such as the Beech Road lineament along part of the Nannie Island fault, the zone of LiDAR lineaments southwest of the Lyman pluton that coincides with the Calef fault, and the Peverly Brook lineament that coincides with part of the Dover Point fault (Fig. 7b). Another observation that supports a fault origin is the near coincidence of the Wells lineament with the Wells magnetic lineament (Fig. 17b). It is likely, therefore, that the linear depressions formed by erosion along brittle faults and that the linear scarps formed by vertical fault displacements.
Southwest continuation of the NFS
30 The continuity of the NRF, MRF, and SPF southwest of the Saco River strongly suggests that the NE-SW-trending lineaments in the study area are associated with the southwest continuation of the NFS along a broad 30- to 50-km-wide zone. For example, the conspicuous alignment of the NRF west of Casco Bay with SL1, Lords Brook scarp, and the zone of lineaments southwest of the Lyman pluton (Figs. 2 and 7a) suggests that it continues to the southwest as a zone of discontinuous, low-displacement brittle faults.
31 The alignment of the SPF with the Biddeford scarp, BMD, THZ, the Wells, Folly Pond, Payneton, and Beech Road lineaments, and the northeastern part of the Nannie Island fault (Figs. 2, 3, and 7b) suggests that it too continues 60 km to the southwest to at least the Great Bay estuary. We hypothesize that the SPF continues another 25 km southwest of the Great Bay estuary along the Bloody Brook lineament, but with a 1.5-km-wide, right-step offset at Great Bay (Fig. 29). Because the oblique orientation of the SPF relative to SHmax favors dextral displacements, the ~35-m-deep depression at the Great Bay offset likely represents a gentle pull-apart basin (Fig. 29). Although no large (> 1 km) dextral displacements have been documented along the proposed SPF to the southwest, studies of restraining bends along strike-slip faults (Mitra and Paul 2011) suggest that only a few tens of metres of dextral displacement along the SPF would be needed to produce the depression at Great Bay. Such a small amount of dextral displacement would be difficult to identify in New England because of the thick glacial and glaciomarine sediments.
32 The MWF appears to continue another 30 km to the southwest because of its alignment with the Kennebunk and Merriland River lineaments where they cross the Biddeford and Webhannet plutons (Fig. 2). Offshore, Marple and Hurd (2019) postulated that the 45-km-long Poseidon lineament and scarp (Fig. 2) could also be part of the NFS to the southwest.
33 These longer lineaments and the numerous shorter, NESW-trending lineaments that cross most of the study area (e.g., Fig. 2) are likely surface expressions of post-Triassic, low-displacement faults associated with a major regional NE-SW-oriented zone of strain along the southwest continuation of the NFS (Fig. 29). The weakest aspect of this hypothesis is the lack of continuity of the lineaments between the more erosionally resistant plutons. This lack of continuity can be explained, however, by the presence of thicker glacial and glaciomarine sediments in the topographically lower areas between the plutons (Fig. 2) where faults are likely concealed.
Discontinuous nature of the NRF and the origin of Saco ridge and Lords Brook scarp
34 Unlike previous investigations that show the NRF as a smooth linear fault (e.g., Osberg et al. 1985), the LiDAR images reveal that the NRF is discontinuous with bends and offsets, such as the 2-km-wide right-step offset between the Stroudwater River lineament and the NE-SW-trending segment of the Presumpscot River (Fig. 29). Saco ridge to the southwest likely represents an area of uplift between the two interpreted faults represented by lineaments SL1 and SL2 (Fig. 29), both of which partly coincide with previously mapped faults near both sides of the ridge (Berry and Hussey 1998) (Fig. 3b).
35 The oblique orientation of the Lords Brook scarp relative to the NRF (Fig. 2) suggests that it is likely a fault scarp associated with up-to-the-west, reverse-style displacements (Fig. 29). The interpreted fault scarp is likely Permian or younger since it crosscuts the Permian Lyman pluton whereas Saco ridge is Pennsylvanian or younger in age since it crosscuts the Pennsylvanian Saco pluton (Gaudette et al. 1982). These geomorphic features are, therefore, likely surface expressions of a discontinuous NRF that continues to the southwest along Saco ridge, Lords Brook scarp, and the zone of NE-SW-trending lineaments to the southwest, rather than along the NRF of Hussey et al. (2016) (Fig. 29).
Agamenticus pop-up and other interpreted structures across the Agamenticus pluton
36 The diverse trends of long (>2 km) linear depressions across the Agamenticus pluton (Fig. 17) strongly suggest that this area is structurally complex. The main cause of the structural complexity appears to be from the intersection of the proposed SPF with this circular pluton. For example, the interpreted SPF appears to have crossed the pluton along the curved BMD (Fig. 17). This hypothesis is supported by the proximity of the BMD to Mount Agamenticus, Second Hill, and Third Hill, which is anomalous because they are all underlain mostly by alkali granite (unit Trg, Fig. 17b), indicating that these terrain features did not form simply by differential erosion caused by changes in bedrock composition. Nor is the BMD associated with an igneous ring fracture since it continues southward across the Kittery Formation (Figs. 17 and 18, profiles 5, 7, and 8). We therefore postulate that the post-Triassic reactivation of the SPF’s ductile roots at depth fractured around the central core of the pluton along the BMD. This hypothesis is supported by previous studies of seismicity near plutons (e.g., Stevenson et al. 2006), which suggest that the edges of plutons are areas of weakness. More recently, the SPF appears to have fractured along a more direct, but segmented path across the pluton along the THZ and the Folly Pond and Payneton lineaments (Fig. 29). The parallelism of the THZ with the Folly Pond lineament (Fig. 17b) suggests that the SPF is a segmented, en échelon fault zone across the Agamenticus pluton (Fig. 29). Stresses associated with dextral displacements along the intersecting Folly Pond and Payneton lineaments have likely produced a cross-fault along the Chases Pond lineament along which up-to-thenortheast reverse or thrust displacements have occurred (Figs. 18, profile 9, and 29). This hypothesis is supported by the dramatic increase in elevation northeast of the Chases Pond lineament (Fig. 18, profile 9), which suggests that the area bounded by the BMD, THZ, and the Chases Pond and Folly Pond lineaments may have been uplifted by upto-the-NE displacements along part of the Chases Pond lineament, thus resulting in Mount Agamenticus, Second Hill, and Third Hill, herein referred to as the Agamenticus pop-up (Fig. 29). The intersection of the Groundnut Hill lineament with the gentle southward bend in the interpreted SPF near the northern edge of the Agamenticus pluton and the higher terrain along the west side of this lineament (Fig. 18, profile 1) suggests that the Groundnut Hill lineament is associated with a west-dipping reverse or thrust fault formed by stresses caused by dextral motion along this bend in the SPF (Fig. 29). The small Cenozoic fault slip rates in the eastern United States (Prowell and Obermeier 1991) and the oblique orientation of SHmax relative to the SPF since Early Cretaceous time (e.g., Faure et al. 1996) suggest that at least some dextral displacement has occurred along the SPF to form these areas of uplift (Fig. 29). Although there is no evidence for large-scale (> 1 km) dextral displacements along the interpreted SPF, experimental studies of restraining bends along strike-slip faults by Mitra and Paul (2011) suggests that the amount of lateral displacement required to produce these areas of uplift would have been no more than 2 to 3 times the amount of vertical deformation that produced these uplifted areas. Thus, only a few hundred metres of dextral displacement on the nearby SPF would have been required to produce the Agamenticus pop-up. The interpreted right-step offset in the southern edge of the contact aureole (Kittery Formation) bounding the pluton along the Payneton scarp to the southwest (Fig. 20) may represent 300–500 m of dextral displacement along the interpreted SPF to the southwest, which would have been sufficient to produce the compressional pop-up.
Possible cause of low-level seismicity along the NFS>
37 The low-level seismicity along the NFS (e.g., Ebel and Spotila 1999) is perplexing since the orientation of the NFS relative to SHmax favors right-lateral displacements. One possible explanation for this observation is that the NFS could be locked between large earthquakes that occur at long recurrence time intervals. Examples of locked, currently aseismic faults that have produced large historical earthquakes include the large segments of the San Andreas fault that ruptured in 1857 and 1906 (Wallace 1990). Similarly, Guccione et al. (2005) hypothesized that the Bootheel fault in the New Madrid region may be locked because of its structurally complex nature. The proposed NFS in southern Maine and southeastern New Hampshire is also characterized by structural complexities in several areas, including the discontinuous nature of the NRF, the segmented nature of the SPF where it crosses the Agamenticus pluton, the interpreted Great Bay pull-apart basin, and the Kingston restraining bend (Fig. 29).
SPF as the principal displacement zone of the NFS southwest of Casco Bay
38 At least three observations suggest that the SPF is the principal displacement zone of the NFS southwest of Casco Bay. First, the interpreted location of the SPF, unlike the NRF, is collinear with the main trend of the NFS to the northeast (Fig. 1). Secondly, it can be traced farther southwest than other lineaments in the central part of the study area (Fig. 2). Third, the density of lineaments is greatest along the trend of the SPF, such as across the Agamenticus and Biddeford plutons (Figs. 11 and 17). Finally, the geomorphic expression of the SPF southwest of the Saco River, including the Biddeford scarp, Payneton and Folly Pond lineaments, THZ, and the Agamenticus pop-up (Figs. 11 and 17), is more conspicuous than along other lineaments in the study area.
Evidence for a major, NW-SE-trending structure near Biddeford, Maine
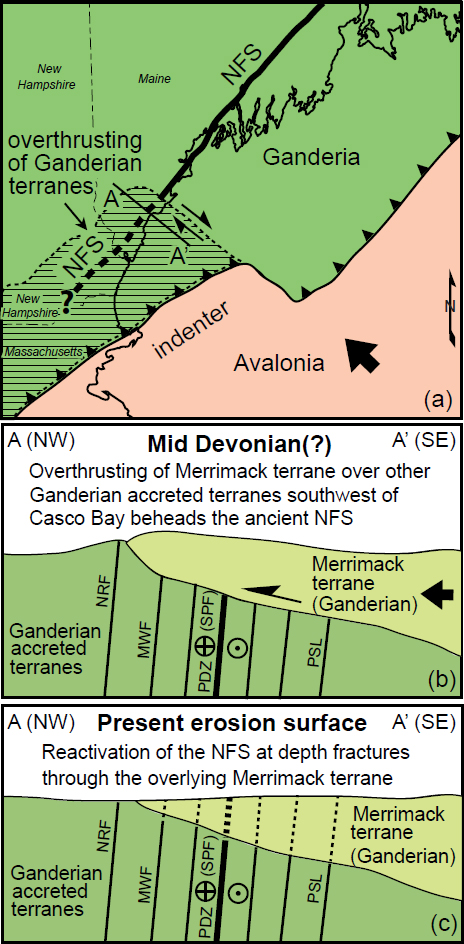
39 Marple and Hurd (2019, figs. 4 and 5) revealed numerous NW-SE-trending features near Biddeford, Maine, that may represent a ~30-km-long, NW-SE-trending structure that crosses the trend of the NFS. These features include the NW-SE-trending strikes of bedding and foliation northeast of the Biddeford pluton, the Biddeford Pool scarp and depression, the Biddeford gravity lineament, and the NWSE-oriented Biddeford pluton and Audrinas ring (Fig. 1). Additional evidence for this cross-structure includes the abrupt termination of the NE-SW-trending magnetic lineaments along NW-SE-trending magnetic lineaments northeast of the Saco River (Fig. 27), the NW-SE-oriented dextral-oblique reverse fault at Biddeford Pool (Fig. 28), and the NW-SE-trending LiDAR lineaments shown by the rose diagram of the Biddeford pluton (Fig. 11b). Marple and Hurd (2019) postulated that this structure formed by dextral deformation along the northeastern edge of a Devonian indenter that they named the Biddeford indenter (Fig. 30). They hypothesized that the indenter thrust the Merrimack terrane southwest of Casco Bay over the ductile roots of the NFS to the southwest during Devonian time. Later reactivation of the NFS at depth fractured through the overlying Merrimack terrane, thus producing the numerous NE-SW-trending LiDAR and sonar lineaments southwest of the Saco River and Biddeford Pool depression (Fig. 2). Such overthrusting of the NFS and later reactivation of its ductile roots could explain the dramatic change from large lateral displacements along the NFS northeast of Casco Bay (e.g., Ludman et al. 1999) to small (<1 km) lateral displacements to the southwest. Because of its NW-SE-orientation, the Biddeford pluton likely intruded upward along one of the NW-SE-trending fractures near the edge of the indenter.
 Display large image of Figure 30
40 Although the location of the northwestern edge of this overthrust block is uncertain, it may lie along the NW-dipping Nonesuch River/Calef fault and the east-westtrending fault of Hussey et al. (2016) between the Biddeford and Saco plutons (labeled HF2 on Fig. 1) since the NW-SE-trending strikes of foliation and bedding of the Merrimack terrane do not continue northwest of the Biddeford pluton (fig. 5c of Marple and Hurd 2019). This location, combined with the greater thicknesses of glaciomarine sediments near the coast, could explain why the LiDAR lineaments along the southwest projection of the NRF are more continuous than those to the east where the overthrusting occurred. Overthrusting of the Norumbega’s ductile roots is analogous to the basement fault associated with the New York-Alabama lineament that was overthrust by the Alleghanian thrust sheet (e.g., Steltenpohl et al. 2010).
41 A potential weakness of this hypothesis is the presence of NW-SE strikes in foliation of the Kittery Formation near the southwestern side of the Biddeford pluton. Swanson (2019) suggested that the NW-SE-trending foliation north and south of the Biddeford pluton is associated with regional Norumbega shearing southwest of Casco Bay. However, his hypothesis is based mainly on the southwest continuation of the NFS along the NRF since there are no other known Paleozoic continuations of the NFS southwest of the Saco River. Moreover, the concentration of NW-SE-trending features near Biddeford Pool (Fig. 1) suggests that there is a major cross-structure in this area.
Peverly Brook and Little Bay lineaments
42 The cross-cutting, NNE-SSW orientation of the Peverly Brook and Little Bay lineaments relative to the NE-SW trend of most lineaments in the study area (Fig. 29) is anomalous. The scarp along the Peverly Brook lineament near Newington, New Hampshire (Fig. 7c), is likely an eroded Pleistocene fault scarp because it crosses the trends of end moraines in the area (Marple et al. 2015). North of Great Bay, these lineaments coincide with parts of the Dover Point fault (Fig. 7b). Because these two lineaments cross the proposed right-step offset along the interpreted SPF at Great Bay, we hypothesize that they could be surface expressions of cross-faults associated with this offset (Fig. 29).
Quaternary tectonism versus glacial unloading in southern Maine and New Hampshire
43 Various observations suggest that some of the proposed faults in the study area have undergone small vertical displacements during Pleistocene and possibly Holocene time. One such observation is the 3- to 5-m-high, east-facing Peverly Brook scarp (Fig. 7c) that is developed in Pleistocene sediments. As stated earlier, its oblique orientation relative to nearby recessional moraines (Marple et al. 2015) suggests that it could be a Pleistocene fault scarp.
44 The linear SE-facing scarps that cross Pleistocene drumlins east of Berwick, Maine (Fig. 9), may also be Pleistocene fault scarps with as much as 15 m of cumulative vertical displacement. These scarps are not landslides because head scarps of landslides are curved. Moreover, these scarps are formed mostly in till deposits that are not as susceptible to landsliding as the finer sediments of the Presumpscot Formation (Dickson and Johnston 2015). Furthermore, the base of these scarps coincide with much longer linear depressions that disrupt the otherwise smoothed linear appearance of the drumlins (Fig. 9). Lastly, the low ridges along the crests of these scarps (Figs. 9a and 10) are best explained by compressional uplift along the interpreted faults responsible for the scarps.
45 The SE-facing scarp along the Old Mountain Road drumlin near the center of the Agamenticus pluton (Figs. 25 and 26) may also be a Pleistocene fault scarp. If true, then the fault along the Agamenticus Village lineament has undergone as much as 13 m of up-to-the-NW displacement during Pleistocene or early Holocene time.
46 Vertical displacements caused by rapid glacial unloading may have produced these scarps. The 150-km-long, 10-m-high Pärve fault scarp in Sweden, for example, is inferred to have ruptured during a single reverse event with a moment magnitude of 8.2 ± 0.2 (Arvidsson 1996) at 9.5 ka (Lagerbäck 1992). Alternatively, these scarps may have formed by multiple Pleistocene displacements.
47 Deformation associated with the changes in sinuosity and increased incision along the Kennebunk River where it crosses the interpreted SPF (Fig. 11b) is consistent with studies of river morphology (e.g., Schumm 1993), which indicate that these types of river anomalies are associated with gentle, late Pleistocene or Holocene uplift along faults. Conversely, these anomalies are not from changes in sediment type nor are they from a change in base level caused by a lowering of sea level because no still stand occurred near this area since the last ice age (Kelley et al. 1996). The rapids along the Saco River and Cascade Brook (Fig. 3b) are also possibly from up-to-the-west- displacements along faults associated with the West Brook and Blue Point lineaments, which are located just downstream from these rapids. The timing of this interpreted uplift is unknown.
CONCLUSIONS
48 In conclusion, we postulate that the numerous NE-SW-trending LiDAR lineaments southwest of the Saco River in southern Maine and southeastern New Hampshire are associated with post-Triassic low-displacement faults along the southwest continuation of the NFS. The small displacements of these faults and the presence of a major NW-SE-trending cross-structure near Biddeford, Maine, suggests that the Merrimack terrane southwest of Casco Bay may have been thrust over the ductile roots of the NFS during Devonian time by the interpreted Biddeford indenter. Reactivation of the Norumbega’s ductile roots since then has fractured through the overlying Merrimack and other accreted terranes and plutons to form low displacement faults associated with the NE-SW-trending LiDAR and sonar lineaments southwest of Casco Bay, both onshore and offshore. Although the style and magnitude of displacements along the NFS southwest of Casco Bay are unknown, small (<1 km) dextral displacements along the NFS to the southwest are favored by its oblique orientation relative to the ENEWSW-oriented SHmax in the northeastern U.S. since at least early Tertiary time (Faure et al. 1996) and the low fault-slip rates in the eastern U.S. since Early Cretaceous time (Prowell and Obermeier 1991). This conclusion is favored by the interpreted right-lateral displacements ranging from 30 to 500 m near the southwestern side of the Agamenticus pluton. We further conclude that the scarps crossing some of the Pleistocene drumlins to the southwest represent upto-the-west displacements along various faults of the NFS, either by rapid glacial unloading or multiple Pleistocene earthquakes. We further conclude that the sinuosity change and entrenchment along the Kennebunk River southwest of the Biddeford pluton is evidence for gentle Holocene deformation along the proposed SPF.
We thank reviewer Randy Cox, who originally reviewed this manuscript for Northeastern Geoscience, and an anonymous reviewer for their many constructive comments. We also thank James Ebert, Ed Stander, and Paul Washington, the editors of Northeastern Geoscience, for permission to publish instead in Atlantic Geology, and Atlantic Geology editors David West and Sandra Barr for their scientific feedback and help in reformatting the manuscript for that journal.
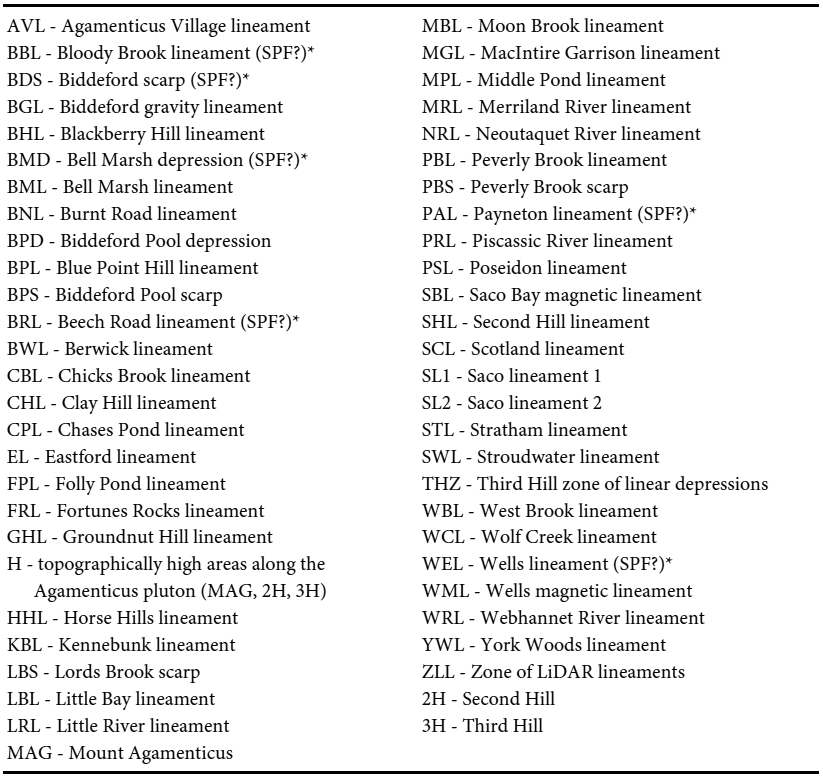 Display large image of Table A2*Lineaments that coincide with the interpreted southwest continuation of the SPF.