Articles
Sonar and LiDAR investigation of lineaments offshore between central New England and the New England seamounts, USA
doi:10.4138/atlgeol.2019.002
ABSTRACT
High-resolution multibeam echosounder (MBES) and light detection and ranging (LiDAR) data, combined with regional gravity and aeromagnetic anomaly maps of the western Gulf of Maine, reveal numerous lineaments between central New England and the New England seamounts. Most of these lineaments crosscut the NE-SW-trending accreted terranes, suggesting that they may be surface expressions of deep basement-rooted faults that have fractured upward through the overlying accreted terranes or may have formed by the upward push of magmas produced by the New England hotspot. The 1755 Cape Ann earthquake may have occurred on a fault associated with one of these lineaments. The MBES data also reveal a NW-SE-oriented scarp just offshore from Biddeford Pool, Maine (Biddeford Pool scarp), a 60-km-long, 20-km-wide Isles of Shoals lineament zone just offshore from southeastern New Hampshire, a 50-km-long zone of mostly low-lying, WNW-ESE-trending, submerged ridge-like features and scarps east of Boston, Massachusetts, and a ~180-km-long, WNW-ESE-trending Olympus lineament zone that traverses the continental margin south of Georges Bank. Three submarine canyons are sinistrally offset ~1–1.2 km along the Thresher canyon lineament of the Olympus lineament zone.
RÉSUMÉ
Les données provenant d’un échosondeur multifaisceaux à haute résolution et des procédés de détection par télémétrie et ondes lumineuses (LIDAR), combinées aux cartes régionales d’anomalies gravimétriques et aéromagnétiques de la partie ouest du golfe du Maine, révèlent la présence de nombreux linéaments entre la partie centrale de la Nouvelle-Angleterre et la chaîne de monts de la Nouvelle-Angleterre. La plupart de ces linéaments traversent les terranes accrétés d’orientation NE-SO, ce qui suggère qu’ils sont des modelés de failles profondes dont la base se trouve au sous-sol et qui se sont fissurées vers le haut, à travers les terranes accrétés qui les surmontent, ou pourraient s’être formés en raison du soulèvement de magmas produits par le point chaud de la Nouvelle-Angleterre. Le séisme de Cape Ann, qui est survenu en 1755, pourrait s’être produit le long d’une faille associée à l’un de ces linéaments. Les données de l’échosondeur multifaisceaux à haute résolution révèlent un escarpement orienté NO-SE, tout juste au large de Biddeford Pool, au Maine (escarpement de Biddeford Pool), une zone de linéaments aux Isles of Shoals, d’une longueur de 60 km et d’une largeur de 20 km — cet escarpement est, à son tour, immédiatement au large de la partie sud-est du New Hampshire; une zone de 50 km de longueur principalement formée d’accidents et escarpements submergés en forme de talus, de faible altitude, à tendance ONO-ESE, à l’est de Boston, au Massachussetts; et la zone de linéaments d’Olympus de 180 km de longueur, à orientation ONO-ESE, qui traverse la marge continentale au sud de Georges Bank. Trois canyons sous-marins se trouvent en rejet horizontal transversal senestre sur une distance d’environ 1 à 1,2 km le long du linéament du canyon de Thresher de la zone de linéaments d’Olympus.
[Traduit par la redaction]
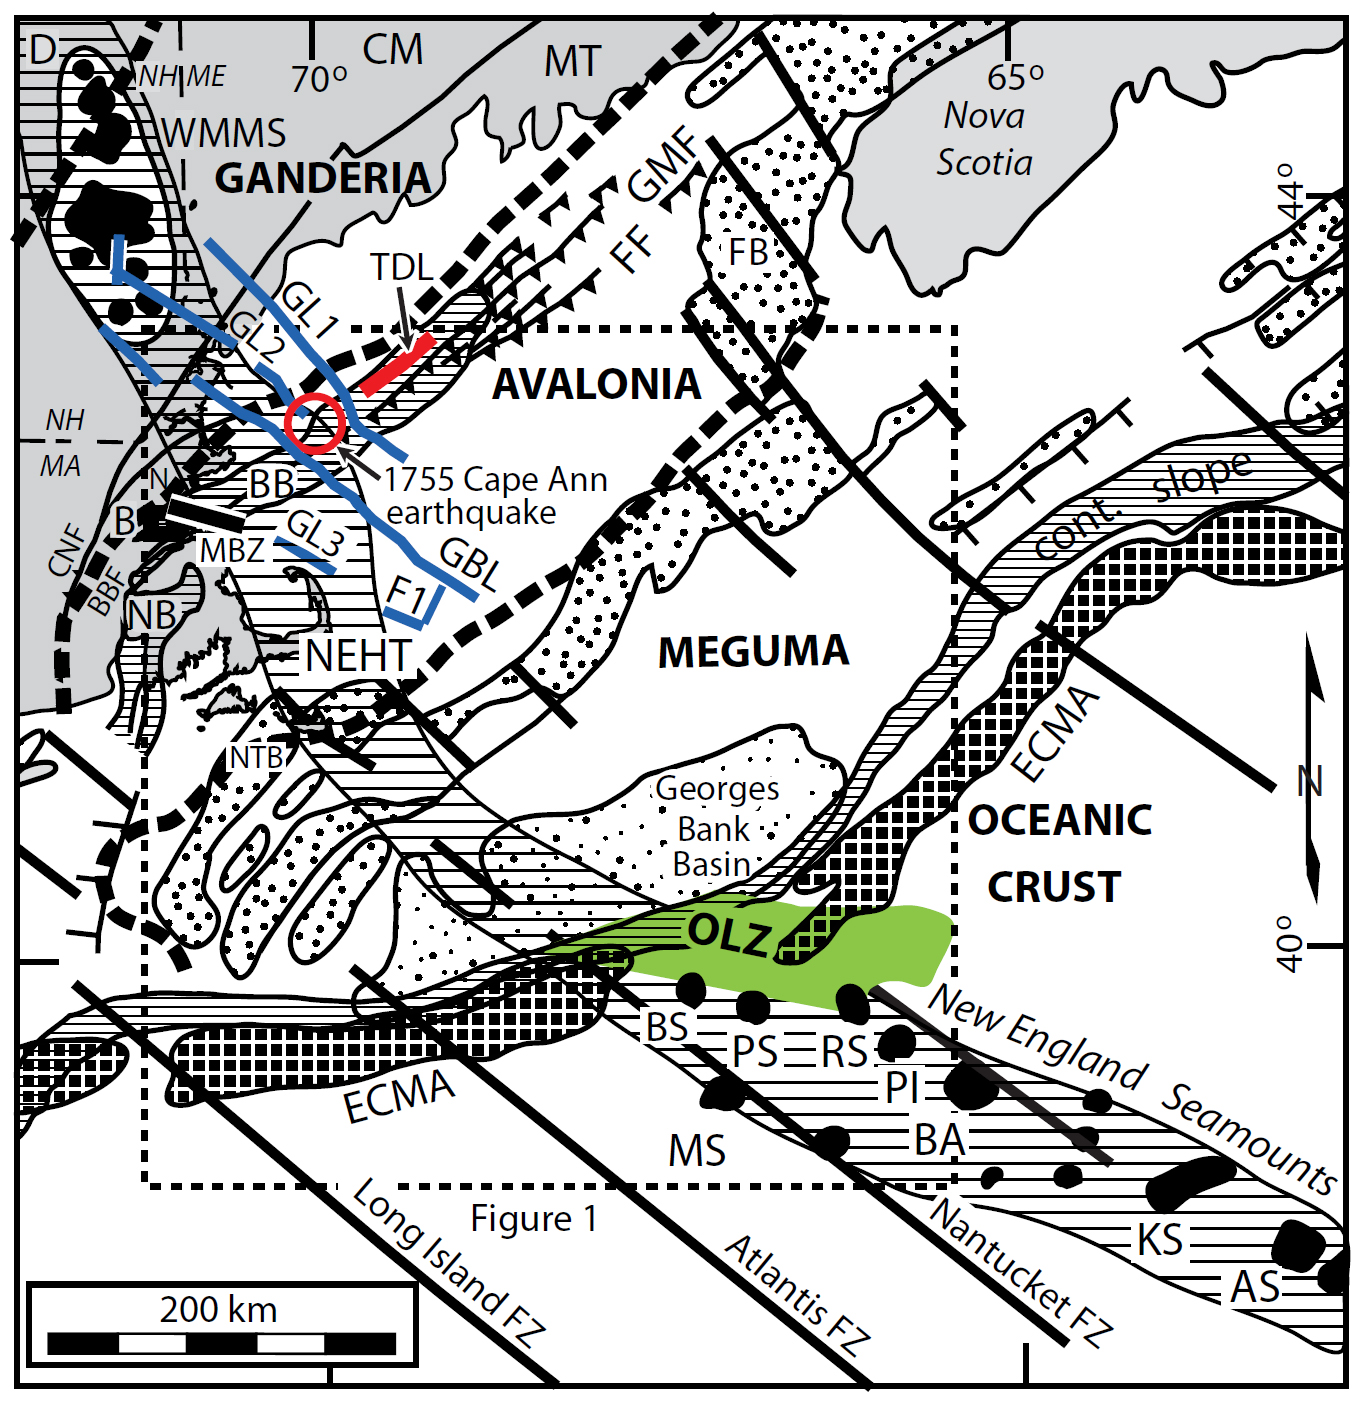
INTRODUCTION
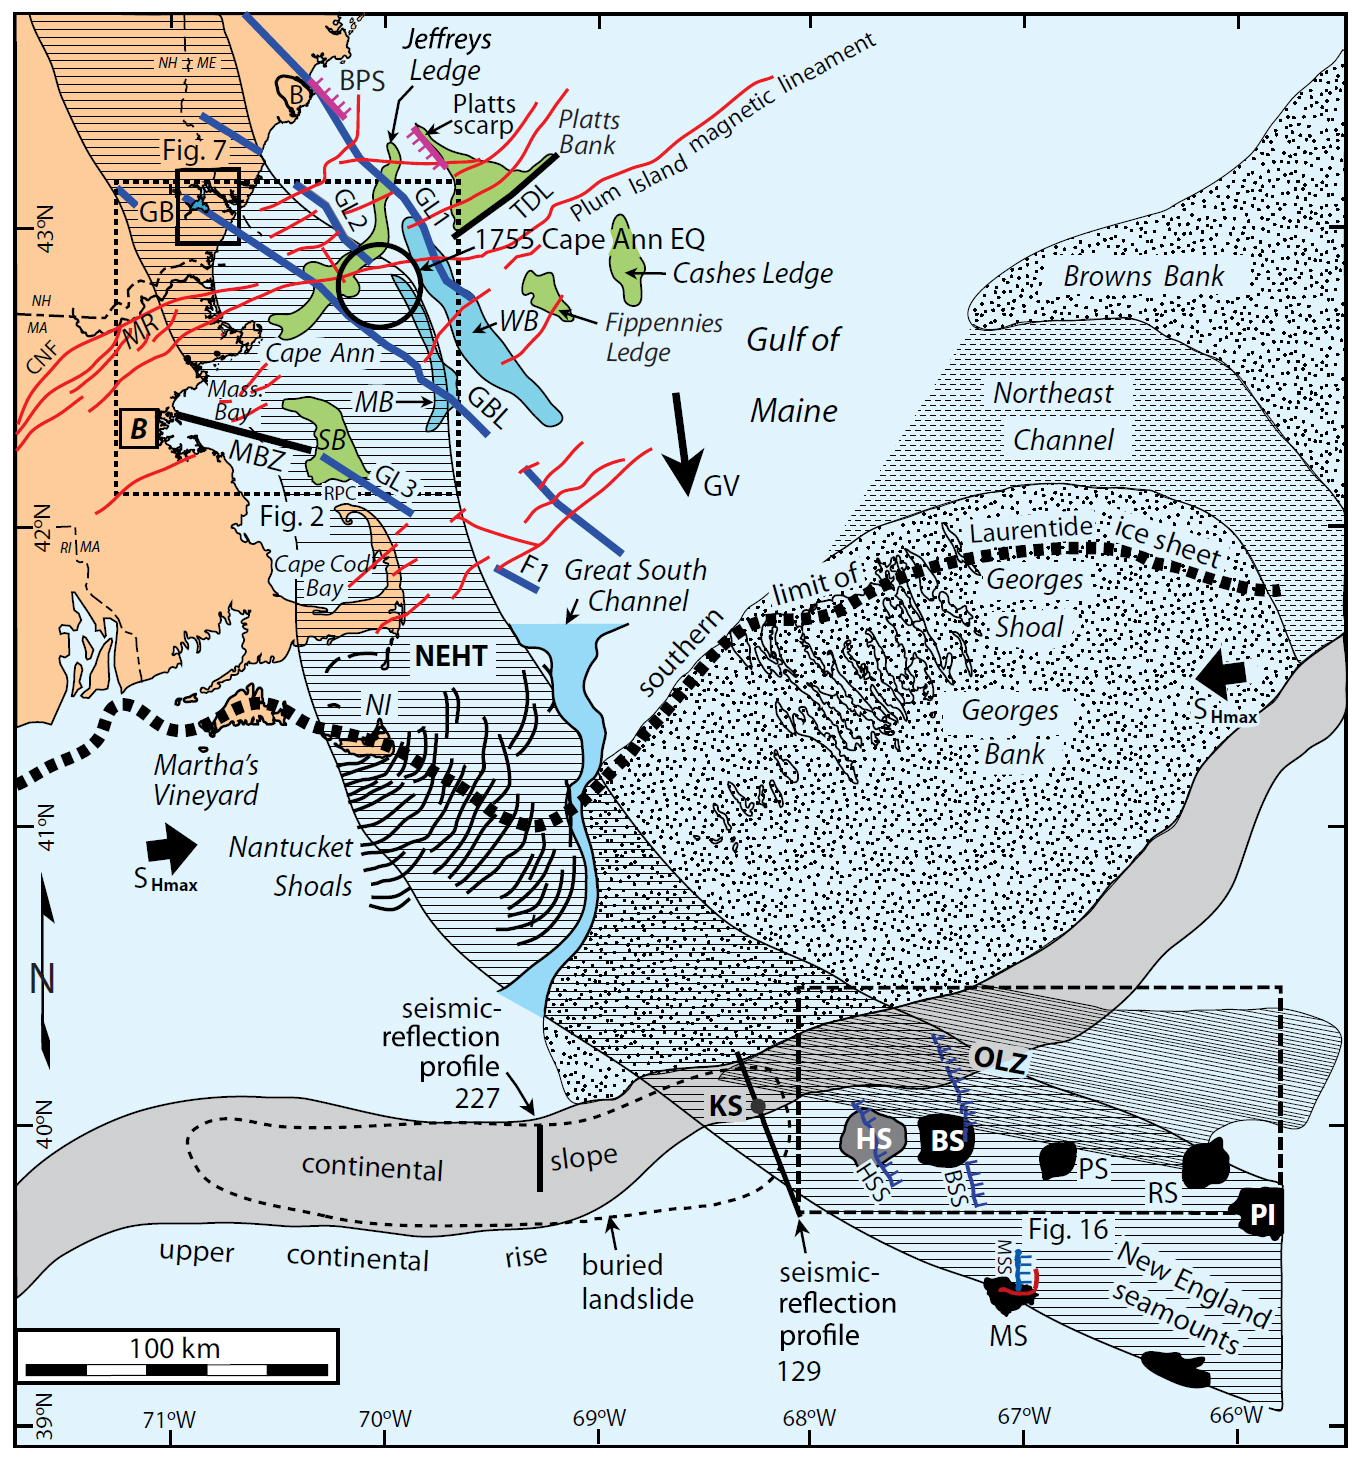
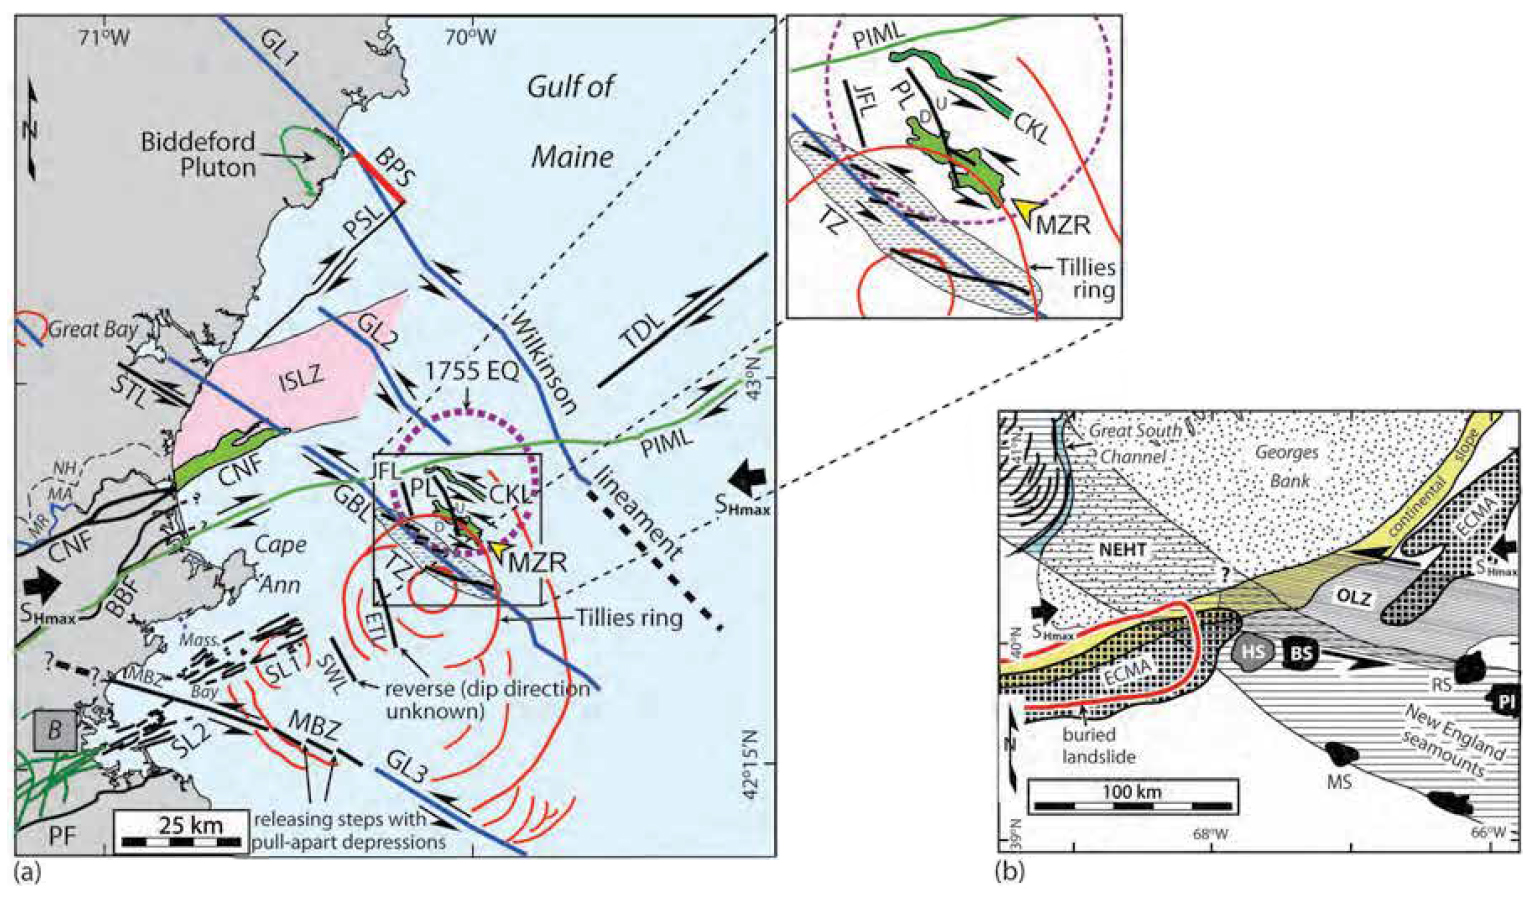
1 Previous investigators (e.g., Ma and Eaton 2007) have postulated that the New England hotspot may have produced a broad zone of structural weakness associated with seismicity. Our goals were to identify potentially active faults along the New England hotspot track (NEHT) between central New England and the New England seamounts, including the fault responsible for the 1755 Cape Ann earthquake, and to better understand the tectonics of the western Gulf of Maine (WGOM) and the continental margin to the southeast. To carry out this investigation we used high-resolution multibeam echosounder and LiDAR data and the gravity and aeromagnetic anomaly maps of Daniels and Snyder (2004). Although seismicity in the WGOM is relatively low level today, the 1755 Cape Ann earthquake, one of the largest historical earthquakes in the northeastern United States, occurred ~30 km east-northeast of Cape Ann, Massachusetts (Figs. 1 and 2). It had a moment magnitude of ~5.9 and caused considerable damage to masonry chimneys and walls in eastern Massachusetts and along the coastal areas of southeastern New Hampshire and Maine (Ebel 2006). Our results reveal a 12-km-long lineament (Pollock lineament) ~30 km east of Cape Ann along which the earthquake may have occurred. We also identified other larger, potentially active fault zones in the WGOM and along the continental margin to the southeast.
 Display large image of Figure 1
 Display large image of Figure 2
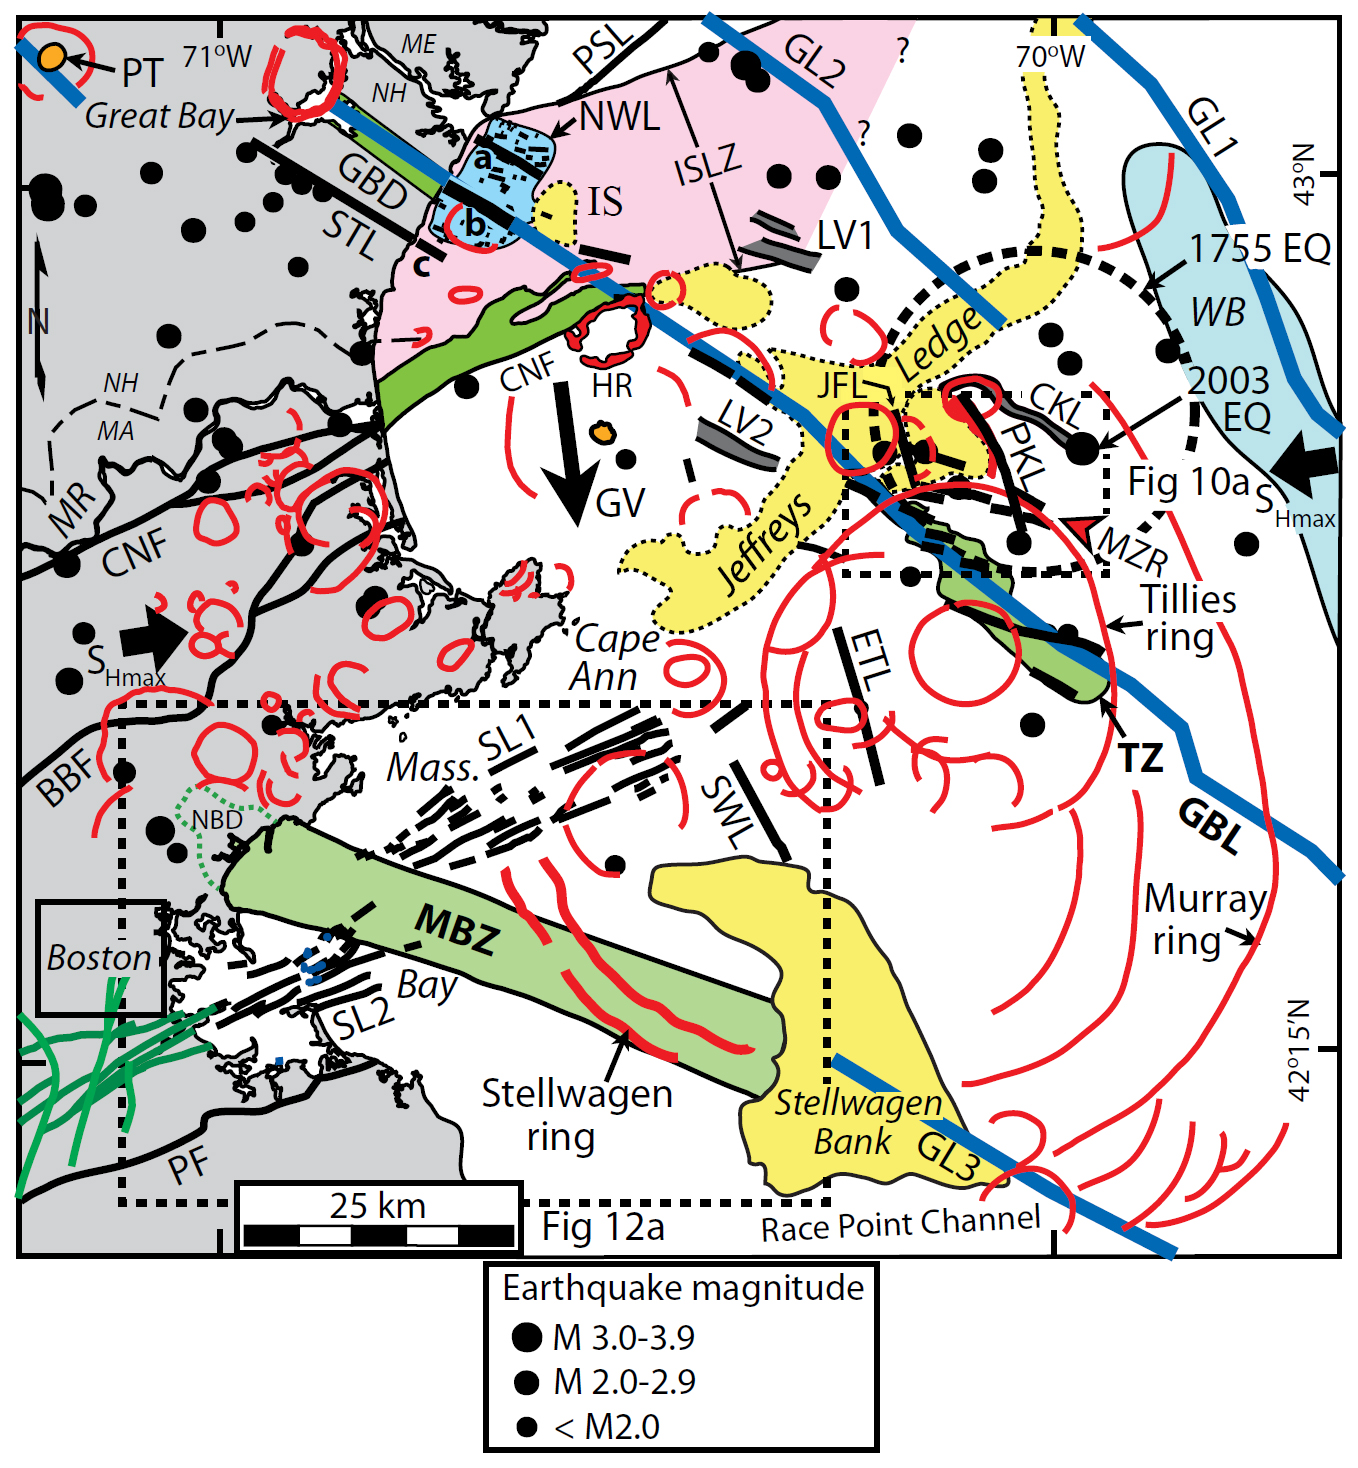
METHODS AND DATA USED
2 The high-resolution multibeam echosounder (MBES) data from the WGOM were collected during 2002–2003 by the Science Applications International Corporation for the University of New Hampshire Center for Coastal and Ocean Mapping-Joint Hydrographic Center and by the National Oceanic Atmospheric Administration (Ward and Johnson 2016). Most of these data were collected with 2- to 5-m resolution (UNH/CCOM-JHC 2015a).
3 The MBES data along the continental margin were collected between 2003 and 2008, but at a lower resolution of 100–200 m (UNH/CCOM-JHC 2015b). Because these data are digital, we were able to construct 2-D bathymetric profiles across various features on the seafloor. Striping occurs in some areas as a result of sonar acquisition and piecing together of the various data sets. We used basic contrast enhancement routines of Adobe Photoshop to digitally enhance the images. Low contrast images were digitally enhanced further using the intensity-hue-saturation routine, which unfortunately alters the color scheme of images.
4 Light detection and ranging (LiDAR) data from the NH GRANIT (2016) and MassGIS Data (2016) websites were used to search for lineaments in southeastern New Hampshire and northeastern Massachusetts. We generated color shaded-relief images from the DEM data using the Hill-shade tool in ArcGIS, an elevation angle of 25°, and a vertical exaggeration of 10×. To determine the best illumination angle for interpretation, we compared images created using different illumination angles. The final color relief images were generated using a color scheme based on elevations of the terrain.
5 We also used the Bouguer/Free-Air gravity and aeromagnetic anomaly maps of Daniels and Snyder (2004) to search for possible faults in the WGOM (figs. 31a and 32a of Marple et al. 2018a). The gravity map was digitally illuminated from the northeast and the aeromagnetic map was illuminated from the east. The spatial resolution of the aeromagnetic data is relatively poor in some areas, such as that east of Cape Ann and Boston (MacNab et al. 1990). We further investigated our results using detailed bathymetric and topographic profiles.
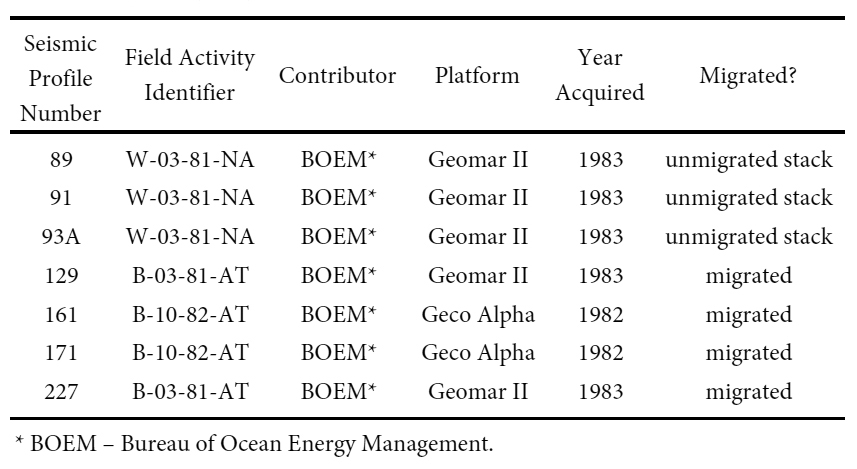
6 Several marine seismic-reflection profiles were used to search for evidence of faults. These data were acquired between 1975 and 1990 by Department of the Interior agencies and petroleum exploration companies and are available from the National Archive of Marine Seismic Surveys (Triezenberg et al. 2016) (Table 1). For the thicknesses of sediments along the continental margin, we converted two-way travel times to metres using a seismic velocity of 2.5 km/s inferred from Sheridan et al. (1988). No deep seismic-reflection profiles traverse the NEHT in the WGOM. Finally, we spatially compared the various lineaments to instrumentally recorded earthquakes to determine if they are associated with potentially active faults. The location error for these epicenters is 3–5 km (J. Ebel 2015 written communication).
 Display large image of Table 1
Correlation of stratigraphic units between seismic-reflection profiles
7 Various stratigraphic units interpreted by Schlee and Klitgord (1988) were projected across the seismic-reflection profiles where possible. Two Jurassic horizons denoted J1 and J2 were used from these studies. J1 corresponds to a red argillaceous limestone layer at the top of the Upper Jurassic Cat Gap Formation and J2 is a horizon at the top of the Middle Jurassic sediments (Schlee and Klitgord 1988). Schlee and Klitgord (1988) also interpreted an Upper Cretaceous horizon labeled C on our profiles. We also mapped the Paleocene unconformity Au of Tucholke and Mountain (1979) where possible.
REGIONAL GEOLOGY
Accreted terranes
8 Three major NE-SW-trending terranes underlie the Gulf of Maine and adjacent onshore area (Fig. 3). Ganderia (Hibbard et al. 2006) includes the Nashoba, Merrimack, and Central Maine terranes of earlier workers and consists mainly of Late Precambrian to Devonian metasedimentary and plutonic rocks (Acaster and Bickford 1999). Avalonia (Fig. 3) is a peri-Gondwanan microcontinent with Late Precambrian strata dominated by arc-related volcanic, plutonic, and volcaniclastic rocks (Hibbard et al. 2006). It includes Late Precambrian to Cambrian rocks of the Boston Basin and Late Devonian sedimentary rocks of the Narragensett Basin in Massachusetts and Rhode Island (Thompson and Hermes 2003). Boston Basin is a fault-bounded intra-arc basin that is filled predominantly with Roxbury Conglomerate and Cambridge Argillite (Thompson et al. 2013). The northwestern part of Avalonia is cut by NE-SW-trending, southeast-dipping thrust faults of the Gulf of Maine fault zone (Hutchinson et al. 1988) (Fig. 3).
 Display large image of Figure 3
9 The Meguma terrane southeast of Avalonia (Fig. 3) consists of a thick sequence of Early Cambrian to Early Ordovician metasandstone and slate locally overlain by Early Silurian to Early Devonian slate, quartzite, and volcanic rocks (White and Barr 2012). These rocks were deformed and variably metamorphosed during the Early to Middle Devonian Neoacadian orogeny (White and Barr 2012).
10 Superimposed on the Avalonian and Meguma terranes are several NE-SW-oriented, Late Triassic–Early Jurassic rift basins, such as the Nantucket basin (e.g., Manspeizer and Cousminer 1988) (Fig. 3). These basins are filled with thousands of metres of terrigenous strata composed of arkosic sandstone, siltstone, shale, and conglomerate interbedded with layers of basalt (e.g., Zen et al. 1983).
Stratigraphy and surficial geology onshore and beneath the WGOM
11 The sediments that cover the various terranes include Late Cretaceous to early Pleistocene coastal plain sediments, Pleistocene till and moraine deposits, Pleistocene to Holocene glaciomarine and marine deposits, and late Pleistocene glaciolacustrine deposits (Uchupi and Bolmer 2008). The coastal plain sediments consist mainly of loose gravel, sand, silt, and clay that were deposited between Late Cretaceous and early Pleistocene time when the gulf was above sea level (Uchupi and Bolmer 2008). Most of these sediments were removed by Pleistocene glaciations and episodes of fluvial erosion during major regressions in sea level between the late Eocene and late Pliocene (Uchupi and Bolmer 2008). Overlying the coastal plain sediments are Pleistocene till and glaciomarine sediments (Schnitker et al. 2001).
Stratigraphy beneath the continental margin southeast of Nantucket Island, Massachusetts
12 The most prominent stratigraphic province beneath the continental shelf in the study area is Georges Bank Basin (Fig. 3). It consists of several subbasins filled with Jurassic through Paleogene synrift and postrift sediments that thicken seaward to over 10 km (Schlee and Klitgord 1988). The thickest deposits in Georges Bank Basin are Jurassic and consist of evaporites overlain by carbonate and clastic sediments (Schlee and Klitgord 1988). The Pleistocene sediments overlying Georges Bank Basin consist of gravel, sand, silty clay, clay, and sandy to clayey limestone that are up to a few hundred metres thick (Uchupi and Bolmer 2008). Along the seaward side of Georges Bank Basin is a Jurassic carbonate reef platform that is buried ~1 to 1.5 km beneath the continental slope (Austin et al. 1980). Seaward of this carbonate platform is a narrow, seaward-thickening, 500- to 600-m-thick sedimentary wedge that is heavily dissected by submarine canyons (e.g., Pratson and Coakley 1996).
13 Seaward of the continental slope are the upper continental rise deposits consisting of carbonate debris eroded from the Jurassic platform and a thick onlapping wedge of Paleogene, Neogene, and Quaternary clay, claystone, and shale (Schlee et al. 1985). Beneath the upper continental rise are sedimentary packages that are bounded by laterally extensive unconformities (e.g., Schlee et al. 1985). The most prominent of these unconformities is the Paleocene unconformity denoted Au (Danforth and Schwab 1990).
Morphologic features of the WGOM and continental margin
14 The seafloor beneath the Gulf of Maine is characterized by deep (>200 m) basins, low swells, irregular-crested ridges, and flat-topped banks and ledges produced by Pleistocene glaciations and periods of fluvial erosion between the late Eocene and Pleistocene (Uchupi and Bolmer 2008). These processes produced the submerged basins, such as Wilkinson Basin, and the ridge-like features, such as Jeffreys Ledge, Pratts Bank, and Stellwagen Bank (Fig. 4) (Uchupi and Bolmer 2008). A common morphological feature in the WGOM are curvilinear iceberg scours created by floating icebergs that dragged along the seafloor after they detached from the retreating Laurentide ice sheet (e.g., Parrott et al. 2008). There are also parallel raised bioherms (reefs) in a few areas that form low (up to ~3 m in height) parallel ridges composed mainly of horse mussels (Wildish et al. 2009). Between coastal New Hampshire and Cape Cod are curved depressions and ridges that Marple et al. (2018a) attributed to NEHT-related igneous intrusions, such as the ~35-kmdiameter Tillies ring, which consists of two concentric, ring-shaped depressions in the seafloor east of Cape Ann (Fig. 2). East of Tillies ring is the ~75-km-long arc-shaped Murray Basin and the ~90-km-long, NW-SE-oriented Wilkinson Basin (Fig. 5). Along the outer continental shelf, Georges Bank separates the Gulf of Maine from the open ocean (Fig. 1). The continental slope and rise lie southeast of Georges Bank (Fig. 1).
 Display large image of Figure 4
 Display large image of Figure 5
LINEAMENT STUDY
15 The main area where lineaments were sought was along the NEHT between central New England and the New England seamounts, especially east of Cape Ann where the 1755 Cape Ann earthquake occurred. The various linear features are described from northwest to southeast across this area. For descriptive purposes, informal names are assigned to lineaments and other features identified in t his study based on nearby previously named bathymetric features where possible; where such names are not available, features are arbitrarily named. Formally named features such as Powell Canyon are capitalized.
Biddeford Pool scarp and depression
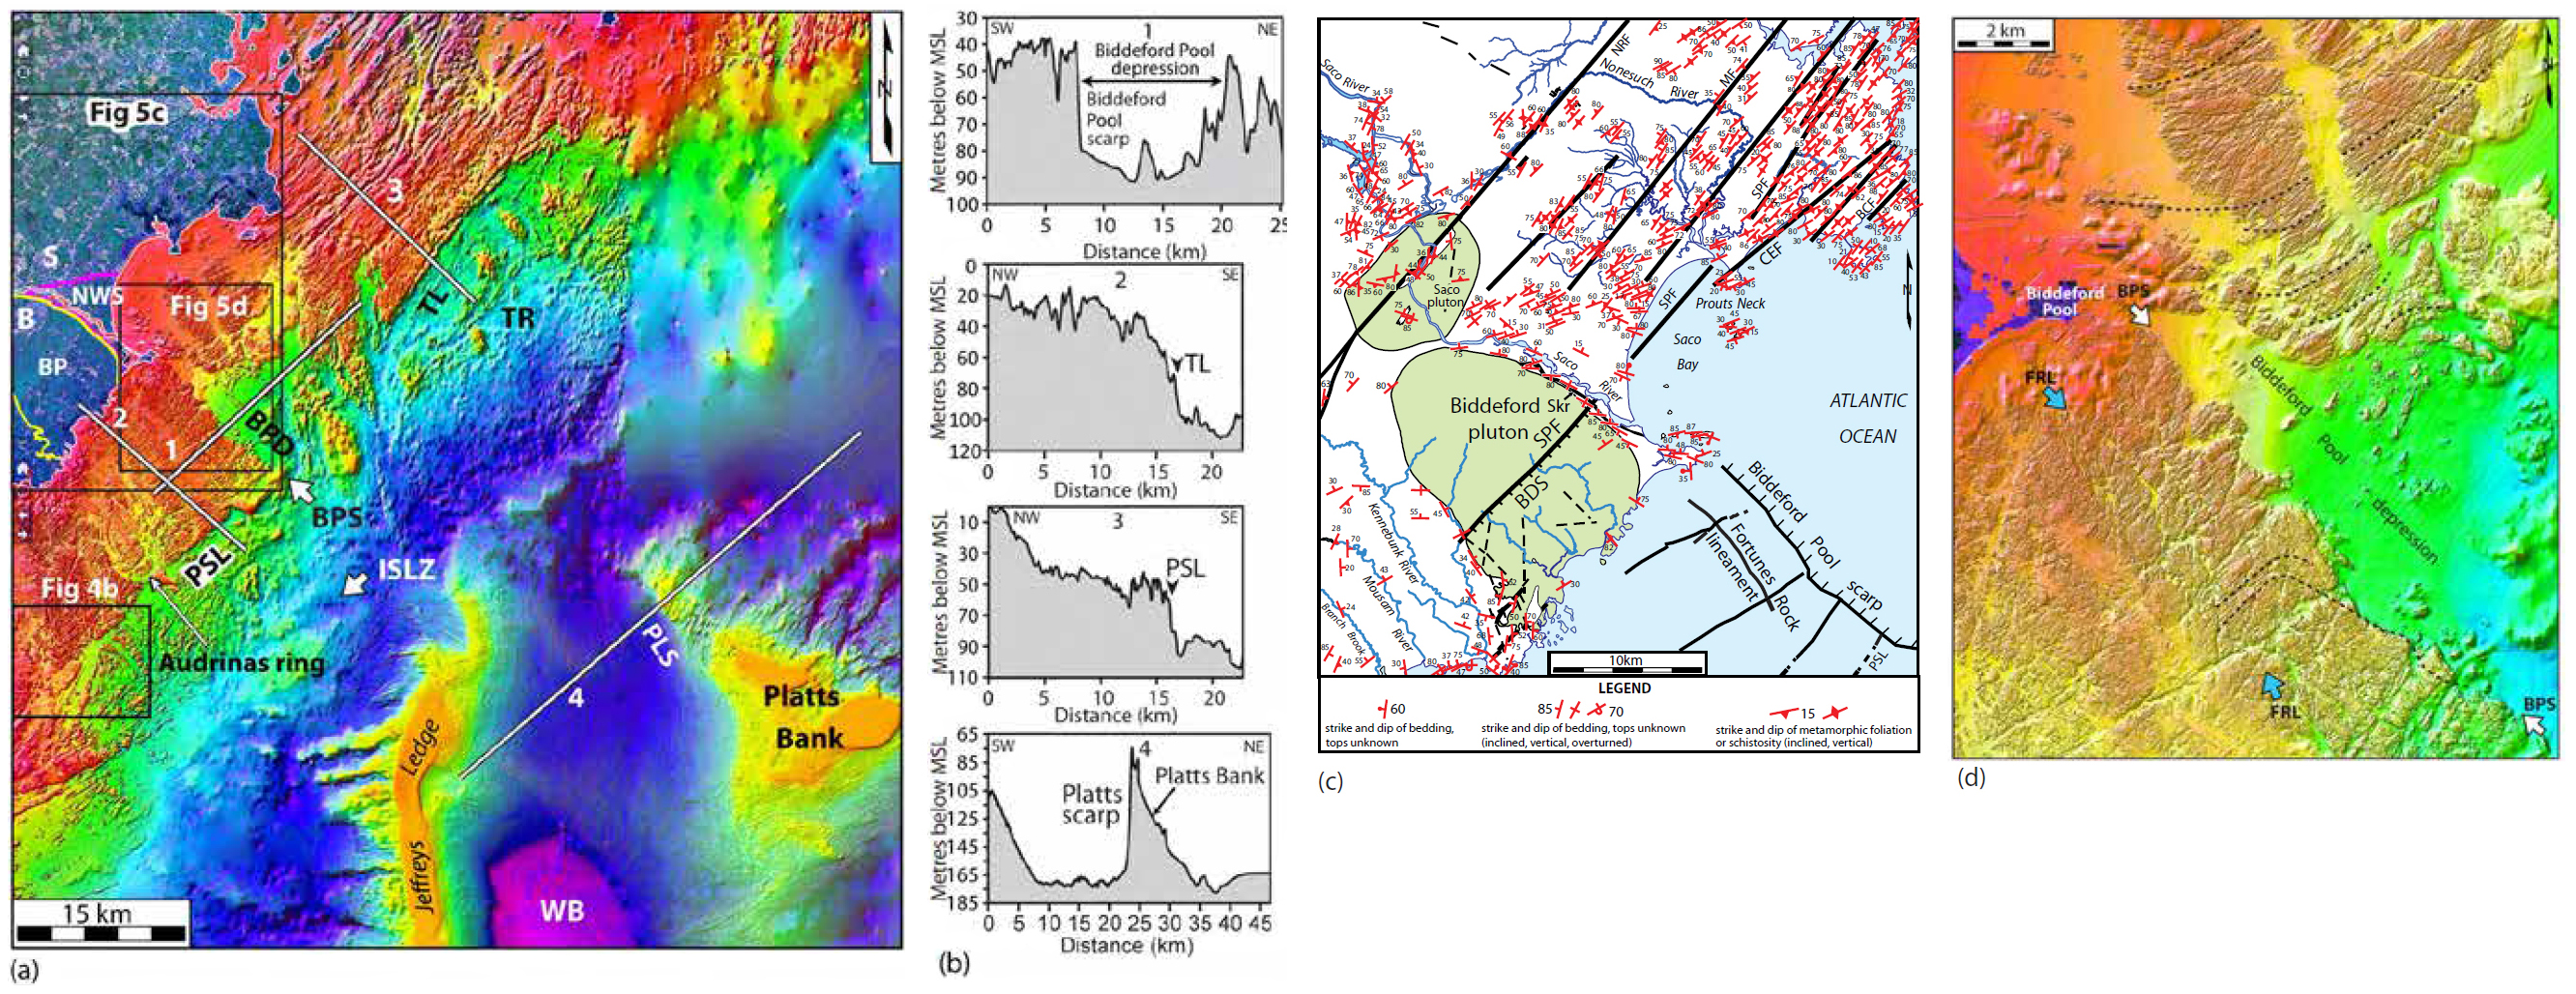
16 The MBES data revealed a ~15-km-long, NW-SE-trending, NE-facing, ~30-m-high scarp offshore from Biddeford Pool, Maine, here named the Biddeford Pool scarp (Fig. 4). Northeast of the scarp, the Biddeford Pool depression is up to 50 m deep and 17 km wide (Fig. 5b, profile 1). Southwest of and parallel to the scarp are numerous linear depressions trending NW-SE, the longest of which is the 8-km-long, 20-m-deep Fortunes Rock linear depression (Fig. 5c). The Biddeford Pool scarp coincides approximately with gravity lineament GL1 and is aligned with the NW-SE-oriented Wilkinson Basin to the southeast (Fig. 4). The scarp and depression are also aligned with the anomalous NW-SE-trending strikes of bedding and foliation of the Merrimack terrane north of the Biddeford pluton onshore (Hussey 2003a, 2003d) that generally trend NE-SW elsewhere (Hussey et al. 2016) (Fig. 5c). They also parallel the NW-SE-oriented long axis of the Biddeford pluton and the ~7-km-long pair of concentric ring-shaped depressions (Audrinas ring; Fig. 5a). The NW-SE-orientations of the Biddeford pluton and Audrinas ring are anomalous because other Paleozoic plutons onshore in southern Maine trend NE-SW (Fig. 4). Southeast of the Biddeford Pool depression, Platts scarp is a 15-kmlong, NW-SE-oriented, southwest-facing, 80-m-high scarp along the southwestern side of Platts Bank (Fig. 5a).
NE-SW-trending lineaments beneath the westernmost Gulf of Maine
17 The Thompson lineament is a gently curved, 40- to 50-m-high, east-facing scarp northeast of the Biddeford Pool depression (Fig. 5). The southwestern end of this lineament curves southward to form part of the Thompson ring, a 20-km-wide, 30-km-long, NNE-SSW-elongate depression in the seafloor (Figs. 4a and 5a).
18 The Poseidon lineament is a 45-km-long scarp and linear depression oriented NNE-SSW southwest of the Biddeford Pool scarp. It ends abruptly to the southwest along the northern edge of the NE-SW-trending Isles of Shoals lineament zone (Fig. 5a). The northeastern part of the Poseidon lineament is characterized by an ~18-km-long, east-facing, 35-m-high scarp (Fig. 5b, profile 3) whereas the southwestern part of the lineament is characterized by a linear, 100- to 200-m-wide, 10- to 20-m-deep depression. Between the Poseidon lineament and the coast are other shorter, less prominent NE-SW-trending linear depressions generally less than 10 m deep. South of the Poseidon lineament, several shorter (<4 km long) NNE-SSW-trending lineaments crosscut the Isles of Shoals lineament zone near the coast (Fig. 6).
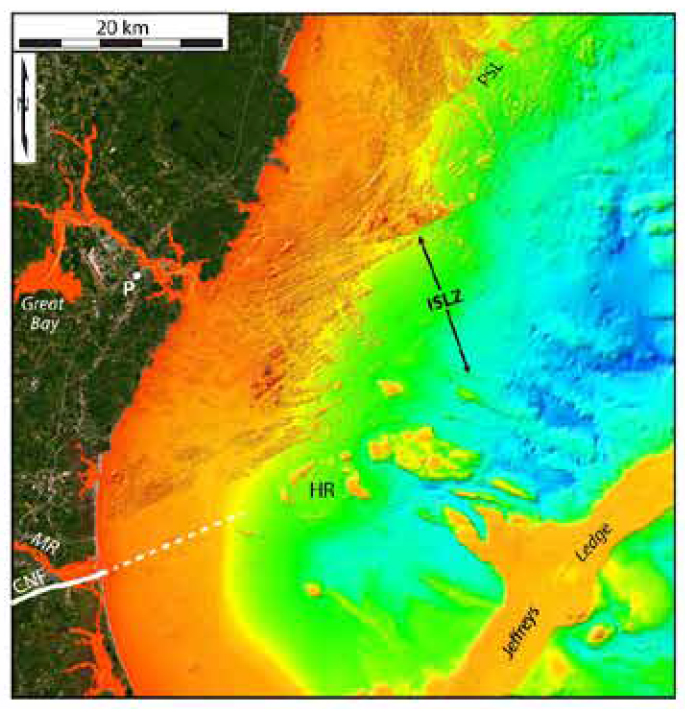
19 The Isles of Shoals lineament zone (ISLZ) is a ~15-kmwide, ~50-km-long zone of lineaments characterized by linear depressions that are generally less than 15 m deep, although a few are up to 50 m deep near the Isles of Shoals (Fig. 6). The ISLZ parallels a ~4.5-km-wide, 23-km-long, relatively smooth area in the seafloor to the south that is continuous with the Clinton-Newbury fault (CNF) onshore (Fig. 6). The area along the northwest side of the CNF onshore is also associated with relatively smooth terrain (Marple et al. 2018b). The ISLZ and CNF cannot be traced farther to the northeast because of the poor resolution of the sonar data there. A few aeromagnetic lineaments coincide with the ISLZ (Fig. 1). South of the ISLZ the Plum Island magnetic lineament traverses the epicentral area of the Cape Ann earthquake (Fig. 1).
 Display large image of Figure 6
Great Bay lineament
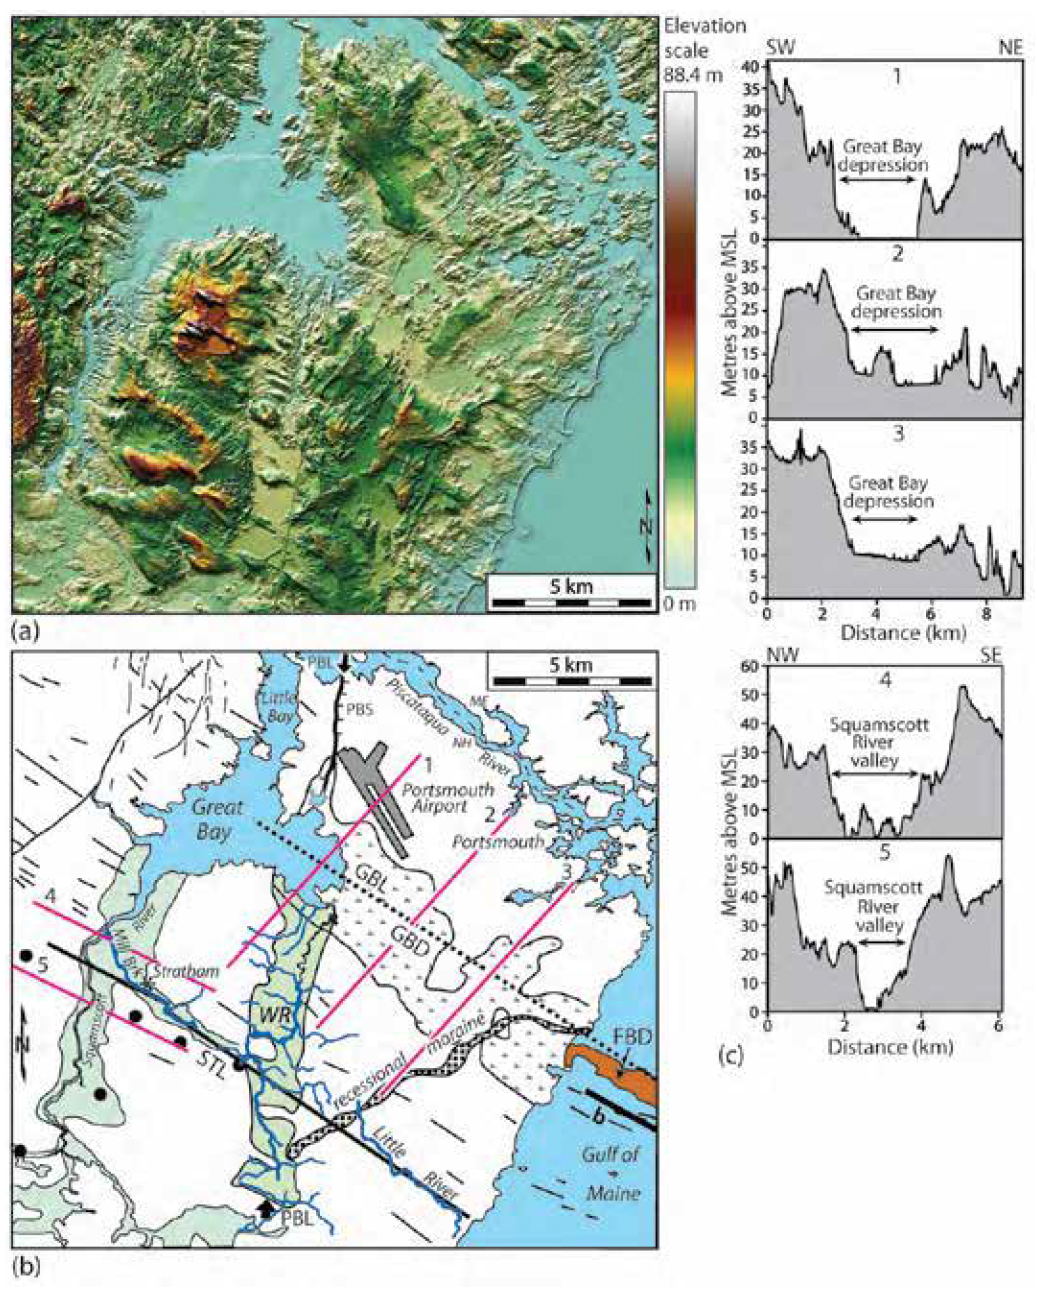
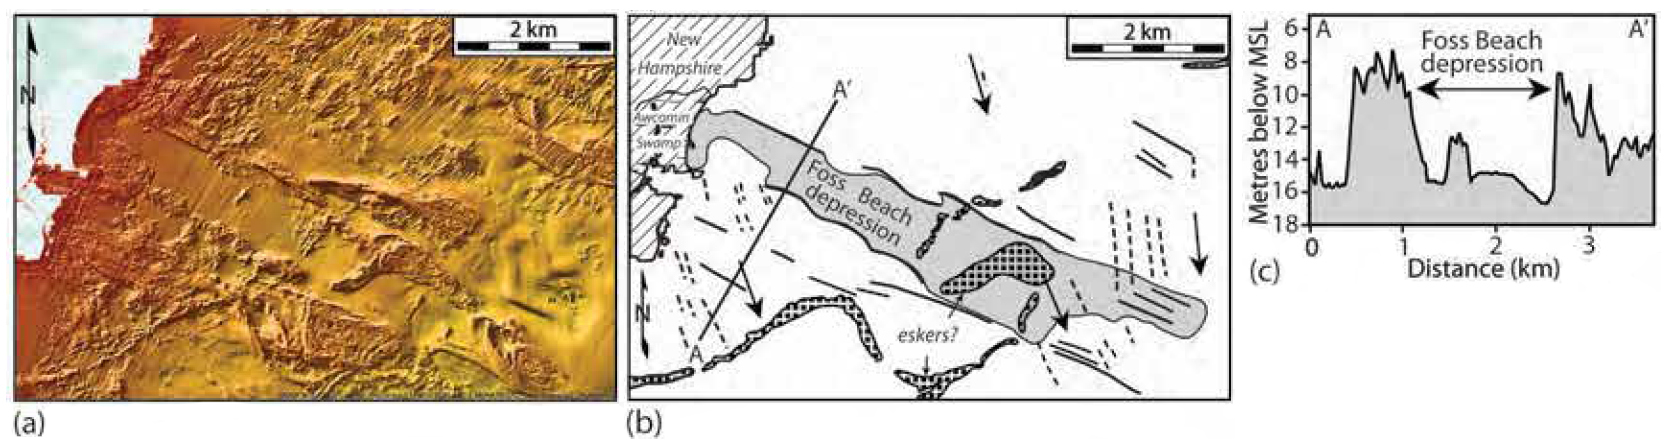
20 The gravity anomaly map of Daniels and Snyder (2004) shows several NW-SE-trending, linear positive gravity anomalies that traverse Ganderia and Avalonia (Fig. 3), the longest of which is the Great Bay gravity lineament (GBL). Onshore, the GBL coincides with the ~15-km-long, ~3-km-wide Great Bay depression (Fig. 7c, profiles 1–3). Just offshore from the Great Bay depression are three lineaments ‘a’, ‘b’, and ‘c’ (Fig. 2) that Birch (1984) hypothesized to be faults. Lineament ‘a’ is aligned with the NW-SE-oriented reach of the lower Piscataqua River and the Burlington lineament of McHone and Shake (1992). Lineament ‘b’ occurs along the same trend as the Great Bay depression onshore and lineament ‘c’ is collinear with the Stratham lineament (Fig. 2). Just offshore the Foss Beach depression is a linear, NW-SE-trending, 7-km-long, ~1.2-km-wide, 7-m-deep depression (Fig. 7b, 8). In addition to these features is a 12-km-wide zone of relatively short (< 1 km long), NW-SE-trending lineaments in the seafloor just offshore (NWL in Fig. 2).
 Display large image of Figure 7
 Display large image of Figure 8
21 Along the GBL and near the southern edge of the epicentral area of the Cape Ann earthquake is a linear, 6-km-wide, 35-km-long zone of left-stepping, en échelon rectilinear de-pressions that traverses the area inside the Tillies outer ring (Fig. 9). These linear depressions range in depth from ~8 m to 20 m below the surrounding seafloor (Fig. 9b). The longest of these lineaments is a 12-km-long, 700-m-wide, ~20-m-deep linear depression traversing the southeastern end of the Tillies zone. Numerous, mostly NE-SW-oriented iceberg scours also traverse this area (Fig. 9a).
 Display large image of Figure 9
Linear depressions, scarps, and rectangular depressions traversing the epicentral area of the 1755 Cape Ann earthquake
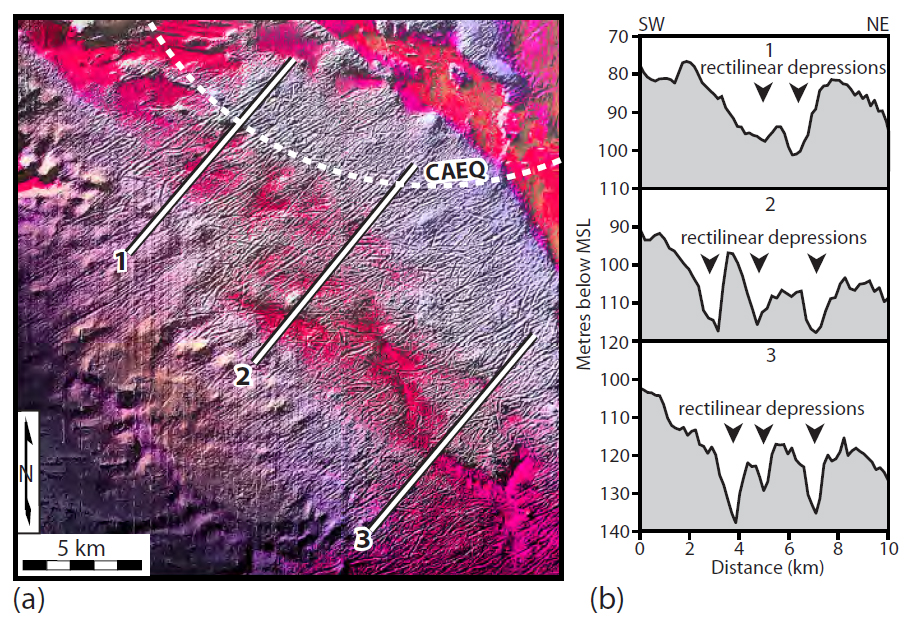
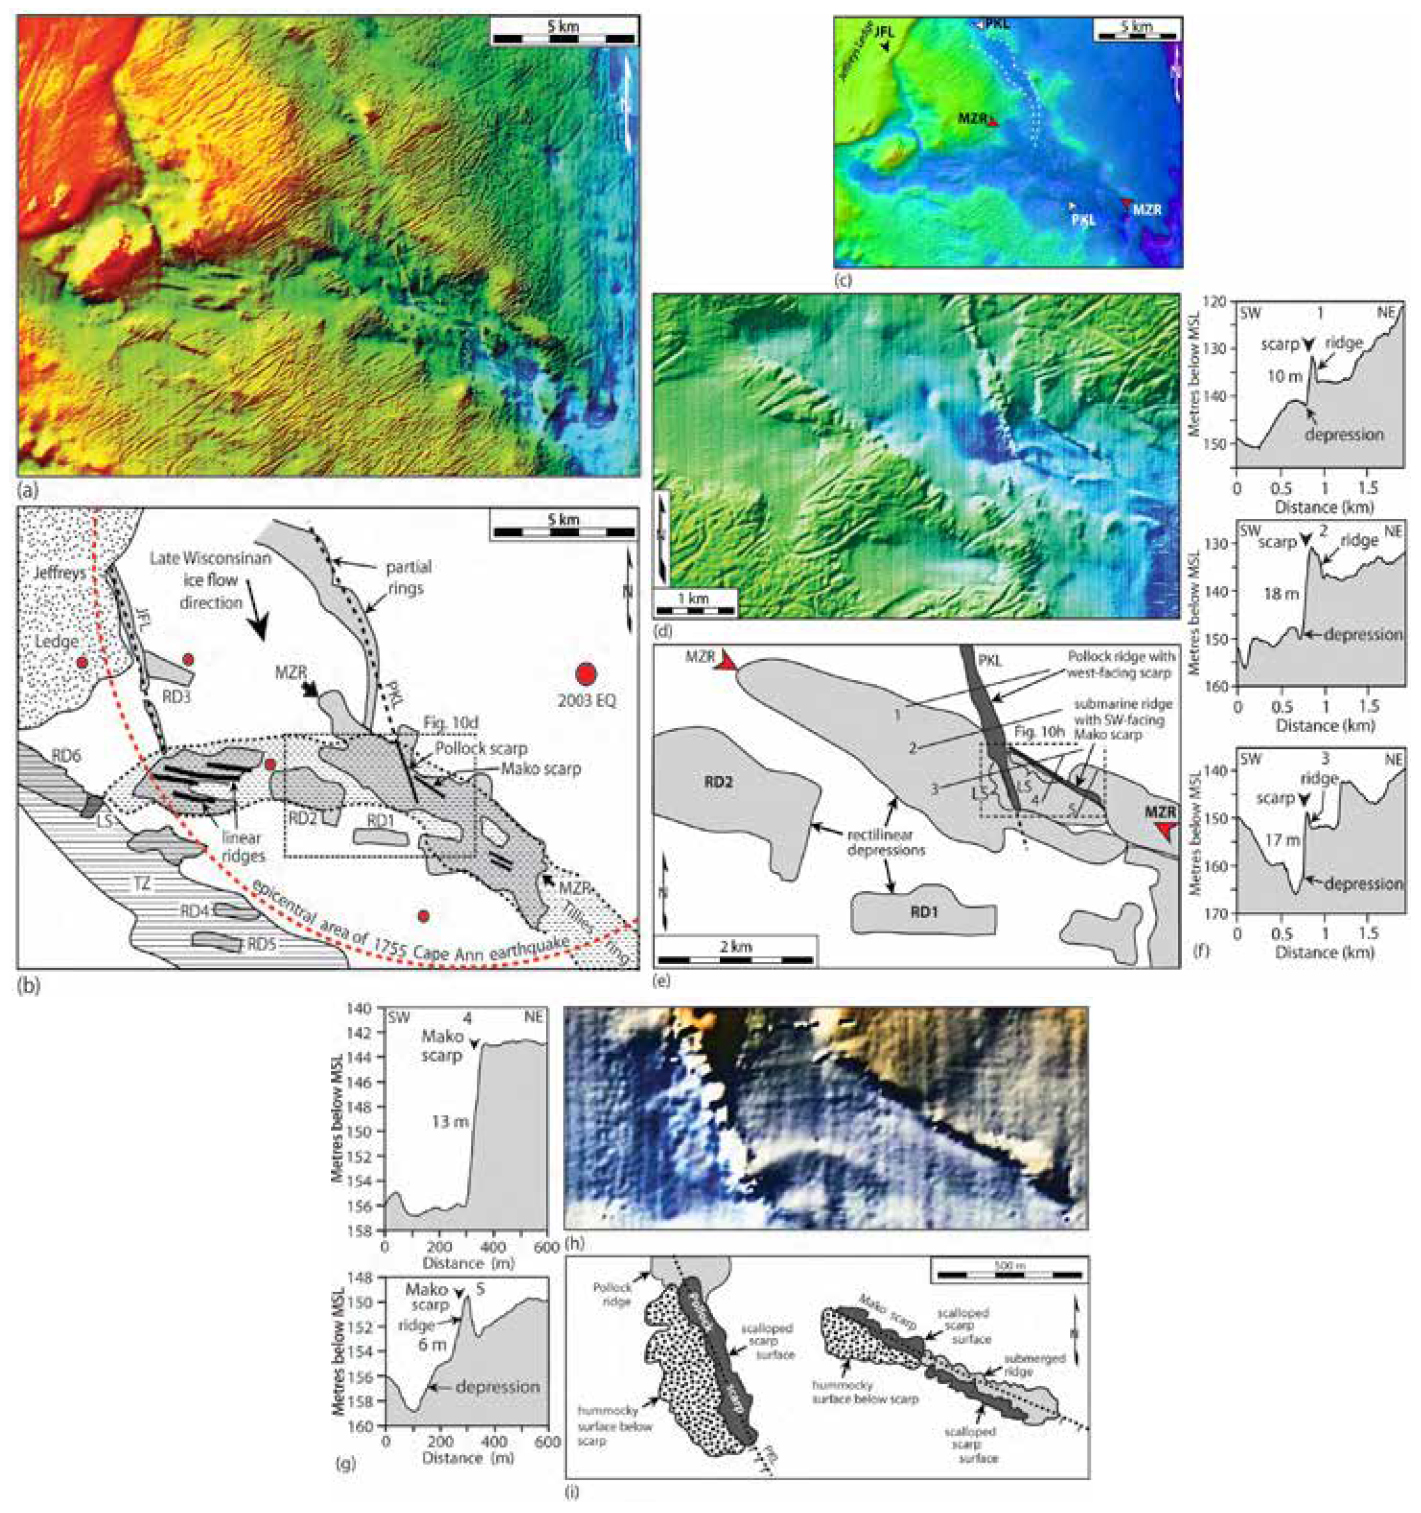
22 Along the northern part of Tillies ring and within the southern part of the epicentral area of the Cape Ann earthquake are several WNW-ESE-oriented rectilinear depressions and areas of WNW-ESE-trending parallel, low-lying (<3 m) linear ridges within some of the depressions (Fig. 10). The rectangular depressions are generally several hundred metres wide and up to 5 km long. The rectangular depressions are unique to this area because most other ring-shaped depressions along the NEHT are relatively smooth and lack these rectangular depressions (Marple et al. 2018a). Numerous iceberg scours, mostly oriented NE-SW, also traverse this area (Fig. 10a).
 Display large image of Figure 10
23 The Pollock lineament is a 12-km-long, 25-m-deep, NNW-SSE-oriented linear depression (Fig. 10b). The part of the lineament that traverses the Tillies outer ring is characterized by the conspicuous, 2-km-long, 100- to 250-m-wide, 3- to 6-m-high Pollock ridge, along the crest of the ~18-m-high, southwest-facing Pollock scarp (Figs. 10d, 10f, and 10h). The southernmost, ~700-m-long portion of the scarp has a scalloped surface along its crest and a hummocky surface along its base (Fig. 10h). North-northwest of Pollock scarp is an 8-km-long, 600- to 900-m-wide curvilin-ear depression that is up to 25 m deep (Fig. 10b). This curvilinear depression lies within a larger, ~1.3-km-wide linear depression (Fig. 10c).
24 East of the Pollock lineament is the 1-km-long, WNW-ESE-oriented, southwest-facing, 13-m-high Mako scarp that traverses the northern part of the Tillies out-er ring (Figs. 10b, 10d, and 10g). The southeastern end of the scarp is associated with a low-lying, 700-m-long, 60- to 90-m-wide, 3-m-high ridge along its crest and a 3-m-deep depression along its base. The northwestern end of the Mako scarp, in contrast, lacks a ridge along its crest. Like the Pollock scarp, the base of the Mako scarp to the northwest is hummocky (Fig. 10i). The Mako scarp coincides with a linear, WNW-ESE-oriented zone of rectilinear depressions along the northern part of Tillies ring, here named the Mako zone (Fig. 10e).
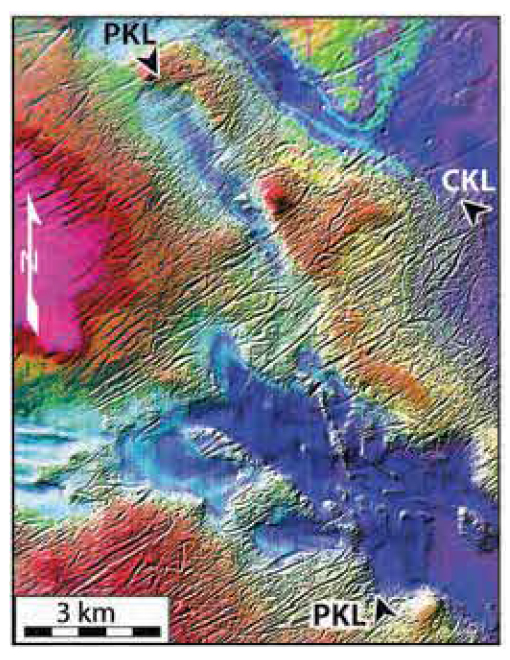
25 The Cherokee lineament is a ~12-km-long, ~800-m-wide, ~15-m-deep curvilinear depression, east of the Pollock lineament (Fig. 11). Jeffreys lineament is another linear depression located toward the western side of the epicentral area of the Cape Ann earthquake. It is 35 m deep, 6 km long, up to 350 m wide, and terminates against Jeffreys Ledge to the northwest (Fig. 10a).
 Display large image of Figure 11
Other linear depressions south of Jeffreys Ledge
26 The East Tillies and Stellwagen lineaments are NNWSSE-trending canyon-like depressions that traverse Tillies Platform southwest of the epicentral area of the Cape Ann earthquake. The East Tillies lineament is a ~13-km-long, 58-m-deep, 800-m-wide linear depression that converges with an arc-shaped depression to the northwest (Fig. 2). The Stellwagen lineament is a ~11-km-long, 900-m-wide, >70-m-deep linear depression.
Massachusetts Bay zone
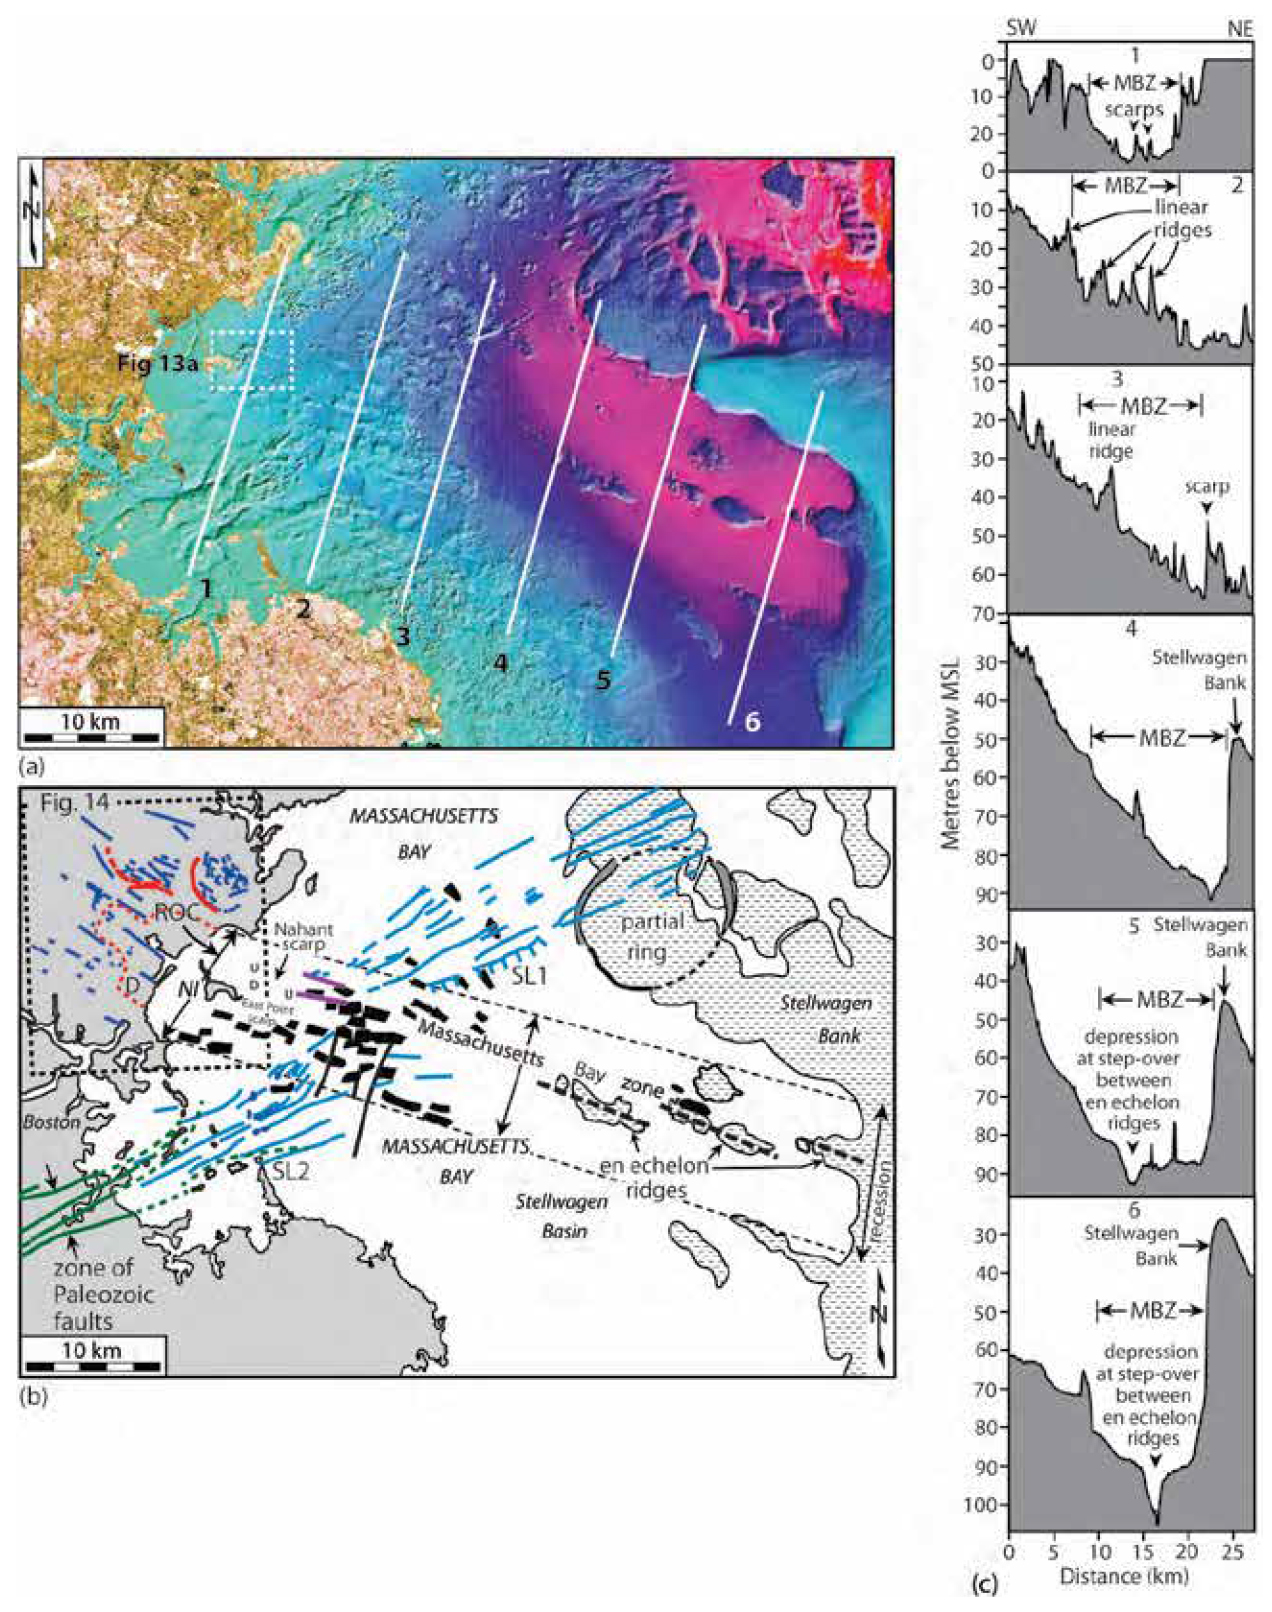
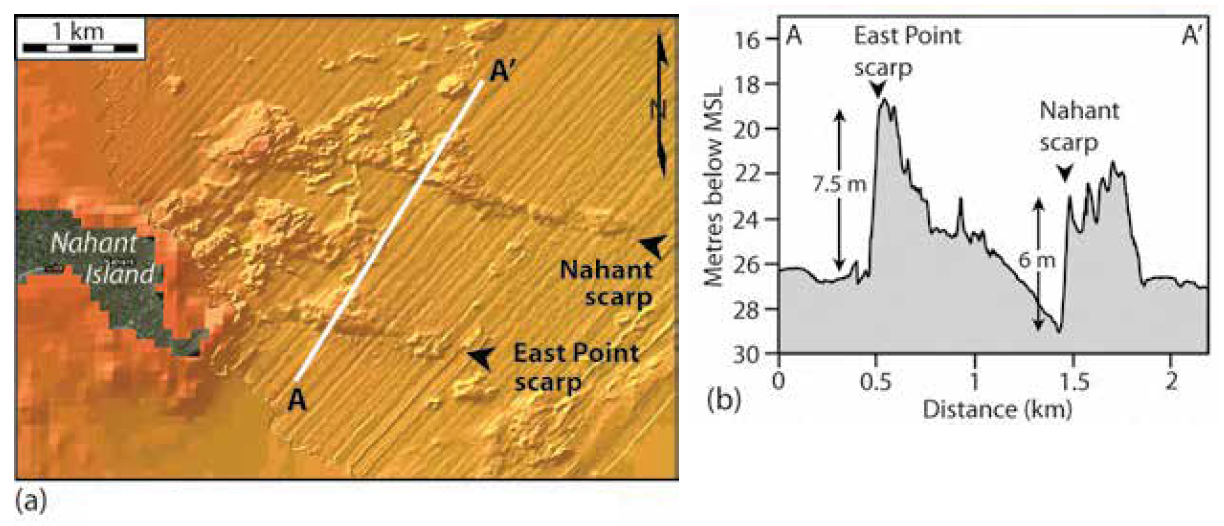
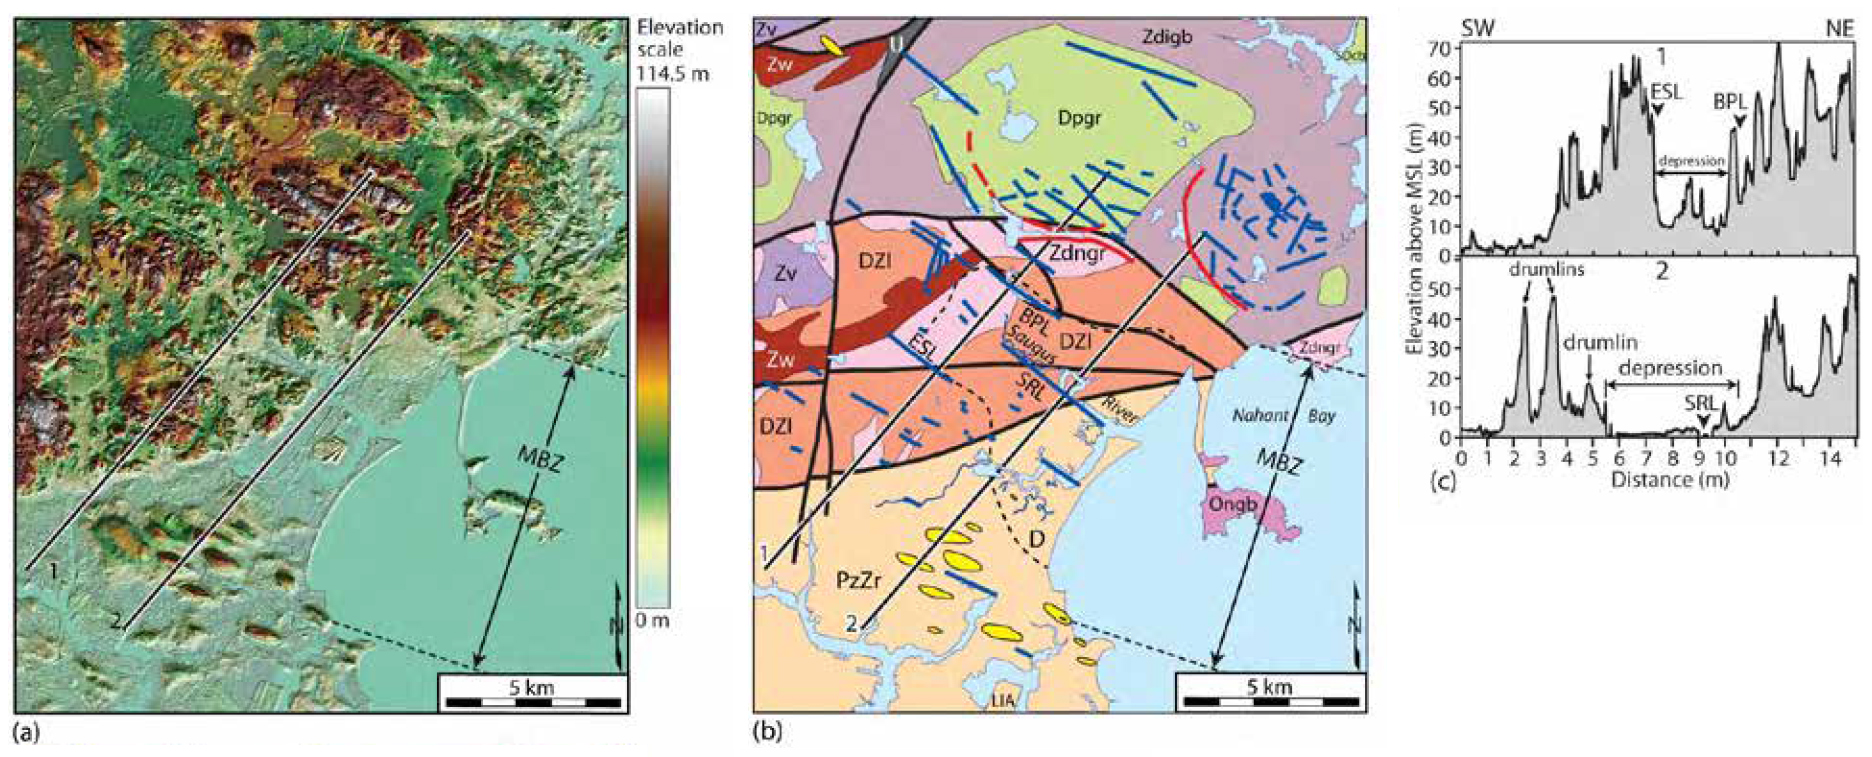
27 The Massachusetts Bay zone (MBZ) is a 10- to 12-kmwide, 50-km-long, WNW-ESE-oriented zone of submarine scarps and linear ridges offshore from Boston (Fig. 12). The MBZ is defined mostly by the collinear alignment of a 22-km-long, 10-km-wide zone of block-like, bathymetrically high areas in the seafloor, two short parallel scarps, and three submerged en échelon ridges to the southeast (Figs. 12a and 13a). The blocks to the northwest range in length from a few hundred metres to ~1.5 km, are up to 500 m wide, and have a maximum relief of 15 m (Fig. 12c, profile 2). Southeast of this area are three submerged en échelon ridges. At the step-overs between the ridges are 6- to 13-m-deep depressions (Fig. 12c, profiles 5 and 6).
 Display large image of Figure 12
 Display large image of Figure 13
28 The Nahant and East Point scarps are 1.6- and 2.3-kmlong, south-facing scarps in the seafloor east of Nahant Island (Fig. 13). Nahant scarp has a maximum relief of 6 m and East Point scarp has a maximum relief of 7.5 m (Fig. 13b).
29 The MBZ coincides with a submerged 10- to 12-km-wide valley that deepens from ~25 m near the coast to ~60 m just west of Stellwagen Bank (Fig. 12c). Except near the coast, the seafloor along this valley is tilted down to the northeast (Fig. 12c, profiles 2-5).
30 On opposite sides of the MBZ are two zones of NE-SW-trending sonar lineaments (SL1 and SL2) that are similar in width and trend, yet are sinistrally offset ~6 km across the MBZ (Fig. 12b). Some of the lineaments are ridges whereas others are linear depressions. SL2 appears to be continuous with a group of NE-SW-trending Paleozoic faults onshore (Fig. 12b). SL1 traverses a partial ring northwest of Stellwagen Bank.
31 Onshore, several NW-SE-trending linear depressions and scarps are along the same trend as the MBZ, although at a slightly more NW-SE trend (Fig. 14a). These lineaments traverse the Roxbury Conglomerate of the Boston Basin and various Late Precambrian to Early Devonian igneous rocks (Fig. 14b). The Essex Street, Birch Pond, and Saugus River lineaments are among the most conspicuous of these lineaments. The Essex Street lineament coincides partly with a northeast-facing scarp that has as much as 35 m of relief (Fig. 14c). The Birch Pond lineament, in contrast, is formed by a ~300-m-wide, 15-m-deep linear depression (Fig. 14c). The Saugus River lineament is defined mainly by linear segments of the Saugus River floodplain (Fig. 14a).
 Display large image of Figure 14
Three Dory Ridge lineament
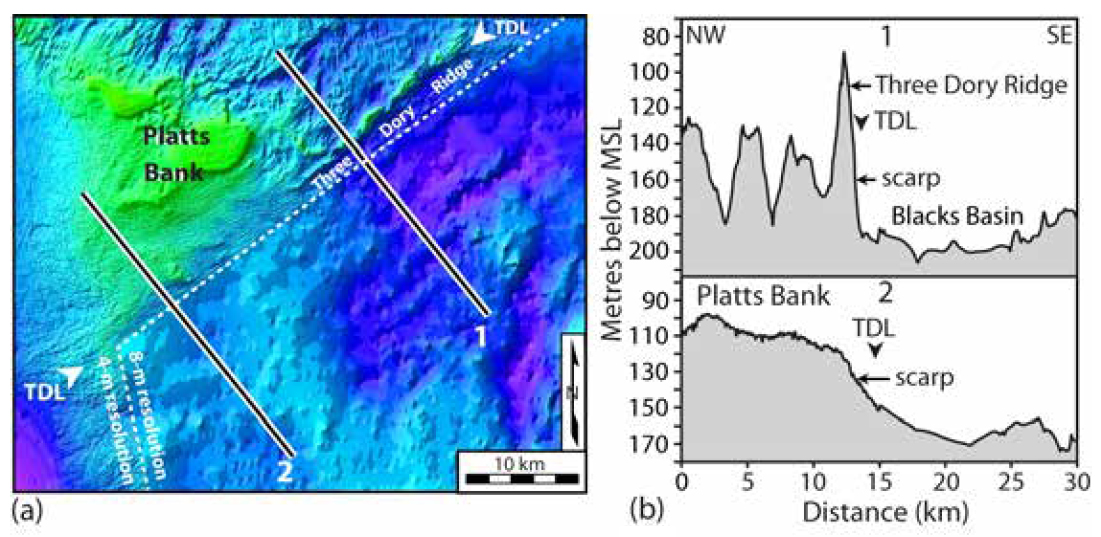
32 Northeast of the epicentral area of the 1755 Cape Ann earthquake is a 35-km-long, NE-SW-trending lineament formed by Three Dory Ridge and a gentle, 30- to 100-m-high, southeast-facing scarp along the southeast side of Platts Bank here named the Three Dory Ridge lineament (Figs. 4 and 15). Several other NE-SW-trending lineaments occur to the southeast (Figs. 5a and 15), although they are topographically more subtle (Fig. 15b). These lineaments coincide with the Gulf of Maine fault zone and Boston Basin (Fig. 3).
 Display large image of Figure 15
Olympus lineament zone
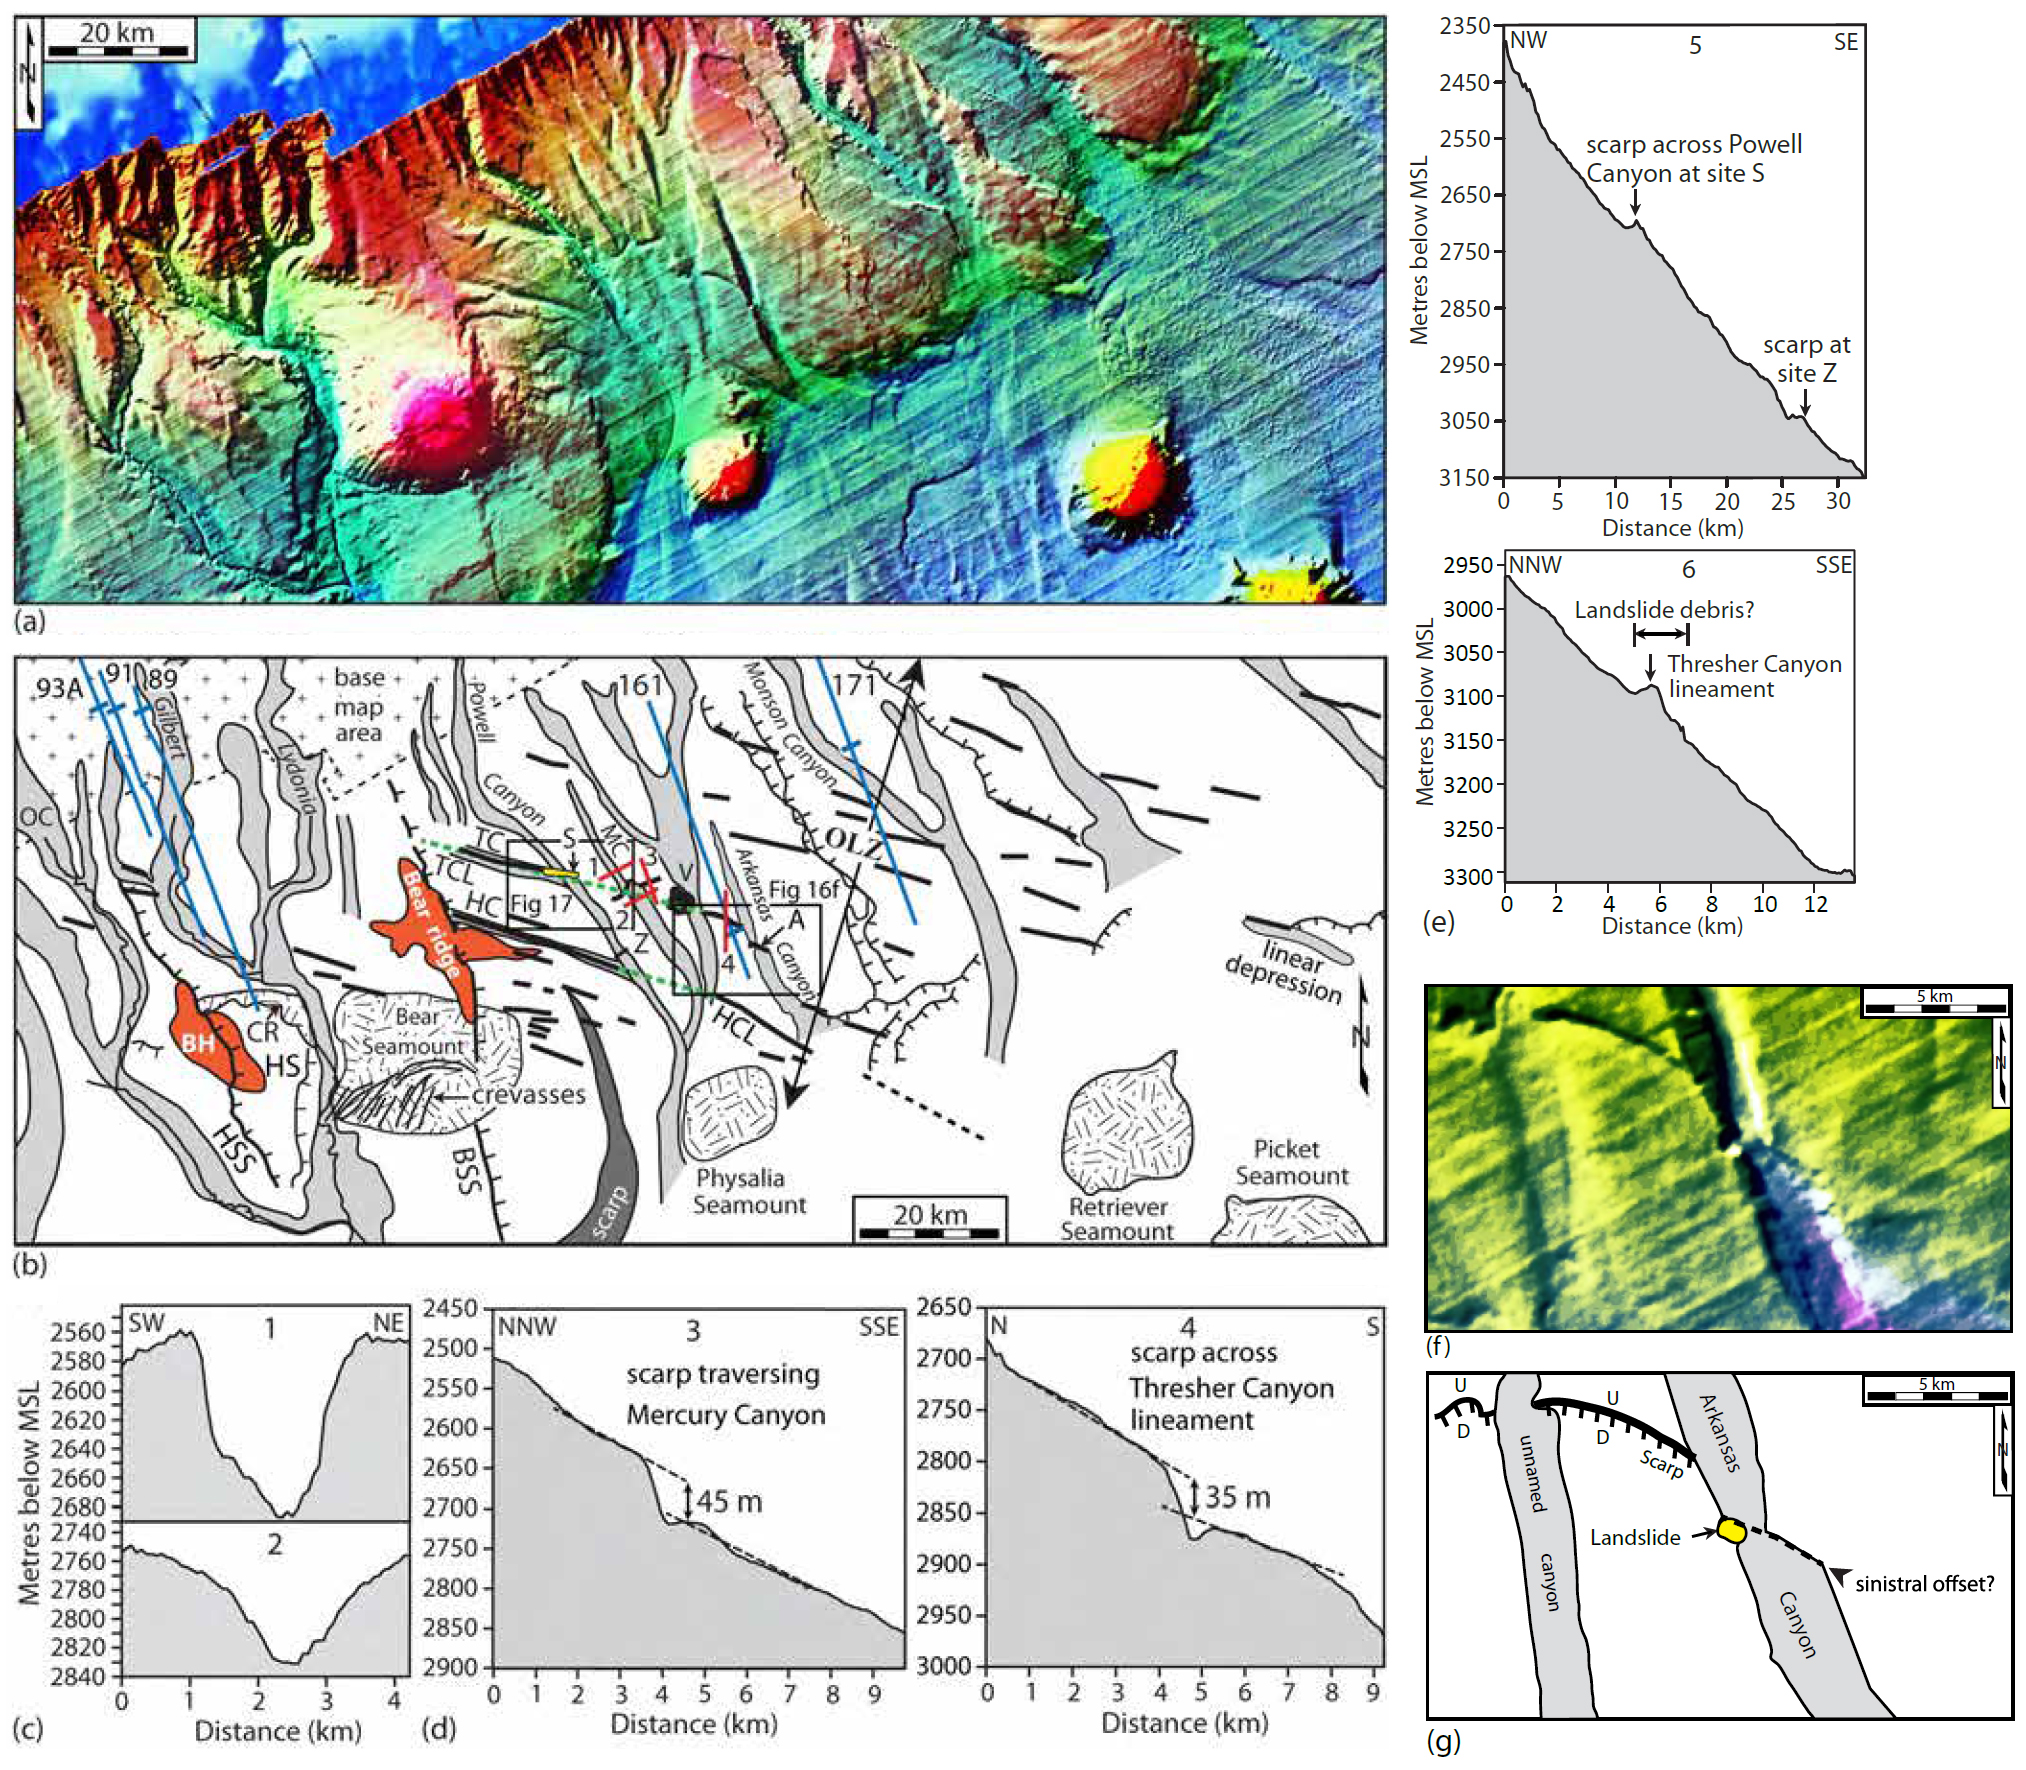
33 Despite their poor 100- to 200-m-resolution, the MBES data along the continental slope and rise northeast of Bear Seamount reveal a ~180-km-long, ~85-km-wide zone of subtle, discontinuous, WNW-ESE-trending bathymetric lineaments of the Olympus lineament zone (OLZ) (Fig. 16). The OLZ is oblique to the trends of nearby fracture zones and traverses a 30-km-wide dextral offset in the ECMA (Fig. 3). The various individual lineaments of the OLZ include relatively short canyons and low-relief, mostly north-facing scarps in the seafloor that crosscut the NW-SE trend of the New England seamounts and the dominant NNWSSE trend of canyons traversing the continental slope (Fig. 16a). Two of the most prominent lineaments coincide with the here-named Thresher and Hammerhead canyons (Fig. 16b). Thresher canyon is 12 km long, 2.2 km wide, and up to 220 m deep. Hammerhead canyon is 22 km long, 1.2 km wide, and up to 70 m deep. Both canyons terminate to the northwest along a NNW-SSE-trending ridge north of Bear Seamount here named Bear ridge (Fig. 16).
 Display large image of Figure 16
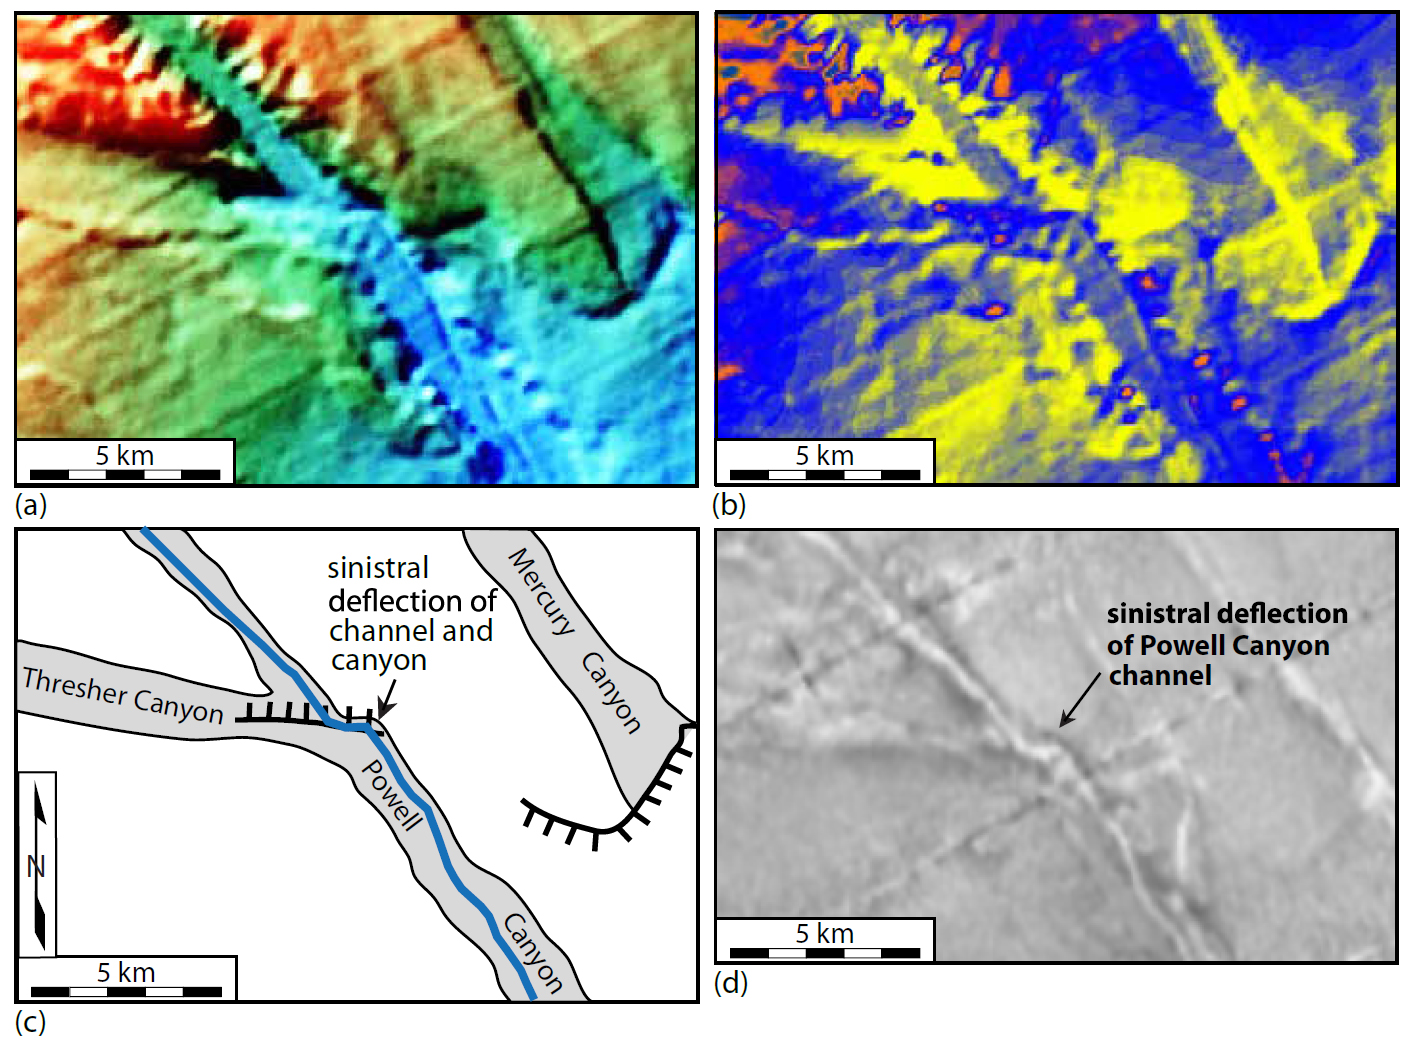
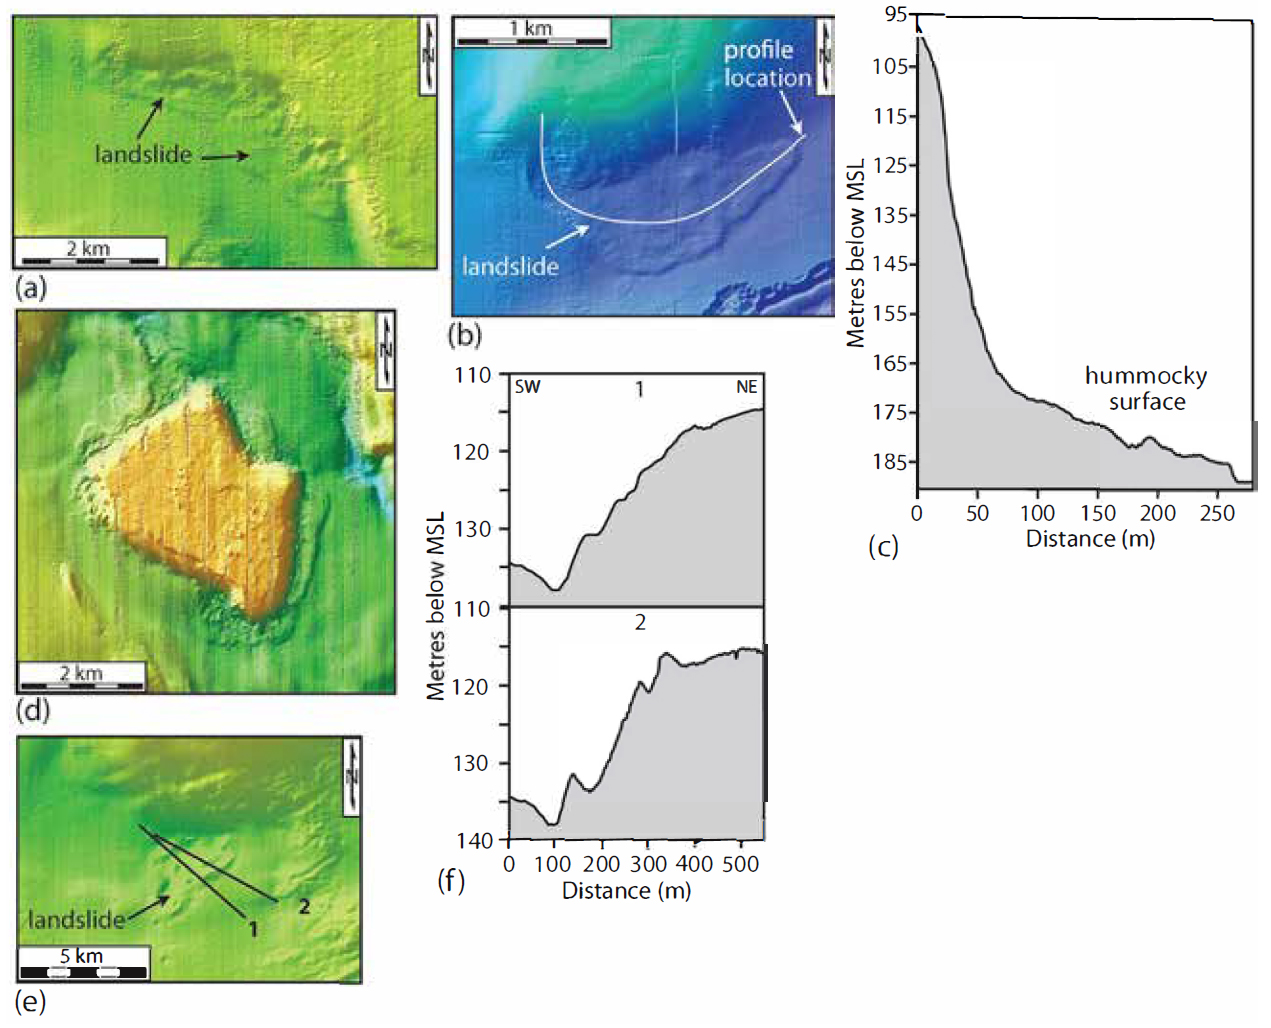
34 A 25-m-high, northwest-facing scarp traverses the floor of Powell Canyon where it converges with Thresher canyon (Figs. 16b, site S and 16e, profile 5). Powell Canyon is sinistrally offset ~1 km at this location (Fig. 17). Approximately 20 km southeast of and aligned with Thresher canyon is an ~8-km-long, 35- to 90-m-high, gently curved, southwest-facing scarp (Figs. 16a and 16d, profile 4). Southeast of this scarp is the NNE-SSW-oriented Arkansas canyon that abruptly widens ~1.2 km to the southeast at site ‘A’ (Figs. 16b and 16f). An ~800-m-wide area along the western wall of the canyon has collapsed in a landslide (Fig. 16f), thus producing a 2-km-long, 30-m-high area in the canyon floor downstream from the landslide (Fig. 16e, profile 6). We have named this alignment of scarps, canyon offsets, and linear depressions the Thresher canyon lineament (Fig. 16b).
 Display large image of Figure 17
35 A 45-m-high, southeast-facing scarp forms a short, NE-SW-oriented, ~8-km-long lineament along the Thresher canyon lineament (Figs. 16b and16d, profile 3). Mercury canyon, is sinistrally offset ~900 m along this scarp (between profiles 1 and 2 of Fig. 16b). Mercury canyon is entrenched ~30 m more upstream from the scarp than that downstream (Fig. 16c, profiles 1 and 2). Southeast of this scarp is a small, 3-km-wide, 85-m-high hill in the seafloor (Fig. 16b) that could be a small seamount.
36 Just north of the convergence between the Hammerhead and Powell canyons is another ~20-m-high, northwest-facing scarp across the Powell Canyon floor at site Z of Figure 16b (Fig. 16e, profile 5). Approximately 12 km southeast of this scarp is a 20-km-long, 45- to 70-m-high, southwest-facing scarp that is aligned with Hammerhead canyon. We have named this 55-km-long alignment of Hammerhead canyon and the two scarps the Hammerhead canyon lineament (Fig. 16b).
Seismic-reflection profiles acquired across the Olympus lineament zone
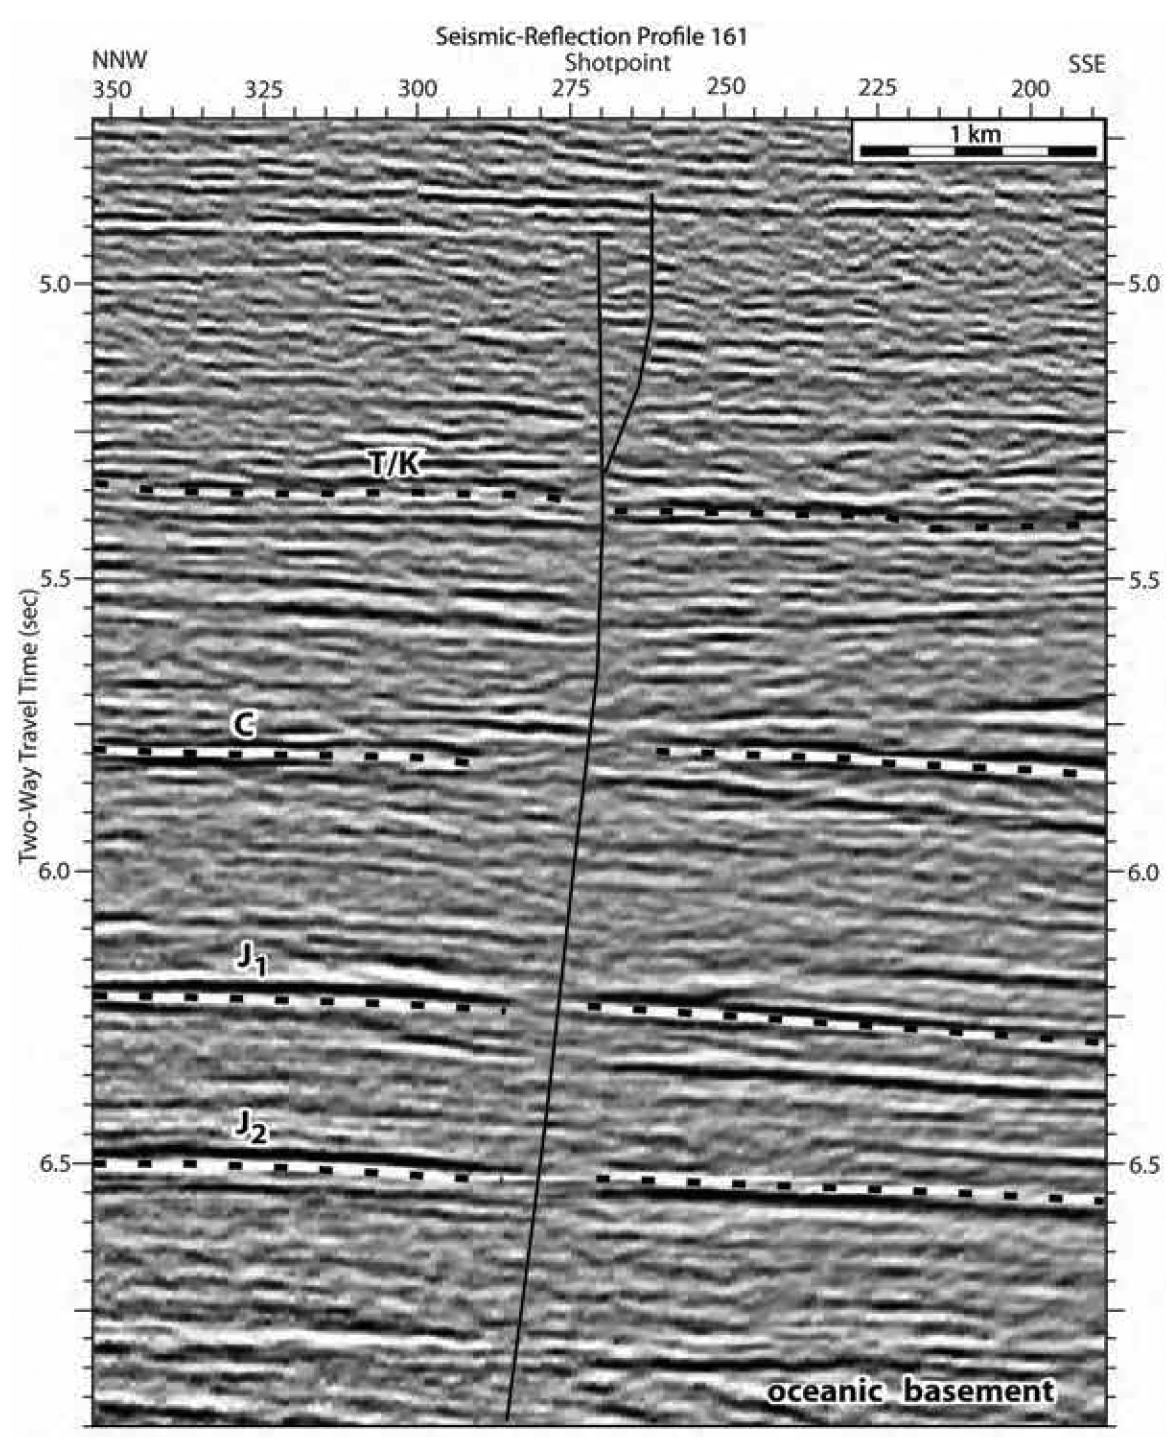
37 Faulting along the OLZ is supported by several seismic-reflection profiles that traverse the zone. Seismic-reflection profile 161 (Fig. 18), for example, shows a near-vertical fault that is aligned with and ~3 km northwest of the abrupt widening of Arkansas canyon along the Thresher canyon lineament (Fig. 16b). This fault is characterized by small vertical displacements of 10–50 ms (TWTT, ~13–63 m) that continue upward through the lower Cenozoic section (Fig. 18). The amount and sense of vertical displacement varies along the fault with some of the larger displacements occurring updip. This fault also coincides with a 0.5-km-wide zone in which the reflectors are weak or absent.
 Display large image of Figure 18
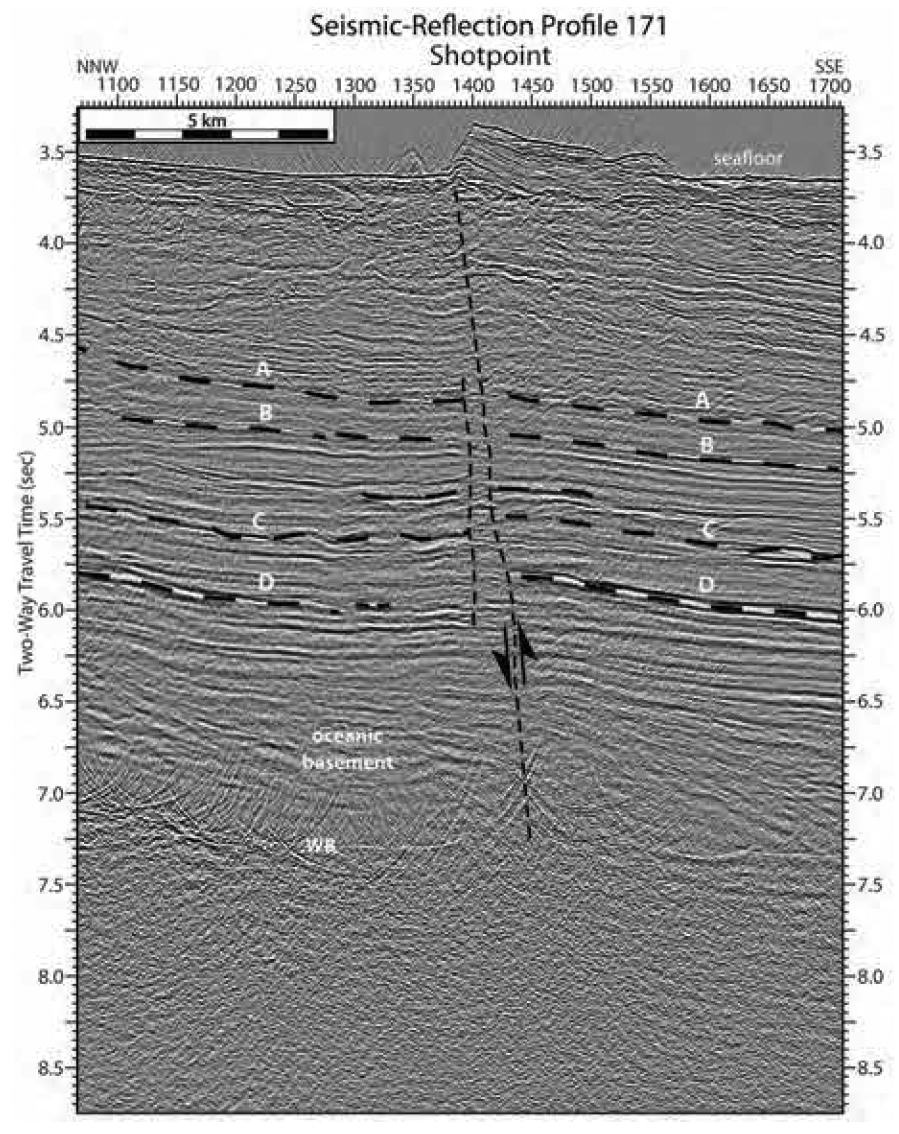
38 Another fault was interpreted near the northern margin of the OLZ along seismic-reflection profile 171 (Fig. 19). This fault dips steeply to the south with displacements decreasing updip (Fig. 19). The arbitrarily selected horizons labeled A-D (ages unknown) on this profile were chosen to highlight the fault. Although the fault occurs beneath a scarp at shotpoint 1500, it is not an artifact from uncorrected elevation statics because the amount of displacement along the fault increases with depth.
 Display large image of Figure 19
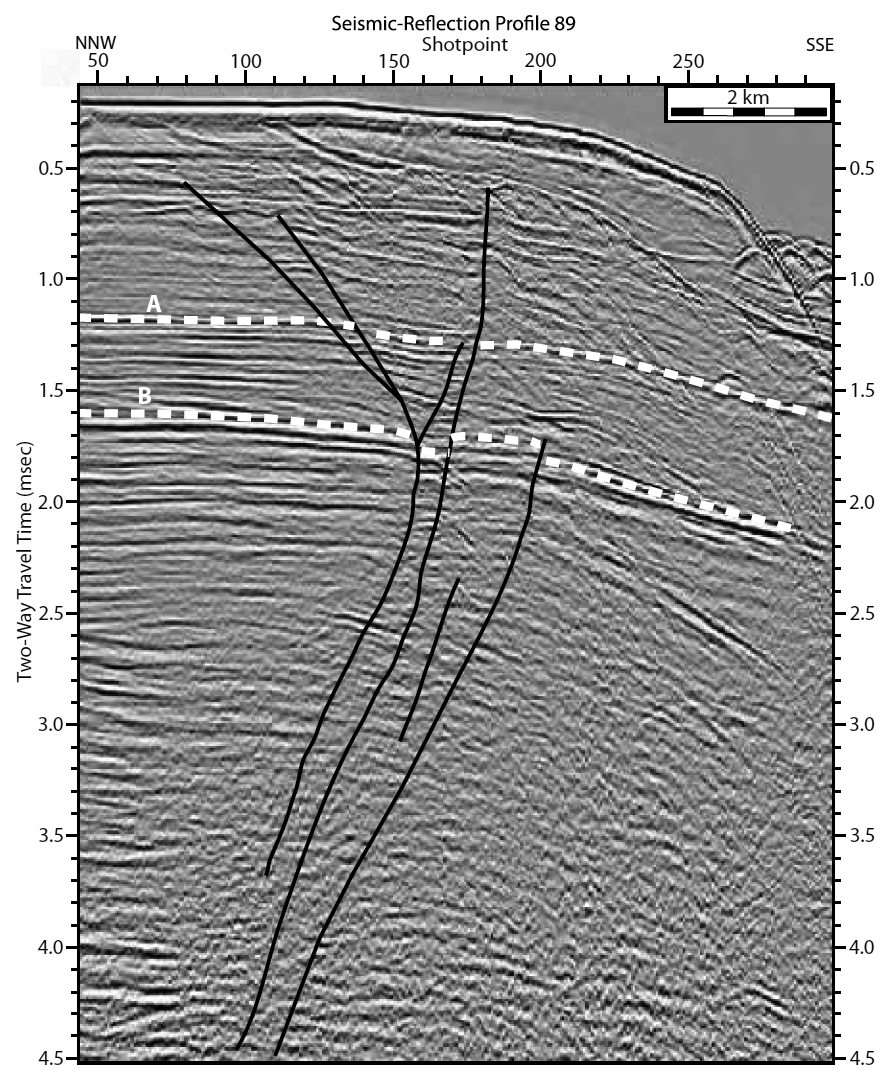
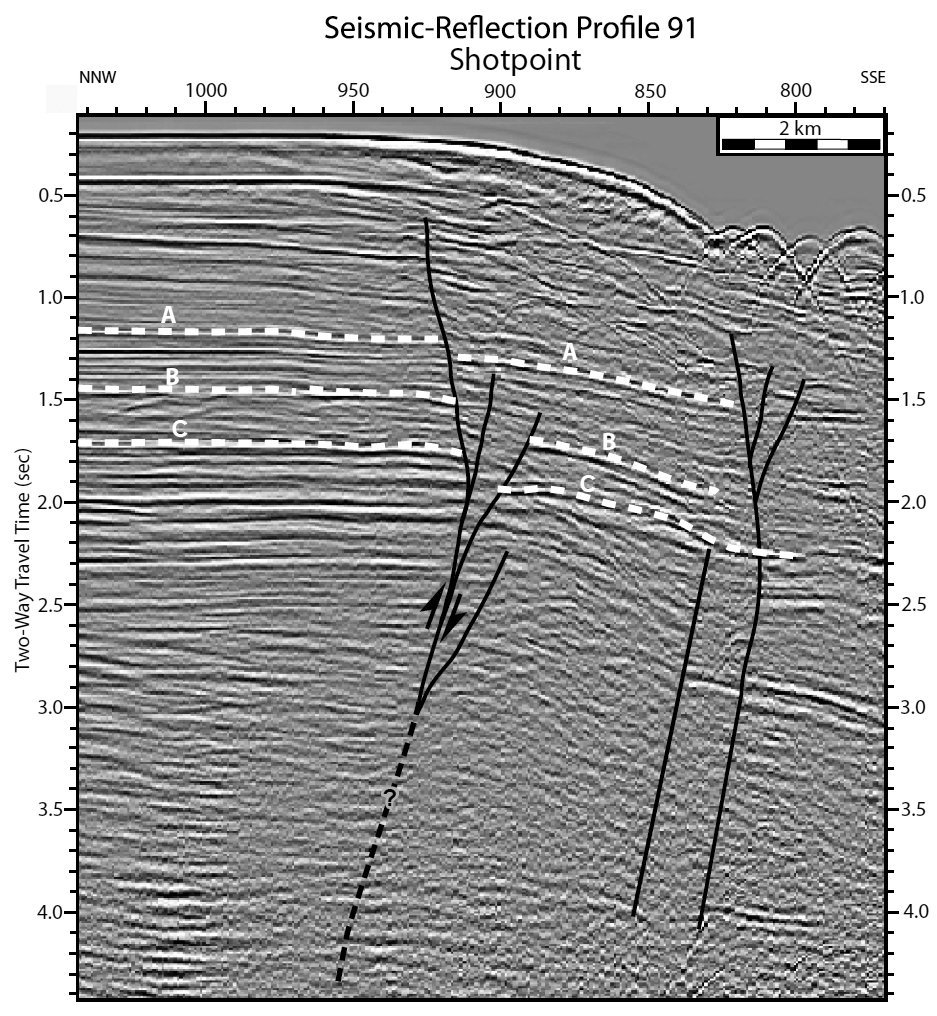
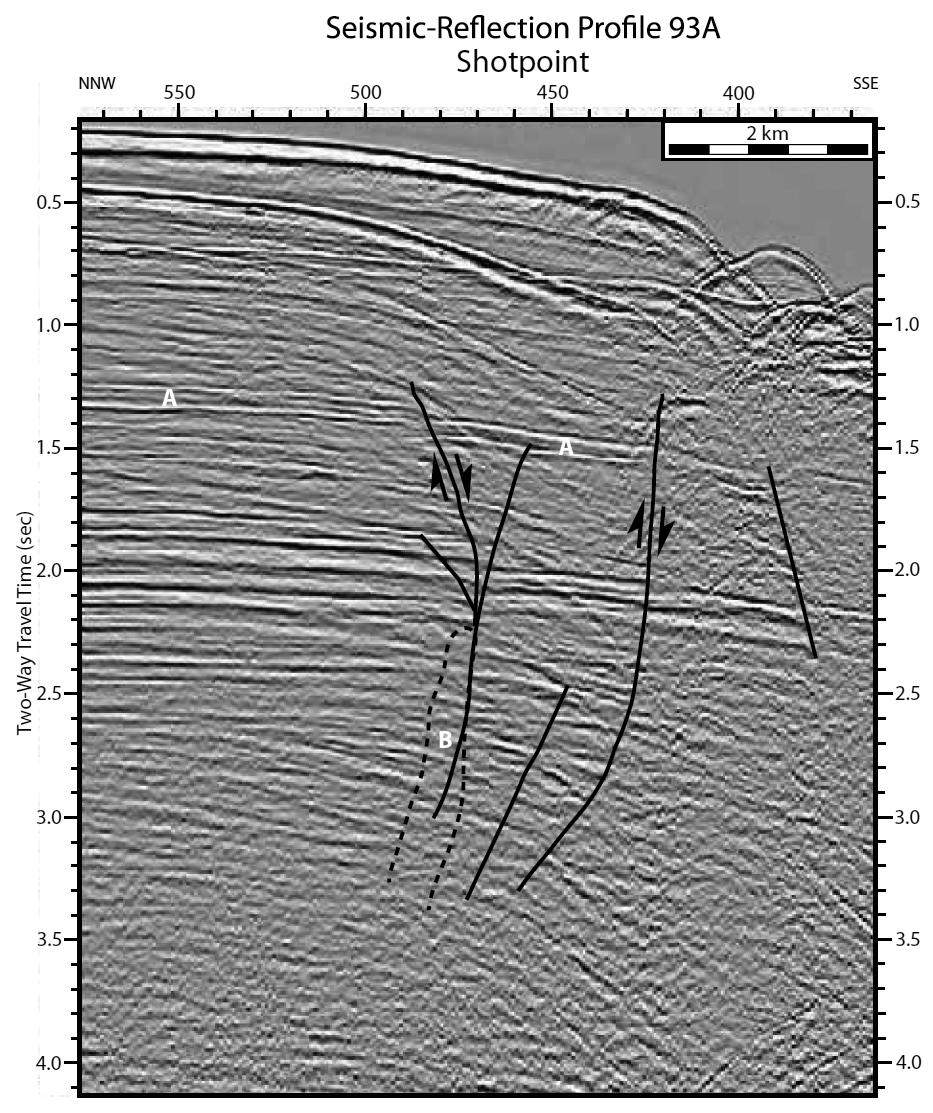
39 Seismic-reflection profiles 89, 91, and 93A traversing the shelf break ~50 km northwest of Bear Seamount show steep, NW-dipping faults with small displacements offseting Cenozoic strata as they splay upward into mostly positive flower structures (Figs. 20–22). Their northwest dips are opposite to the southeast dip expected for growth faults along the shelf edge. The alignment of these three faults along a ~7-km-long east-west trend suggests that they are associated with the same fault. No other faults were identified beneath the shelf edge where the numerous other seismic-reflection profiles traverse the continental margin northeast and southwest of these three faults.
 Display large image of Figure 20
 Display large image of Figure 21
 Display large image of Figure 22
Scarps across the New England seamounts
40 Two NNW-SSE-trending, east-facing scarps traverse the eastern flank of Bear Seamount and an eroded seamount to the west (Herring seamount). Relief on these scarps ranges from 65–70 m for the 55-km-long Herring seamount scarp (fig. 17 of Marple et al. 2018a, profiles 3 and 4) to 70–200 m for the 75-km-long Bear Seamount scarp (fig. 19 of Marple et al. 2018a, profiles 2–3). A 15-km-long, east-facing scarp, here named the Mytilus Seamount scarp (Fig. 1), traverses the area inside the Mytilus ring southeast of Bear Seamount (fig. 21 of Marple et al. 2018a). Marple et al. (2018a) interpreted these three scarps to be fault scarps that were produced by the upward push of ascending magmas along the NEHT during Cretaceous time. Marple et al. (2018a) provides a more detailed description of these scarps.
FURTHER EVIDENCE FOR RING-SHAPED MORPHOLOGICAL FEATURES BETWEEN JEFFREYS LEDGE AND CAPE COD
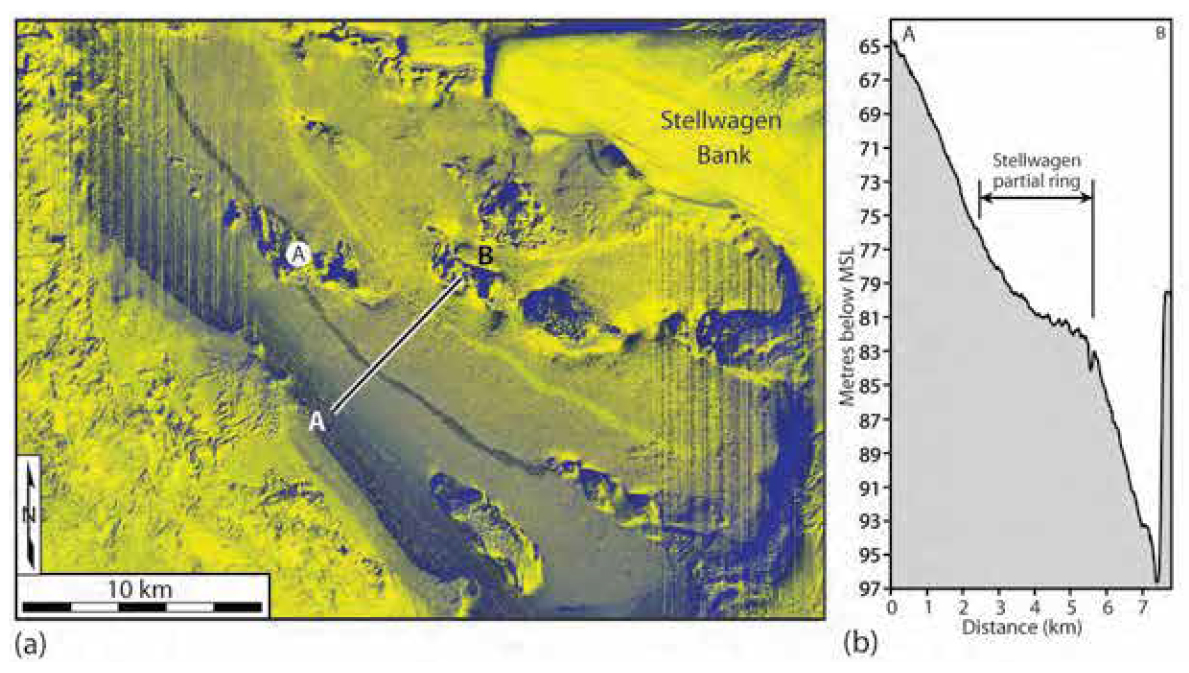
41 An IHS-enhanced MBES image of the area just west of Stellwagen Bank reveals a 3- to 5-km-wide pair of parallel, 32-km-long arc-shaped bands in the seafloor collectively named Stellwagen ring (Fig. 23a). The light-colored band to the north coincides with a steepening in the seafloor to the northeast whereas the darker band appears to be associated with only a subtle steepening of the slope in the seafloor (Fig. 23b). A bathymetric profile across Stellwagen ring shows a distinct decrease in slope between the two bands (Fig. 23b), suggesting that the underlying bedrock is relatively resistant to erosion along this part of the Stellwagen ring. The two bands are aligned with an indentation in the west side of Stellwagen Bank (Fig. 23a).
 Display large image of Figure 23
42 East of Tillies ring is a 75-km-long curved depression, here named Murray ring, the deepest part of which coincides with Murray Basin (Fig. 4). It projects into one of the short curved canyons east of Stellwagen Bank (Fig. 4).
SUBMARINE LANDSLIDES
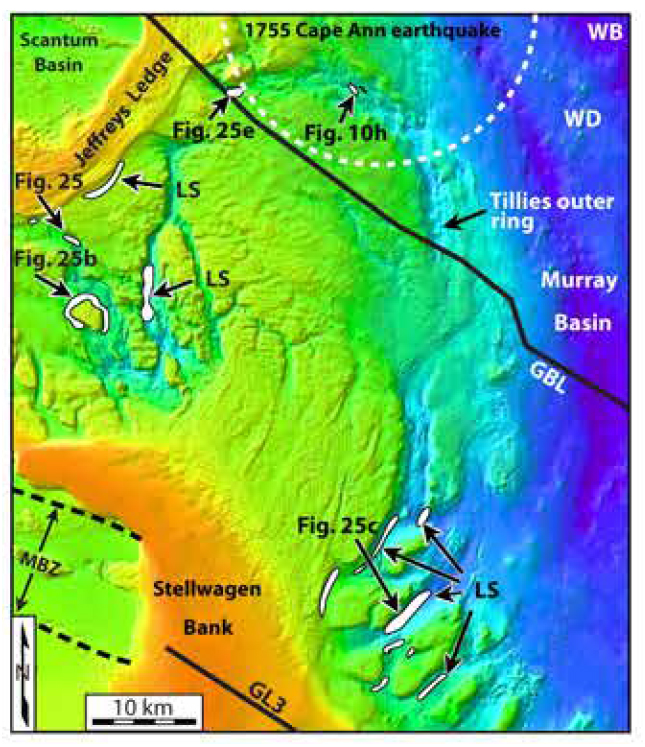
43 Several small submarine landslides are located in the WGOM, three of which are located within the epicentral area of the 1755 Cape Ann earthquake (Figs. 24 and 25). The landslide at the eastern end of a rectilinear depression just east of Jeffreys Ledge (Fig. 25e) is characterized by a hummocky surface (Fig. 25f), which is commonly associated with landslides (e.g., Twichell et al. 2009). The other two landslides occur along the two scarps that traverse the Tillies outer ring (Figs. 10h and 24).
 Display large image of Figure 24
 Display large image of Figure 25
44 Other submarine landslides coincide with submarine cliffs along the submerged valleys that dissect Tillies Bank (Fig. 24). One of these landslides occurs around the perimeter of a submerged hill located southeast of Cape Ann (Fig. 25d). Another set of submarine landslides were identified along the walls of other canyons east-southeast of Boston (Fig. 24). One of these landslides flowed ~250 m northeastward along the valley floor (Fig. 25b). The lower part of this landslide is hummocky like that of the other landslides (Fig. 25c).
Buried chaotic layer beneath the continental slope and rise
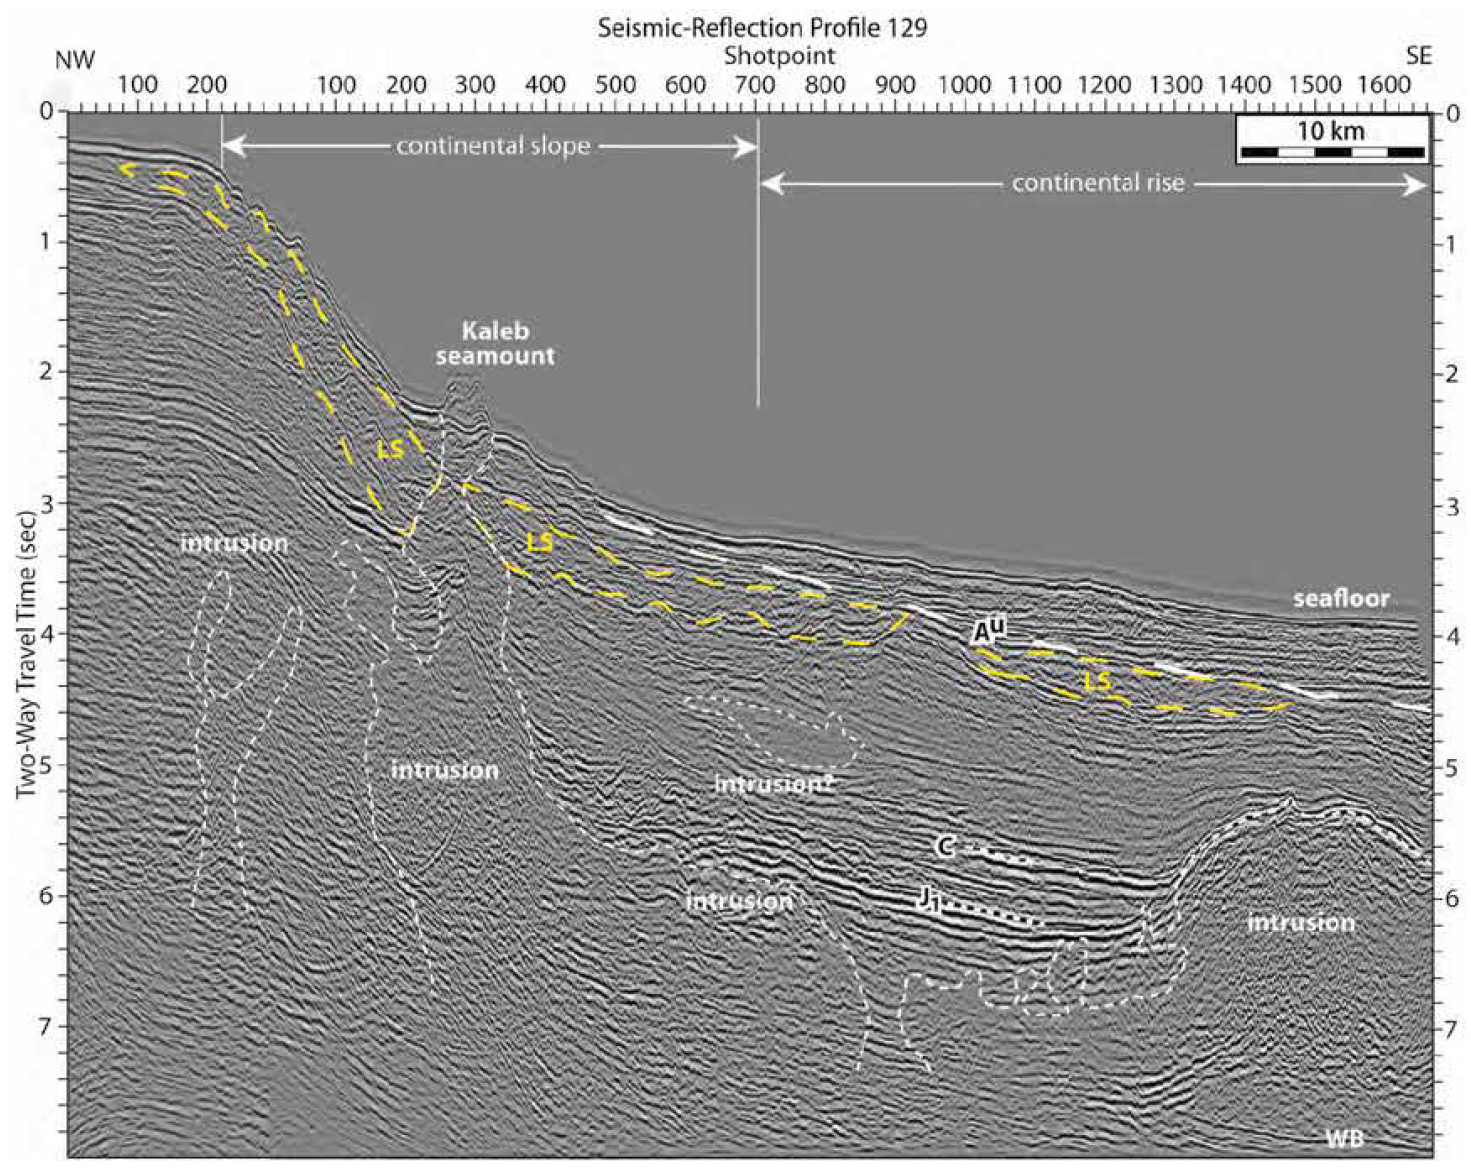
45 Numerous seismic-reflection profiles that traverse the continental margin reveal a buried chaotic-appearing layer beneath the continental slope and upper continental rise west of the OLZ (Fig. 1). Seismic-reflection profile 129 (Fig. 26), for example, shows a 300-ms-thick (two-way-travel time, TWTT, ~375 m), buried chaotic-appearing layer beneath unconformity Au ~50 km west of Bear Seamount (Fig. 26). Marple et al. (2018a) provides a more detailed discussion of this profile.
 Display large image of Figure 26
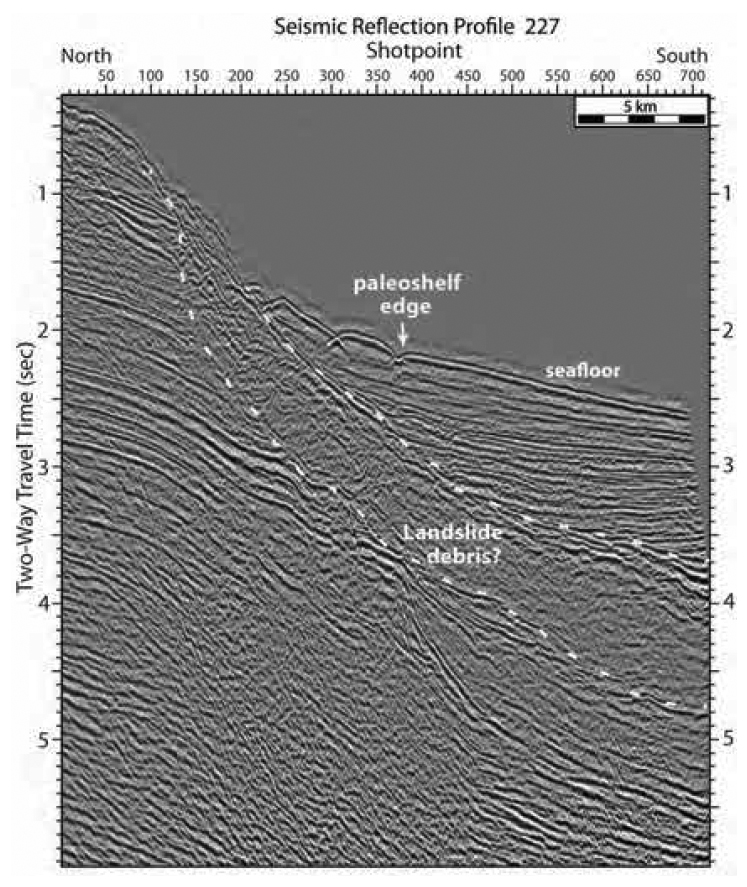
46 Seismic-reflection profile 227, ~150 km west of profile 129, also shows a buried chaotic-appearing layer beneath the continental slope that is up to 800 ms (TWTT, ~1000 m) thick (Fig. 27). We were unable to interpret the ages of the overlying strata on this profile. Numerous other seismic-reflection profiles between profiles 129 and 227 also show this anomalous layer beneath the continental slope and rise.
 Display large image of Figure 27
DISCUSSION
Relationship of NW-SE-oriented linear depressions to faults
47 Several observations suggest that the NW-SE-oriented LiDAR and sonar lineaments onshore and beneath the WGOM (Figs. 1 and 2) are the surface expressions of faults. First, some of the lineaments coincide with gravity lineaments GBL and GL1 (Fig. 2). Secondly, the en échelon pattern of the Tillies zone of linear depressions (Fig. 9) is more easily explained by a fault zone than by glacial scouring alone. Third, the NW-SE-trending lineaments crosscut the NE-SW-trending accreted terranes and are therefore not from differential erosion along lithologic boundaries. Furthermore, most of the lineaments are obliquely oriented relative to the south-southeast direction that the Laurentide ice sheet flowed over the WGOM during Pleistocene time (Fig. 2). We therefore conclude that the NW-SE-oriented lineaments are geomorphic expressions of faults where the fractured bedrock was preferentially eroded by glacial and subaerial processes when the WGOM was periodically exposed above sea level during Cenozoic time.
Relationship of NW-SE-oriented gravity lineaments to faults
48 The crosscutting relationship of the NW-SE-oriented gravity lineaments with the NE-SW-trending accreted terranes and structures (Fig. 2) suggests that they may be related to deep-seated basement faults and that their reactivation has fractured through the overlying cover terranes. For example, the Tillies zone of en échelon linear depressions along the GBL (Fig. 9) is a pattern that is difficult to explain by glacial scouring alone. The coincidence of the Great Bay and Foss Beach depressions with the GBL (Fig. 7) also suggests that the terranes along this part of the GBL have been fractured, thus causing an increase in glacial scouring and subaerial erosion along these parts of the GBL when the area was previously exposed above sea level. If true, the positive gravity anomaly along the GBL could be from basaltic magmas that migrated upward along a basement fault beneath the accreted terranes.
Origin of the Poseidon lineament offshore from southern Maine
49 The Poseidon lineament is interpreted to be a fault, rather than a lithologic boundary, based on the following observations. First, two partial rings appear to be truncated by the lineament (Fig. 4a). Secondly, the lineament near this area consists of en échelon segments, which is more easily explained by a fault than by a lithologic boundary. If it is a fault, its parallelism with the Norumbega fault system (NSF) onshore (Fig. 4) suggests that it could be a southwest extension of the NFS. This hypothesis is further supported by the alignment of the NE-SW-trending sonar lineaments southwest of the Biddeford Pool depression with those to the north in the Casco Bay area, some of which coincide with known faults, such as the Broad Cove fault (Fig. 5a). Further studies are needed though to confirm this hypothesis.
Origin of the Isles of Shoals lineament zone (ISLZ)
50 The ISLZ likely shares the same tectonic history as the CNF along its southern border (Fig. 6), the latest of which was normal style dip-slip motion during the early Mesozoic era and dextral deformation during the Alleghanian orogeny (Wintsch et al. 2014). In contrast, the Poseidon lineament and other NNE-SSW-trending lineaments offshore from southern Maine appear to be older than the ISLZ since they are truncated to the southwest by the ISLZ. This crosscutting relationship suggests that the fault zone associated with the ISLZ overthrust the deeper roots of the faults associated with the Poseidon lineament and other NNE-SSW-trending lineaments just offshore from southern Maine and southeastern New Hampshire during the Alleghanian orogeny.
Origin of the Massachusetts Bay zone
51 The 50-km-long Massachusetts Bay zone (MBZ) east of Boston (Fig. 12) displays several characteristics that collectively suggest that it is a fault zone rooted in the basement and that its reactivation has fractured through the overlying Boston Basin and Cape Ann plutonic suite. First, the MBZ traverses the NE-SW-trending terranes at a high angle (Fig. 3). Secondly, the scarps in the seafloor just east of Boston (Fig. 13) are most easily explained by north-side-up displacements. Third, the nearby zone of low-lying ridges that traverse the Boston Basin (Fig. 12) is best explained by fracturing along a 10-km-wide fault zone. Finally, the alignment of the NW-SE-trending lineaments in northern Boston with the MBZ (Fig. 14) suggests that the interpreted fault zone continues at least 10 km onshore. Faulting along the MBZ postdated the Alleghanian orogeny during the Permian when the Avalonian cover rocks docked with Laurentia (Wintsch et al. 2014). The two scarps just offshore from Boston (Fig. 13) could indicate late Pleistocene or Holocene displacements if they offset the seafloor sediments.
52 The orientation of the MBZ relative to SHmax (Fig. 28a) presently favors sinistral displacement along this zone. This sense of motion favors the development of the local depressions at the step-overs between the left-stepping ridges near the southeastern end of the MBZ (Fig. 12). This hypothesis is supported by studies of fractures in the eastern United States (e.g., Faure et al. 1996; Rocher and Tremblay 2001), which suggest that the present orientation of SHmax has existed since Cretaceous–early Paleogene time. Cenozoic sinistral displacements along the MBZ may also explain the sinistral offset of the two lineament zones SL1 and SL2 across the MBZ (Fig. 12b).
 Display large image of Figure 28
53 We postulate that the MBZ continues at least 50 km farther to the southeast along gravity lineament GL3 in Figure 2. The lineament formed by connecting the MBZ with GL3 forms a 12° clockwise bend at Stellwagen Bank (Fig. 28a). This bend may be a restraining fault bend based on its orientation relative to SHmax (Fig. 28a).
Origin of the Biddeford Pool scarp and depression
54 One mechanism that we considered for the origin of the Biddeford Pool scarp and depression is glacial scouring. However, glacial ice flow indicators onshore (Tolman 2006, 2007) show that the direction of Pleistocene ice flow was generally NNW-SSE, which is oblique to the NW-SE trend of these features. Thus, the Biddeford Pool scarp and depression cannot be explained by glacial scouring alone.
55 The alignment of the Biddeford Pool scarp and depression with the NW-SE-oriented strikes of bedding and foliation onshore (Fig. 5c), the NW-SE-trending Wilkinson Basin and gravity lineament GL1 (Fig. 4), and the NW-SE-trending Platts scarp (Fig. 5a) suggests that these features are associated with a broad, NW-SE-oriented zone of weakness. Other features supporting the existence of this broad zone of weakness include the NW-SE-oriented Biddeford pluton and Audrinas ring (Fig. 5a). We postulate that the intrusion associated with Audrinas ring and the Biddeford pluton migrated upward along NW-SE-oriented fractures or faults. The Fortunes Rock lineament and other shorter NWSE-trending linear depressions southwest of Biddeford Pool scarp (Fig. 5d) further support our hypothesis that this is a zone of weakness.
56 Hussey et al. (2016) suggested that the local NW-SE-oriented strikes of bedding and foliation of the Merrimack terrane, the NW-SE-orientation of the Biddeford pluton, and the absence of the Falmouth-Brunswick-Casco Bay volcanic arc to the southwest are associated with dextral deformation along a Devonian transform fault. Kuiper (2016) and Kuiper and Wakabayashi (2018) postulated that this transform fault is associated with a Norumbega triple junction south of Cape Cod, like that associated with the Mendocino Fracture Zone offshore from northern California (e.g., Leitner et al. 1998). They based their model primarily on a NNW-SSE-oriented cluster of seismicity offshore from southern Maine (Ebel et al. 2008), trends of NFS splays in the Casco Bay area (Swanson 1999), and an offshore NWSE-trending aeromagnetic lineament interpreted by Bothner and Hussey (1999). However, the more recent aeromagnetic and gravity anomaly maps of Daniels and Snyder (2004) show no evidence for a major, NW-SE-trending gravity or magnetic anomaly south of the Biddeford pluton. Their model also assumes that the NFS abruptly ended along the Nonesuch River fault northwest of the Biddeford pluton. However, the Nonesuch River fault continues to the southwest across southern Maine and New Hampshire (Fig. 4). Furthermore, none of the NE-SW-trending sonar lineaments offshore from southern Maine are offset along their proposed transform fault (e.g., Poseidon lineament, Figs. 4 and 5).
57 The only evidence for a prominent NW-SE-trending structure offshore from southern Maine are the Biddeford Pool scarp and depression (Fig. 5), the NW-SE-oriented Biddeford pluton, the NW-SE-oriented strikes of bedding and foliation northeast of the Biddeford pluton (Fig. 5c), and the NW-SE-trending gravity lineament GL1 (Fig. 4a). It is unlikely though that these features represent a Devonian transform fault associated with a triple junction, like that proposed by Kuiper (2016), for the following reasons. First, the ~90° angle between the NW-SE-trending features near Biddeford and the NFS (Fig. 5) is too steep to have accommodated the deformation between the NFS and such a transform fault. The angle between the San Andreas fault and the Mendocino Fracture Zone, for example, is at an angle of ~125° (e.g., Leitner et al. 1998). Secondly, the lineaments northeast of the Biddeford Pool depression intersect the NW-SE-trending features near Biddeford at ~90°, which is again too steep an angle. Alternatively, we propose that a Devonian indenter southwest of Casco Bay caused northwest directed thrusting of the Merrimack terrane over the ductile roots of the NFS southeast of the Nonesuch River fault and southwest of Casco Bay in southern Maine. The Biddeford Pool scarp and the NW-SE-oriented foliation and bedding onshore represent the northeastern edge of the proposed indenter where dextral deformation occurred. The geometry of curvilinear lineaments on opposite sides of the Biddeford Pool depression (dashed contours in Fig. 5d) supports our hypothesis that dextral deformation occurred along this area. The western limit of thrusting likely occurred southeast of the Nonesuch River fault based on its NE-SW continuity northwest of the Biddeford area (Fig. 4a). One possible candidate for this boundary is the Calef fault southeast of the Nonesuch River fault (Fig. 4). Later reactivation of the Norumbega’s ductile roots at depth fractured through the overlying Merrimack terrane to produce the numerous, NE-SW-trending lineaments southwest of Casco Bay, such as the Poseidon lineament offshore and the Biddeford scarp, which some investigators have interpreted to be part of the South Portland fault of the NFS (e.g., Osberg et al. 1985).
Origin of the Three Dory Ridge lineament
58 The coincidence of the Three Dory Ridge lineament with the Gulf of Maine fault zone (GMFZ) (Fig. 3) suggests that it is a surface expression of the GMFZ. If true, its orientation relative to SHmax currently favors dextral displacement with a small component of reverse motion (Fig. 28a). However, this lineament cannot be traced southwest across the NEHT (Fig. 1), suggesting that the igneous intrusions along the NEHT obliterated or thermally altered the fault associated with the lineament and any other NE-SW-trending pre-Cretaceous faults that once may have traversed the NEHT.
Cause of the 1755 Cape Ann, Massachusetts, earthquake
59 Several observations suggest that the NW-SE-trending bathymetric lineaments within the epicentral area of the Cape Ann earthquake (Figs. 10 and 11) are associated with active faults. Despite their 3- to 5-km-size location error, the small earthquakes that have occurred in the epicentral area indicate that displacements are occurring on faults in the epicentral area. Furthermore, the landslides along the Pol-lock and Mako scarps (Fig. 10) suggest that the scarps and low-lying ridges along their crests formed within Pleistocene and Holocene sediments, rather than bedrock. This hypothesis is supported by the iceberg scours that cut through Pollock ridge (Fig. 10c). Thus, Pollock ridge and the depression at the base of the Pollock scarp (Figs. 10e and 10f) may represent a flexure produced by compressional deformation along a northwest-dipping reverse or thrust fault. Such local uplift above the hanging wall of reverse and thrust faults are common. For example, the Merrimack ridge along the southwest side of the southwest-dipping Newburyport thrust fault in northeastern Massachusetts appears to be from uplift above the hanging wall of this fault (Marple et al. 2018b). Furthermore, the intersection of the Pollock and Mako lineaments likely represents a fault intersection where additional stress is accumulating, which is supported by previous studies of fault intersections (e.g., Talwani 1988). Thus, the Cape Ann earthquake likely occurred on the fault associated with the Pollock lineament. The 18-m height of the Pollock scarp (Fig. 10f) suggests that multiple earthquakes may have occurred along this lineament.
60 The few earthquakes located near the Mako zone of rectilinear depressions suggests that it may also be active (Fig. 2). However, the individual structures within this zone are less than 5 km long. Thus, it is less likely that the Cape Ann earthquake occurred on any of these structures. Furthermore, the 1-km-long Mako scarp is too short to have produced the 1755 earthquake.
61 The Tillies zone of linear depressions along the GBL (Fig. 9) is also a potentially active fault zone since a few small earthquakes have occurred near this zone (Fig 2). Because the Tillies zone crosscuts the area inside the Tillies outer ring (Fig. 9), it likely postdates the Cretaceous, NEHT-related igneous intrusions that underlie this area.
62 Although the epicentral area of the Cape Ann earthquake lies along the southwest projection of the Gulf of Maine fault zone and the Three Dory Ridge lineament, no NE-SW-trending sonar lineaments traverse the epicentral area. These observations suggest that the Cretaceous igneous intrusions associated with the NEHT obliterated any NE-SW-oriented pre-Cretaceous faults that may have once traversed this area.
63 The Plum Island magnetic lineament also traverses the epicentral area of the Cape Ann earthquake. However, no sonar lineaments or patterns of seismicity occur along this lineament. Furthermore, this magnetic lineament parallels SHmax across the epicentral area (Fig. 1), which does not favor displacement along the fault associated with this lineament. Thus, if the Plum Island magnetic lineament is fault-related, it does not appear to be active.
Significance of the submarine landslides
64 The proximity of the landslides in the WGOM to the Massachusetts Bay zone, the GBL, and the lineaments and rectilinear depressions within the epicentral area of the Cape Ann earthquake (Fig. 24) suggests that they may have been triggered by large earthquakes that occurred on one or more faults associated with these lineaments. Any such earthquakes would have occurred since late Pleistocene time. Otherwise, the Laurentide ice sheet would have destroyed the landslides.
65 The 200-km-wide, buried chaotic-appearing layer beneath the continental slope west of Bear Seamount (Figs. 26 and 27) is interpreted to be a large buried landslide based on the irregular topography at the base of this layer and its chaotic internal appearance. Its burial beneath the Paleocene unconformity Au indicates that it was triggered by a large pre-Paleocene earthquake (Fig. 26). Although we considered other possible explanations for the origin of this layer, its chaotic nature and appreciable thickness makes it difficult to explain by other processes. One candidate for the source of this earthquake is the OLZ to the east (Fig. 28b).
Relationship between the NW-SE-trending lineaments and the NEHT
66 The origin of the various interpreted faults along the NWSE-trending sonar and gravity lineaments can be explained by different mechanisms (Fig. 1). Some of them could be associated with basement faults rooted beneath the accreted terranes. This hypothesis is supported by their nearly perpendicular orientation relative to the Avalonian and Ganderian zones (Figs. 2 and 3). Another possible cause of some of these lineaments is that they may represent faults that were produced by the upward push of rising magmas along the NEHT during Cretaceous time (Marple et al. 2018a). A third possible origin for some of these lineaments is that they may have formed along the margins of igneous intrusions or along ring fractures associated with igneous intrusions at depth. Previous studies of seismicity near plutons (e.g., Stevenson et al. 2006) suggest that the edges of plutons are areas of weakness. For example, the coincidence of the Pollock lineament with the arc-shaped depression north of Tillies ring (Fig. 10b) suggests that the lineament formed along an igneous ring dike or ring fracture. The Mako zone of rectilinear depressions (Fig. 10b) is also likely related to fracturing along a zone of weakness associated with the Til-lies outer ring.
Further evidence for ring-shaped morphological features between Jeffreys Ledge and Nantucket Shoals
67 The MBES data east of Massachusetts have revealed more ring-shaped morphological features that further suggest that this area is underlain by a large area of igneous intrusions at depth. The Stellwagen ring (Fig. 23), for example, is likely the surface expression of an eroded, igneous-related ring dike or ring fracture. The arc-shaped Murray ring (Figs. 2 and 4) is interpreted to be from increased erosion along a large partial ring fracture or ring dike that is more erodible than the surrounding country rocks. Examples of increased erosion along mafic ring dikes exist in the White Mountain magma series, such as the diorite ring dikes of the Pawtuckaway ring dike complex that form lowlands between the more felsic, ridge-forming monzonite and syenite ring dikes (Eby 1995) (fig. 6d of Marple et al. 2018a). Lastly, we postulate that the area of higher seafloor between Stellwagen Bank and Nantucket Shoals (Fig. 1), like the Tillies Platform east of Cape Ann, may be associated with igneous intrusions at depth that produced uplift along the NEHT during Cretaceous time.
Origin of the Olympus lineament zone (OLZ)
68 The 180-km-long OLZ is another feature that shows evidence for late Quaternary faulting, including scarps in the seafloor (Fig. 16), sinistrally offset canyons (Fig. 17), and displaced Tertiary strata that we interpreted from seismic-reflection profiles (Figs. 18–22). The interpreted flower structures on seismic-reflection profiles 89, 91, and 93A (Figs. 20–22), the 1- to 1.2-km-wide sinistral offsets of the Thresher and Arkansas canyons (Fig. 17), and the change in the up-section amount and sense of displacement of strata on seismic-reflection profile 161 (Fig. 18) suggests that the OLZ is a sinistral strike-slip fault zone that cuts across the continental margin (Fig. 28b). The principle displacement zone of the OLZ is likely along the Thresher canyon lineament because of its central location in the OLZ and sinistrally offset canyons along the lineament (Fig. 17). The 1.2-km-size sinistral offset of Powell Canyon along the Thresher canyon lineament (Fig. 17) indicates that at least 1.2 km of sinistral displacement has occurred along this lineament since Late Cretaceous or early Tertiary time when ENE-WSW-directed compression began in the northeastern United States (e.g., Faure et al. 1996; Rocher and Tremblay 2001), which favors sinistral displacement along the OLZ.
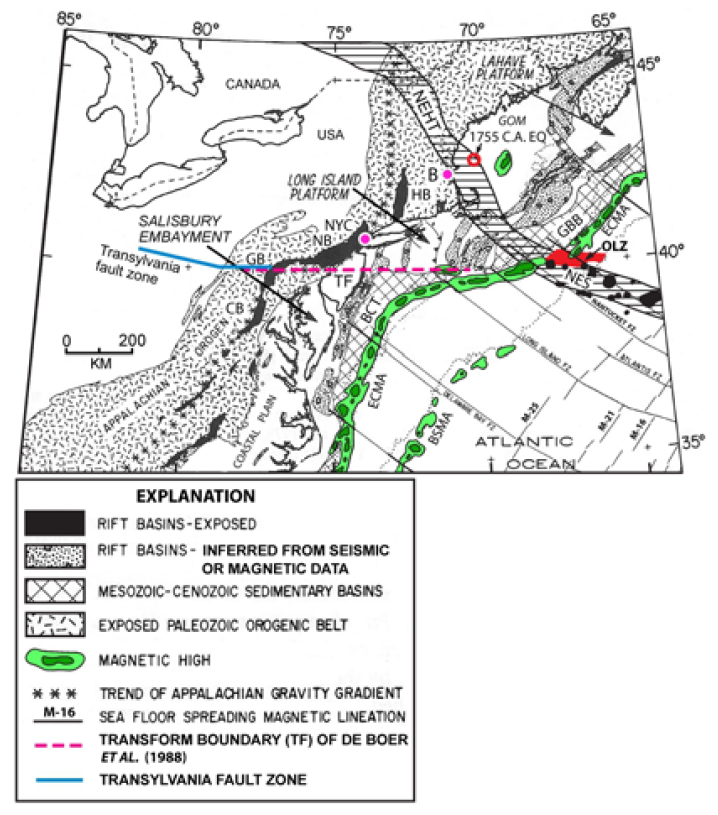
69 Sinistral displacement along the OLZ is opposite to the dextral offset of the ECMA. De Boer et al. (1988) postulated that the dextral offset was produced by sinistral shearing along the N40°-Kelvin lineament during Late Triassic–Early Jurassic rifting. This scenario is unlikely though because the OLZ is oblique to the nearby oceanic fracture zones (Fig. 3). Furthermore, the OLZ cuts laterally through at least 100 km of oceanic crust, which suggests that it formed long after rifting began. Alternatively, the dextral offset could have formed during the collision of northwest Africa with Laurentia during the Alleghanian orogeny. This hypothesis is supported by the alignment of the OLZ with the Transylvania fault, the transform fault of de Boer et al. (1988), and the apparent dextral offset of the Gettysburg and Newark Triassic basins along this trend (Fig. 29). If true, Late Cretaceous or younger reactivation of the interpreted fault zone beneath the continental shelf propagated eastward across the continental margin and through the oceanic crust to produce the OLZ.
 Display large image of Figure 29
70 Based on the evidence for late Quaternary deformation along the OLZ, further studies should be carried out to determine its true extent and if it is capable of producing large destructive earthquakes. Large submarine earthquakes have occurred in the north Atlantic Ocean, including the ~M 8.5 1755 Lisbon, Portugal, earthquake (e.g., Mendez-Victor et al. 2010) and the ~M 7.2 1929 Grand Banks earthquake off the southern coast of Newfoundland (e.g., Fine et al. 2004).
Generalized tectonic model
71 Figures 28a and 28b are generalized tectonic models for the WGOM and continental margin showing the displacement styles currently favored along the various interpreted fault zones based on their orientation relative to SHmax. Sinistral displacement is favored along NW-SE-trending faults whereas dextral displacement is favored along NE-SW-trending faults (Fig. 28). Reverse-style displacement, in contrast, is favored along NNW-SSE-trending faults (Fig. 28). The dip direction of the fault associated with the west-facing Pollock scarp (e.g., Fig. 10e) is interpreted to be eastward based on our interpretation that it is associated with a reverse or thrust fault (Fig. 10). The dips of the other interpret ed NNW-SSE-oriented faults along the Jeffreys, East Tillies, and Stellwagen lineaments (Fig. 28), however, are unknown since no scarps were observed along them. The OLZ is interpreted to be the surface expression of a sinistral strike-slip fault zone with the principal displacement zone along the Thresher canyon lineament (Fig. 28b). The near parallelism between SHmax and the ENE-WSW-oriented lineaments and faults, such as the ISZL, CNF, and the Plum Island magnetic lineament (Fig. 28), does not favor their reactivation.
CONCLUSIONS
72 The WGOM between Jeffreys Ledge and Cape Cod, Massachusetts, appears to be underlain by a large Cretaceous igneous complex associated with the NEHT. Although pre-Cretaceous structures trend NE-SW across the WGOM, no NE-SW-trending sonar lineaments exist along the NEHT between Jeffreys Ledge and Cape Cod. This observation suggests that most of the pre-Cretaceous faults that previously traversed this area were obliterated or altered by the NEHT-related igneous intrusions during Cretaceous time. Thus, the faults associated with the NW-SE-oriented lineaments likely formed either during the emplacement of the igneous intrusions, by reactivation of basement faults beneath the accreted terranes (e.g., GBL), or by fracturing along ring dikes or ring fractures (e.g., Pollock lineament). The interpreted basement fault along the GBL apparently acted as a conduit for magmas to rise through the crust as the New England hotspot passed beneath the WGOM during Cretaceous time.
73 The origin of the interpreted NW-SE-trending zone of weakness associated with the Biddeford Pool scarp and depression and the NW-SE-oriented strikes of bedding and foliation of the Merrimack terrane near Biddeford, Maine, is unknown and needs further study. Its location where the southwest continuation of the Norumbega fault system (NFS) becomes controversial suggests that it could be related to the same mechanism that produced the apparent termination of the NFS southwest of Casco Bay, Maine. We propose that a Devonian indenter southwest of Casco Bay caused thrusting of the Merrimack terrane over part of the Norumbega’s ductile roots southeast of the Nonesuch River Fault. The northeastern edge of this indenter was located approximately along the Biddeford Pool depression where it produced dextral deformation. Later reactivation of the Norumbega’s ductile roots fractured through the overlying Merrimack terrane to produce the NE-SW-trending LiDAR and sonar lineaments southwest of the Biddeford area.
74 The 1755 Cape Ann earthquake most likely occurred along the fault associated with the Pollock lineament northeast of Cape Ann based on evidence for Pleistocene and Holocene deformation along this lineament. Submarine landslides and low level seismicity in the WGOM suggests that large earthquakes may have occurred along some of the faults beneath the WGOM since the last ice age. The GBL, Massachusetts Bay zone, and OLZ are interpreted large fault zones offshore from New England that may be capable of producing large earthquakes and should, therefore, be investigated further. The OLZ is especially concerning be cause of its length, sinistrally displaced submarine canyons along the Thresher canyon lineament, and its proximity to the buried, 200-km-wide, pre-Paleocene landslide beneath the continental slope west of the OLZ.
We thank reviewer Randy Cox, who originally reviewed this manuscript for Northeastern Geoscience, and an anonymous reviewer for their many constructive comments. We also thank James Ebert, Ed Stander, and Paul Washington, the editors of Northeastern Geoscience, for permission to publish instead in Atlantic Geology, and Atlantic Geology editor Sandra Barr for her scientific feedback and help in reformatting the manuscript for that journal.