Articles
Investigation of the 1727 Newbury, Massachusetts, USA, earthquake using LiDAR imagery and P-wave velocity tomography
ABSTRACT
High-resolution LiDAR (light detection and ranging) images of northeastern Massachusetts and southeastern New Hampshire reveal a 10-km-long, NW-SE-oriented topographic lineament in northeastern Massachusetts that we interpret to be the surface expression of a SW-dipping thrust fault along which the 1727 Newbury, Massachusetts, earthquake occurred. The Newburyport lineament coincides with the northeast edge of a 10-km-long, NW-SE-oriented ridge, herein named Merrimack ridge, that parallels the NW-SE-trending segment of the Merrimack River downstream from where it bends 90° to the southeast. The northwestern end of the Newburyport lineament coincides with a 1-km-long, ~7- to 15-m-high, NE-facing Newburyport scarp that is located just south of the bend in the river. The Newburyport lineament also parallels the NW-SE-oriented nodal planes of the focal mechanism that was generated for the 1999 Amesbury, Massachusetts, earthquake. A P-wave velocity tomographic model generated from a seismic-refraction profile across the Newburyport scarp shows a ~40-m-wide low-velocity zone dipping ~41° SW. Velocities along this zone decrease 15–50%, which suggests that the Newburyport lineament is associated with the surface expression of a SW-dipping brittle fault zone. The LiDAR images also revealed three other NW-SE-trending lineaments in the study area.
RÉSUMÉ
Des images LIDAR (détection et télémétrie par ondes lumineuses) à haute résolution du nord-est du Massachusetts et du sud-est du New Hampshire révèlent un linéament topographique orienté NO-SE s’étendant sur 10 km dans le nord-est du Massachusetts que nous interprétons comme le modelé d’une faille chevauchante plongeant vers le SO à l’origine du séisme survenu à Newbury, au Massachusetts, en 1727. L’emplacement du linéament de Newburyport coïncide avec la façade nord-est d’une dorsale d’une longueur de 10 km, orientée NO-SE, que l’on appelle Merrimack ridge en anglais. Celle-ci est parallèle au segment de direction NO-SE, en aval de la rivière Merrimack, là où elle courbe à 90° vers le sud-est. L’extrémité nord-ouest du linéament de Newburyport coïncide avec un escarpement, à Newburyport, de 1 km de long et d’environ 7 à 15 m de haut, incliné vers le NE et situé juste au sud du coude de la rivière. Le linéament de Newburyport est aussi parallèle aux plans nodaux d’orientation NO-SE du mécanisme au foyer à l’origine du séisme de 1999 survenu à Amesbury, au Massachusetts. Un modèle tomographique de vitesse des ondes primaires produit à partir d’un profil sismique par réfraction relevé le long de l’escarpement de Newburyport démontre une couche faible vitesse d’approximativement 40 m de large avec une pente d’environ 41° vers le SO. Les vitesses enregistrées le long de cette zone sont de 15 à 50 % inférieures à la norme, ce qui porte à croire que le linéament de Newburyport serait associé au modelé d’une zone de failles friables plongeant vers le SO. Les images LIDAR ont également révélé trois autres linéaments de direction NO-SE dans la région à l’étude.
[Traduit par la redaction]
INTRODUCTION
1 The 1727 Newbury, Massachusetts, earthquake was assigned a body-wave magnitude (mb ) of 5.6 and was probably a shallow event with aftershocks that were only 1–2 km deep (Ebel 2000). The main shock caused minor damage in northeastern Massachusetts and coastal New Hampshire, which consisted primarily of broken chimney tops, toppled stone fences, and collapsed cellar walls (Ebel 2000). The earthquake was felt as far away as Philadelphia to the southwest and as far northeast as Penobscot Bay in Maine. Most of the aftershocks were centered in the Merrimack River valley near Newburyport, Massachusetts (Ebel 2000). The Newbury earthquake also resulted in a few areas of liquefaction, most of which are located along a NWSE trend just southwest of the NW-SE-trending segment of the Merrimack River (Fig. 1) (Tuttle and Seeber 1991; Tuttle 2007). Ebel (2000) postulated that the earthquake occurred on a NW-SE-oriented thrust fault, which he based on the 90° bend in the Merrimack River and the NW-SE-trending nodal planes of the focal mechanism that he generated for the 1999 Amesbury earthquake (fig. 4 of Ebel 2000) (Fig. 1). No ground rupture is known to have occurred during the 1727 Newbury earthquake (Ebel 2000).
 Display large image of Figure 1
2 Aftershocks from the 1727 earthquake may still be occurring. Three small earthquakes (MLg 3.0, MLg 2.9, MLg 1.9), for example, occurred on 10 January, 1999, and a fourth event (MLg 2.3) on 14 January ~2 km south of Amesbury, Massachusetts (Ebel 2000) (Fig. 1). The residents in the epicentral region heard loud noises during these earthquakes, which suggests that the events occurred at a shallow depth of 1–2 km (Ebel 2000).
3 Despite the moderate size of the Newbury earthquake, the fault along which it occurred has remained elusive because the NW-SE nodal planes of the focal mechanism generated for the 1999 Amesbury earthquake (Ebel 2000) and the NW-SE-oriented segment of the lower Merrimack River valley (Fig. 1) suggest that the earthquake occurred on a NW-SE-oriented fault. Such an orientation is perplexing because it is perpendicular to the dominant NE-SW trend of major faults and terranes in the Newburyport area (Fig. 1).
4 The goal of this study was to use LiDAR imagery of northeastern Massachusetts and southeastern New Hampshire to locate the fault along which the 1727 Newbury earthquake occurred. Our results revealed a 10-km-long, NW-SE-oriented lineament, herein named the Newburyport lineament (NBL) (Fig. 1), which we interpret to be the surface expression of the causitive fault. The observations that support this interpretation include the NBL’s proximity to the cluster of small earthquakes that occurred south of Amesbury, Massachusetts, in 1999, its parallelism with the NW-SE nodal planes of the focal mechanism of the Amesbury earthquakes (Ebel 2000), its proximity to most of the 1727 liquefaction sites (Tuttle 2007), and its coincidence with a 40-m-wide, SW-dipping low-velocity zone that we interpreted from a P-wave velocity tomographic model (Fig. 1).
METHODS AND DATA USED
5 We interpreted LiDAR imagery with 1-m spatial resolution that we acquired from the MassGIS Data (2016) and NH GRANIT (2016) websites to search for evidence of surface faulting near Newburyport, Massachusetts. Because the energy transmitted by the LiDAR instrument penetrates thick vegetation, LiDAR data are ideal for mapping subtle geologic structures that are hidden beneath thick vegetation (e.g., Marple et al. 2012). For this study we used the Hillshade tool in ArcGIS to generate shaded relief images from the DEM data using various illumination azimuths, an elevation angle of 25°, and a vertical exaggeration of 10 x. Once the optimal illumination angle was chosen for interpretation, the raised-relief color images were then generated using a color scheme based on elevations of the terrain. Basic contrast enhancement routines of Adobe Photoshop were used to digitally enhance the LiDAR images. Lineaments interpreted from the LiDAR images were then further analyzed using geological and topographic maps, along with field investigations.
6 Studies of fractured rock have shown that P- and S-wave velocities decrease across zones of brecciation (e.g., Moos and Zoback 1983; Stierman 1984; Mooney and Ginzburg 1986; Gettemy et al. 2004). A P-wave velocity study of the San Gregorio fault zone in California, for example, showed a ~30% reduction in seismic velocity across the fault gouge relative to the undeformed host rocks 100 m away (Gettemy et al. 2004). Based on studies like these, we conducted a 141-m-long seismic-refraction survey across a scarp that coincides with the northwestern end of the Newburyport lineament (Fig. 2). The line geometry for the seismic-refraction survey consisted of a 48-channel spread with geophones spaced 3 m apart. The energy source consisted of a 4.5 kg sledge hammer that we used to strike a high-strength steel plate three times per station. The data were recorded using a Geometrics StrataVisor seismograph. Elevations of each station were surveyed using a hand level to remove the effects of topography from the seismic data. Geometrics Seg2SegY Viewer and MATLAB software were used to stack the seismic data. GeoImage software was then used to create a 2D color tomographic model of the P-wave velocities from the seismic-refraction data.
 Display large image of Figure 2
GEOLOGIC SETTING OF THE STUDY AREA
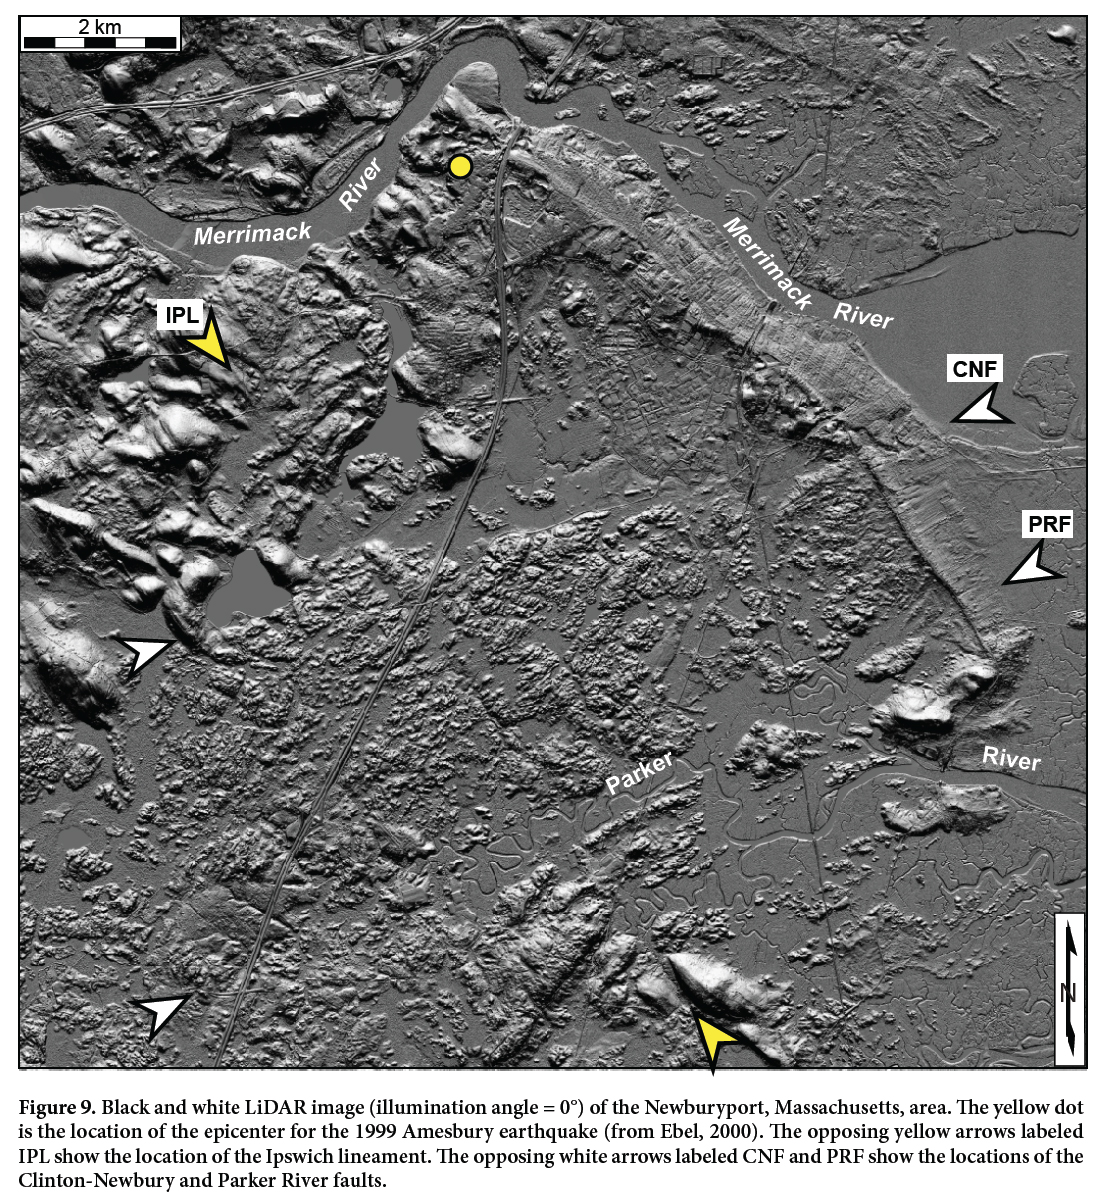
Mapped faults of northeastern Massachusetts
7 The major faults that traverse the Newburyport area are the NE-SW-trending Clinton-Newbury (CNF) and Bloody Bluff (BBF) faults (Fig. 1). The CNF is a composite fault zone that dips steeply to the north (Goldstein and Hepburn 1999). It underwent three different periods and directions of offset: (1) Acadian to late Paleozoic east-directed thrust and reverse motion, (2) late Paleozoic high-angle dextral strike-slip motion, and (3) Mesozoic high-angle normal motion that was characterized by brittle deformation (Goldsmith 1991; Goldstein and Hepburn 1999). The CNF is a terrane boundary that juxtaposes rocks of the Merrimack terrane against those of the Nashoba belt (Fig. 1). The east-westtrending Parker River fault is a splay of the CNF that also dips steeply to the north (Fig. 1).
8 The BBF dips steeply to the northwest in northeastern Massachusetts (Fig. 1) and is characterized by a wide zone of mylonite (Goldstein and Hepburn 1999). The BBF underwent sinistral and dextral displacements during Middle Silurian to Middle Devonian time and normal-sense reactivation during the Mesozoic (Goldstein and Hepburn 1999).
9 Dennen (1991) mapped a few relatively short (~5-kmlong), NW-SE-oriented faults in the southern part of the study area, which he based on offset formations and foliation, local cataclasis, and slickensides (Fig. 1). He interpreted these faults to be late Paleozoic or Mesozoic, but additional studies are needed to determine their ages, dip direction and magnitude, and displacement history. Hibbard et al. (2006) also interpreted two unnamed NESW-trending faults northwest of Newburyport (Fig. 1). The dips and displacement history of these faults are unknown. One of them, ~2.5 km west of Amesbury, Massachusetts, forms the boundary between the Newburyport Complex and the Merrimack Trough (Fig. 1).
Glacial and postglacial sediments in the study area
10 Most of the sediments which overlie the terranes in the study area are Pleistocene glacial deposits of the Illinoinian and Wisconsin ice sheets, which consist mainly of till and glacial stratified sediments. Till is the most widespread glacial deposit and consists of nonsorted mixtures of mineral and rock particles that range in size from clay to large boulders (Hein et al. 2013). In the study area it ranges in thickness from a few cms to more than 60 m and commonly underlies stratified meltwater deposits (Hein et al. 2013). The upper (younger) till was deposited during the late Wisconsinan glaciation and is the most common till exposed at the surface. The lower (older) till was deposited during an earlier glaciation (probably Illinoian) and is mainly a subsurface deposit that comprises most of the sediments in drumlins and other hills in the study area (Hein et al. 2013). In contrast to till, glacial stratified deposits in the study area consist of layers of well- to poorly-sorted gravel, sand, silt, and clay that were laid down in valleys and lowland areas by flowing meltwater in glacial streams, lakes, and marine embayments in front of the retreating Larentide ice margin (Hein et al. 2013).
11 Postglacial sediments consist of marine regressive deposits of sand and gravel, salt marsh deposits, glaciomarine deposits of silty clay, fine sand and gravel, and floodplain alluvium that consists of sand, gravel, silt, and some organic material (Stone et al. 2006). The marine regressive sediments were deposited along former shorelines when sea level was 6 m to 18 m higher than the present sea level (Hein et al. 2013). Alluvium underlies the floodplains of most streams and rivers. Swamp deposits occur in low-lying, poorly drained areas while salt-marsh and estuarine deposits occur mainly along the tidal portions of streams and rivers near the coast (Hein et al. 2013).
LIDAR STUDY
NE-SW-trending Paleozoic faults in the study area
12 Examination of the LiDAR image in Figure 2 revealed that the CNF is highlighted by an abrupt change in texture across the fault. South of the fault the texture is relatively coarse compared to that north of the fault. The coarse texture is interpreted to be from bedrock that is covered by relatively thin (<2 m) glacial sediments. The smoother texture north of the fault trace corresponds to a low-lying area up to 2.5 km wide (Fig. 3a). This low-lying terrain is interrupted only by the NW-SE-trending ridge, herein named the Merrimack ridge, which traverses the depression (Fig. 2). East of the Merrimack ridge, the depression is submerged beneath a 2.5-km-wide estuary known as Joppa Flats (Fig. 2b) that is underlain by phyllite of the Merrimack Trough to the southwest and granitic rocks of the Newburyport Complex to the northeast (Fig. 1). The depression is interpreted to be associated with increased erosion along a broad zone of past deformation along the CNF, rather than a change in bedrock lithology across the trace of the fault. This interpretation is supported by a NE-SW-trending rectilinear drainage pattern that coincides with the depression where it traverses the granitic bedrock of the Newburyport Complex ~2 km southwest of the Merrimack ridge (Fig. 2).
13 The area along the north side of the Parker River fault (PRF) to the south also coincides with a 600-m-wide depression, part of which coincides with the Parker River valley (Fig. 2). The depression continues at least 3 km northeastward beyond the Parker River valley and is underlain by the Newbury Volcanic Complex of the Nashoba Belt (Fig. 1). Like the CNF, this depression is likely associated with a zone of past deformation along the PRF. The other fault that is relatively near the Newburyport area, the unnamed NNE-SSW-oriented fault of Hibbard et al. (2006) west of Amesbury, is not evident on the LiDAR images.
NW-SE-trending lineaments in the study area
14 Examination of LiDAR images of northeastern Massachusetts and southeastern New Hampshire revealed four NW-SE-trending lineaments that traverse the NE-SW-trending Paleozoic faults and terranes at nearly right angles in the study area (Fig. 1). The most northern lineament, the 5-km-long Coins Brook lineament (CPL), is defined by a linear segment of the Coins Brook valley (Fig. 2). The CPL traverses granitic bedrock of the Newburyport Complex (Fig. 1).
 Display large image of Figure 3
15 South of the CPL and ~5 km north of Newburyport is the ~12-km-long Grassy Brook lineament (GBL), which is defined by the collinear alignment of two linear valleys (Fig. 2a). The northwest end of the GBL is defined by a ~3-km-long, NW-SE-oriented segment of the Grassy Brook valley, the floor of which is up to 25 m deep (Fig. 3b). The southwestern edge of this depression is strikingly linear. This linear depression also traverses a drumlin field at a low angle to the southeast direction in which the Laurentide ice sheet flowed over this area during late Pleistocene time (Fig. 2). The southeast end of the GBL is defined by a 1-km-wide, 12-m-deep linear segment of the Little River valley. Pleistocene drumlins interrupt the trend of the GBL between the Grassy Brook and Little River valleys north of Amesbury (Fig. 2). The GBL traverses various bedrock units of the Merrimack Trough and granitic rocks of the Newburyport Complex (Fig. 1).
16 The next lineament to the southwest is the slightly curved, ~10-km-long Newburyport lineament (NBL) that coincides with the northeastern side of a slightly curved, NW-SE-oriented, 20- to 30-m-high, ~1.3-km-wide, 10-km-long ridge, herein named Merrimack ridge, that parallels the NW-SE-trending reach of the Merrimack River valley (Fig. 2). The NBL and Merrimack ridge traverse the Clinton-Newbury and Parker River faults at nearly right angles (Fig. 2). They also traverse the Newbury Volcanic Complex of the Nashoba Belt and granitic bedrock of the Newburyport Complex (Fig. 1). The sediments along the crest of Merrimack ridge consist of 1- to 4-m-thick, late Pleistocene fluvial terrace deposits that overly late Pleistocene marine regressive and glaciomarine deltaic and fan deposits (Hein et al. 2013). The fluvial terrace deposits at the top of the ridge indicate that the Merrimack River once flowed 4 km farther to the southeast along the northeast side of the ridge to about Newbury during late Pleistocene time when sea level was 6–18 m higher (Hein et al. 2013). No similar ridge or fluvial terrace occurs along the northeast side of the lower Merrimack River valley (Fig. 4).
 Display large image of Figure 4
17 The coarse texture of the LiDAR image along the southwest side of Merrimack ridge near its southeastern end (Fig. 2a) and 1:24 000-scale bedrock geologic maps of the Newburyport area (Shride 1976) indicate that the lower part of the ridge consists of granitic rocks of the Newburyport Complex and various rocks of the Newbury Volcanic Complex that have been covered by late Pleistocene sediments (Fig. 1) (Stone et al. 2006; Hein et al. 2013). A 1-km-long, 7- to 15-m-high, NE-facing scarp, herein named the Newburyport scarp, coincides with the northeast side of this ridge just south of the 90° bend in the Merrimack River (Figs. 5–7). Along the base of the Newburyport scarp is a linear depression which deepens to as much as 10 m at the northwestern end of the scarp where it intersects the Merrimack River (Fig. 6a). The depression deepens again to the southeast to over 5 m (e.g., Fig. 7, profile 3). The Newburyport scarp is underlain by coarse Pleistocene sediments (Stone et al. 2006). The bedrock beneath these sediments consists of granitic rock of the Newburyport Complex (Fig. 1). Southeast of the scarp and along the northeast side of Merrimack ridge is an en échelon pattern of short (<0.5 km long), NW-SE-trending linear depressions (Fig. 1).
 Display large image of Figure 5
 Display large image of Figure 6

18 Examination of the elevation profiles that traverse the NBL (Fig. 4) reveals that the area southwest of the NBL is generally higher (2–12 m) than the terrain to the northeast. In addition, the 1-km-long reach of the Merrimack River upstream from the Newburyport scarp narrows abruptly along the trend of Merrimack ridge (Fig. 2). Elevation profiles across the Merrimack River valley upstream from the river bend show that the valley is entrenched ~18 m more along the trend of the ridge than farther upstream (Fig. 8). The river valley upstream from and along the entrenched part of the river is underlain by granitic bedrock of the Newburyport Complex (Fig. 1). Thus, the entrenched part of the river is not the result of a change in bedrock type.
 Display large image of Figure 8
19 Northwest of the Merrimack River are two zones of NWSE-oriented lineaments (Fig. 2) that may represent the northwestern continuation of the NBL, which would result in a length of at least 17 km for the NBL. The trend formed by these two zones merges with the Grassy Brook lineament to the northwest. The NBL is located ~1 km northeast of the 1999 Amesbury earthquake and parallels the NW-SE nodal planes of the focal mechanism generated for the MLg 3.0 mainshock (Ebel 2000) (Figs. 1 and 2b).
20 The next lineament to the south is a subtle, NW-SE-trending, 10-km-long lineament that we have named the Ipswich lineament (IPL) (Fig. 9). The IPL is defined by the alignment of short (< 2 km) linear depressions. The IPL traverses the Clinton-Newbury and Parker River faults at nearly right angles, but does not appear to offset them laterally (Fig. 9). It is collinear with two ~5-km-long, NW-SE-trending faults to the southeast that were mapped by Dennen (1991) (Fig. 1). The more southeastern of these two faults curves to the southeast (Fig. 1). The IPL traverses the Nashoba Belt and granitic bedrock of the Newburyport Complex (Fig. 1).
 Display large image of Figure 9
Seismic tomography results
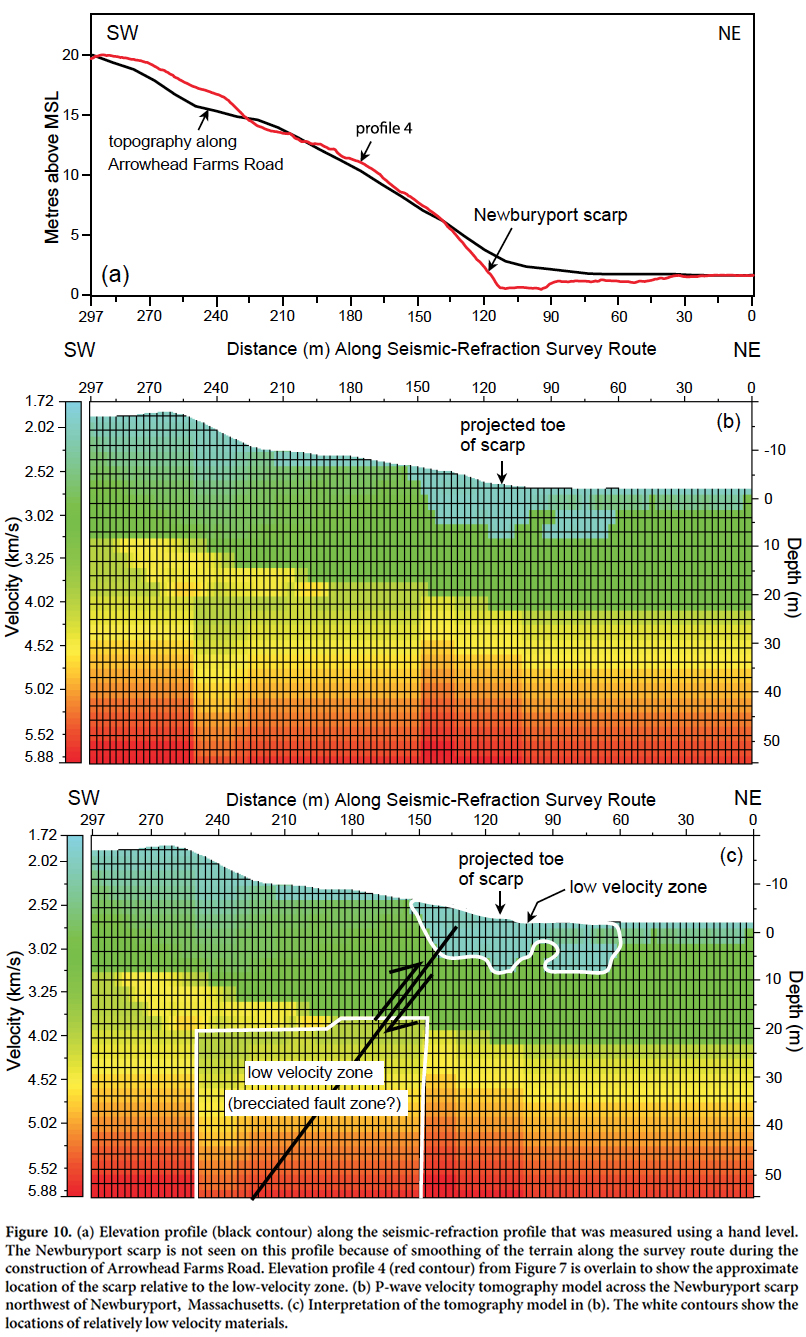
21 The P-wave velocity tomographic model created from the seismic-refraction profile across the Newburyport scarp revealed a three-layer model in which the velocity increases with depth (Fig. 10). Layer 1, shown in light blue near the surface, indicates a velocity range of 1.72–2.62 km/s. Layer 2, shown in light green to yellow, indicates a velocity range of 2.62–3.23 km/s at a depth of 10–35 m and layer 3, shown in light orange to red, indicates a velocity range of 3.23–5.88 km/s at a depth of 35–55 m along the profile.
 Display large image of Figure 10
22 The resulting 2-D color model reveals a SW-dipping low-velocity zone between 60 and 250 m distance from the northeast end of the profile (Fig. 10). The velocities across layer 1 between 60 and 150 m decrease from ~3.0 to ~1.72 km/s (~43%) from the surface to ~10 m depth. The velocities across layer 2 decrease 0.5 to 1 km/s (~25%) between 150 and 190 m distance. The velocities across layer 3 between 190 and 250 m decrease 15–20% below 30 m depth (Fig. 10). This low-velocity zone dips ~41°SW.
23 The low-velocity zone is formed within early post-glacial marine regressive deposits near the surface (Stone et al. 2006) and within granitic bedrock of the Newburyport Complex at depth (Hibbard et al. 2006). The low-velocity zone intersects the surface where the foot of the Newburyport scarp projects across the suvey route (Fig. 10). The scarp is not present on the topographic profile along the survey route in Figure 10a because of the smoothing of terrain along Arrowhead Farms Road during its construction.
DISCUSSION
Origin of the NW-SE-trending lineaments
24 We considered various causes of the NW-SE-trending lineaments, including glacial scouring and differential erosion associated with lithologic boundaries, bedrock fabric, such as foliation, and brittle faults. It is unlikely that glacial scouring could have produced the lineaments because the trends of some lineaments, such as the GBL, are oblique to the southeast direction of Laurentide ice sheet flow in the study area (Fig. 2b). Instead, glacial scouring and subaerial erosion have eroded areas of bedrock weakened by fracturing, thus producing linear depressions and valleys along faults (e.g., Marple et al. 2012). In other areas, such as along part of the GBL, drumlins and other areas of thick till have concealed the true extent of some faults.
25 Foliation and lithologic boundaries also could not have formed the NW-SE-trending lineaments because they traverse different rock types with different fabrics (Fig. 1). The NBL and GBL, for example, traverse the Newburyport Complex (Fig. 1), which has no strong foliation that would favor the development of NW-SE-trending lineaments. Furthermore, the bedding planes of the Nashoba Belt near the southern end of the NBL strike E-W to NE-SW (Shride 1976; Dennen 1991).
26 Based on the previous discussion, the best explanation for the lineaments is that they are surface expressions of faults. An observation that supports this hypothesis is the alignment of the IPL with two NW-SE-trending faults to the southeast (Fig. 1), which suggests that the IPL is the surface expression of a fault that is continuous with the two mapped faults.
Interpretation of the P-wave seismic tomography
27 The low-velocity zone interpreted below 18 m depth in the P-wave seismic tomographic model (Fig. 10) is likely a zone of brecciated granitic rock at least 40 m wide that dips ~41°SW. This interpretation is supported by other studies of brittle faults (e.g., Gettemy et al. 2004), which show similar decreases in P-wave velocities. The 41° dip also supports our interpretation of a fault because it is similar to the smaller dip that we estimated using a 1- to 2-km depth assumed for the 1999 Amesbury earthquake (Ebel 2000) and the 1 km distance from the NBL to the epicenter of the earthquake (Fig. 1), which yields a southwest dip of 45° to 63°. The low-velocity zone between 60 and 150 m distance in the upper 10 m could be a late Pleistocene stream channel that has since been filled with alluvium. This interpretation is supported by the depression along the base of the Newburyport scarp (Figs. 5–7), which suggests that past displacements along the thrust fault were large enough to rupture the ground surface and produce the scarp. The ground rupture would have made the area along the base of the scarp more susceptible to erosion and thus the development of linear drainage along the foot of the fault scarp. This reasoning further implies that these displacements would have generated earthquakes larger than the 1727 event, which was not associated with ground rupture (Ebel 2000).
Possible source of the 1727 Newbury earthquake
28 We evaluated the various faults and lineaments in northeastern Massachusetts to determine the source of the 1727 Newbury earthquake, including the NW-SE-trending lineaments and the ENE-WSW-oriented CNF and unnamed NNE-SSW-oriented fault ~2.5 km west of Amesbury, Massachusetts. The earthquake probably did not occur on the CNF or the unnamed fault because they are oriented nearly perpendicular to the nodal planes of the 1999 Amesbury earthquake focal mechanism (Fig. 1). Furthermore, the CNF is approximately parallel to SHmax, (Fig. 1), which does not favor its reactivation.
29 Based on the NW-SE nodal planes of the Amesbury focal mechanism and the abrupt bend in the Merrimack River (Fig. 1), the 1727 Newbury earthquake likely occurred on a NWSE-oriented fault. Of the four NW-SE-oriented lineaments that we interpreted in northeastern Massachusetts, the NBL is the most viable candidate for the source of the Newbury earthquake for several reasons. First, the low-velocity zone beneath the Newburyport scarp (Fig. 10) likely represents a SW-dipping fault zone, as discussed in the previous section. The orientation of the NBL relative to SHmax (Fig. 11) favors thrust-style reactivation of the interpreted thrust fault with a small component of sinistral motion. Secondly, the NBL is closer to most of the 1727 liquefaction sites and the epicenter of the 1999 Amesbury earthquake than the other lineaments (Fig. 1). Third, the Newburyport scarp along the northwest end of the NBL is likely a Quaternary fault scarp since it is formed in Pleistocene-age deposits. The zone of en échelon linear depressions southeast of the Newburyport scarp are likely bedrock fractures (Fig. 2), which suggests that this area along the NBL has also been faulted. Lastly, the NW-SE-trend of the NBL, Merrimack ridge, and the lower Merrimack River valley (Fig. 2) are anomalous because they are formed in granitic bedrock of the Newburyport Complex (Fig. 1), which has no fabric that would favor the development of such NW-SE-oriented features, and because the bedding planes of the Nashoba Belt near the southern end of the NBL strike E-W to NE-SW (Shride 1976; Dennen 1991).
 Display large image of Figure 11
30 We hypothesize that the Merrimack ridge formed by uplift along the southwest side of the interpreted SW-dipping Newburyport thrust fault. This hypothesis is supported by the entrenchment and abrupt narrowing of the Merrimack River where it traverses the trend of the ridge (Figs. 2 and 8). The presence of late Pleistocene shoreline sediments along the top of this ridge (Hein et al. 2013) indicates that the uplifted bedrock along the base of this ridge caused the formation of a NW-SE-oriented shoreline that is at a high angle to the modern shoreline. Similar effects of gentle uplift on the location of Pleistocene shorelines have occurred in the Coastal Plain of South Carolina where Pleistocene shoreline sediments have been mapped along the east side of the Zone of River Anomalies, which formed in response to gentle, long term uplift along a buried fault zone (fig. 12 of Marple and Talwani 2000). After sea level dropped from this area during late Pleistocene time, the Merrimack River formed late Pleistocene fluvial terrace deposits above the shoreline sediments along the crest of the ridge.
31 The NW-SE-orientation of the NBL relative to the axis of the regional maximum horizontal compressive stress field, SHmax, (Zoback and Zoback 1991) (Figs. 1 and 11) favors thrust-style displacement with a minor component of sinistral motion along the interpreted thrust fault associated with the NBL. This interpretation is consistent with the focal mechanism of the 1999 Amesbury earthquake, which shows mainly dip-slip motion with a minor amount of sinistral motion (Fig. 1). Thus, a more local stress exerted by compression at a 15° restraining bend near Kingston, New Hampshire, to the west that it is formed by the intersection of the South Portland (Marple et al. 2014a) and Misery Hill faults (Marple et al. 2014b) (Fig. 11) may have also contributed to the dip-slip reactivation of the interpreted Newburyport thrust fault. This hypothesis is supported by other studies of fault bends which show that thrust-and reverse-style faulting is commonly associated with restraining bends along strike-slip faults (e.g., King and Nabelek 1985; Marple and Miller 2006; Cunningham and Mann 2007).
32 The origin and dips of the faults that we interpreted along the other three lineaments is uncertain because no geophysical surveys have been carried out across them. Further studies are needed, therefore, to determine their origin, dip direction, and displacement history.
CONCLUSIONS
33 We conclude that the 1727 Newbury, Massachusetts, earthquake occurred on a NW-SE-oriented, SW-dipping thrust fault associated with the Newburyport lineament (NBL) in northeastern Massachusetts. This interpreted thrust fault appears to have produced gentle uplift southwest of the NBL since at least late Pleistocene time. Some pre-1727 displacements on the Newburyport thrust fault were large enough to vertically offset the ground surface and produce the Newburyport fault scarp, unlike the displacement associated with the 1727 event, which apparently did not rupture the ground surface. We, therefore, conclude that some of the past earthquakes on the Newburyport thrust fault may have been larger than the 1727 event. Thus, additional studies of this thrust fault are needed to determine its origin, true extent, and the level of seismic hazard that it poses to central New England and the Boston area to the south.
The authors thank John Ebel and a second anonymous reviewer, both of whom originally reviewed this manuscript for Northeastern Geoscience, for their many constructive comments, which improved the manuscript. We also thank James Ebert, Ed Stander, and Paul Washington, the editors of Northeastern Geoscience, for permission to publish instead in Atlantic Geology, and Atlantic Geology editor Sandra Barr for her scientific feedback and help in reformatting the manuscript for that journal.