Articles
Sedimentology and chemostratigraphy of Carboniferous red beds in the western Moncton Basin, Sussex area, New Brunswick, Canada:
possible evidence for a middle Mabou Group unconformity
ABSTRACT
The area around Penobsquis, east of Sussex, New Brunswick, Canada, is an important location of natural resources for the province. The McCully gas field produces from strata of the Mississippian Horton Group whereas younger strata of the Windsor Group are host to major potash and rocksalt deposits. Overlying these units are over 1 km of poorly understood red beds currently assigned to the Mississippian Mabou Group. To date, this latter unit lacks significant marker beds and has had no useful biostratigraphic recovery, despite recent extraction of close to 5 km of drill core. Research on this core broadly identifies siltstone and sandstone at the base of the Mabou Group that gradually coarsen up into conglomerate. The succession is considered the result of alluvial-fan progradation from the northeast. Within this succession, in several of the cores, is a single interval of localized, horizontally laminated to cross-stratified, bluish-grey sandstone, containing carbonaceous plant fragments and siltstone intraclasts. To assess the importance of this interval in the context of the red bed succession, a total of 131 samples of core from three boreholes have been analyzed using Inductively Coupled Plasma and spectroscopic techniques to determine chemostratigraphy. Study of various elemental ratios can delineate two packages, one that corresponds to the grey interval and overlying red beds, and the other to the underlying red beds. Changes in the elemental ratios are interpreted to mark a broader population of mineral species related to greater variation of provenance and diagenesis in the upper sediment package. The reduced horizons and rip-up clasts may have been produced by sediment reworking along a boundary that represents an unconformity (in core, a disconformity) at a stratigraphic level near to where one has been inferred by other workers.
RÉSUMÉ
La région entourant Penobsquis, à l’est de Sussex, au Nouveau-Brunswick, au Canada, est un lieu important sur le plan des ressources naturelles pour la province. Le champ de gaz naturel McCully tire ses ressources des strates du groupe de Horton, dans le Mississippien, tandis que les strates plus récentes du groupe de Windsor recèlent d’importants gisements de potasse et d’halite. Plus d’un kilomètre de couches rouges mal comprises, actuellement attribuées au groupe de Mabou, dans le Mississippien, recouvre ce champ. À ce jour, ces couches sont exemptes d’horizon repéré significatif et n’ont fait l’objet d’aucune récupération biostratigraphique utile malgré l’extraction récente de carottes de forage totalisant près de 5 km. Selon les recherches menées sur ces carottes, on y retrouve à la base du groupe de Mabou de grandes quantités de stiltite et de grès qui se transforment graduellement en conglomérat. Cette succession est considérée comme le résultat de la progradation d’un cône alluvial provenant du nord-est. On y a également découvert dans plusieurs carottes un intervalle localisé de grès bleu-gris à lamination horizontale à croisée, contenant des fragments de plantes carbonées et des intraclastes de stiltite. Pour évaluer l’importance de cet intervalle dans le contexte de la succession de couches rouges, 131 échantillons de carottes au total tirés de trois trous de forage ont été analysés au moyen des techniques spectroscopiques et de plasma à couplage inductif afin de déterminer la chimiostratigraphie. L’étude de divers ratios élémentaires permet de circonscrire deux ensembles, un correspondant à l’intervalle gris et aux couches rouges supérieures, l’autre correspondant aux couches rouges inférieures. L’interprétation des différences dans les ratios élémentaires permet ensuite de repérer une population plus marquée d’espèces minérales en lien avec une diversité accrue de provenances et une diagénèse dans l’ensemble de sédiments supérieur. Les horizons réduits et les clastes arrachés pourraient être issus du remaniement des sédiments le long d’une frontière constituant une discordance (une discordance stratigraphique dans la carotte) à un niveau stratigraphique près de l’endroit où d’autres travailleurs ont inféré pareille discordance.
[Traduit par la redaction]
INTRODUCTION
1 Chemostratigraphic methods include those that characterize sedimentary successions based on distinctive features in their inorganic whole-rock geochemistry. Their applications have most commonly been in the subdivision of deformed red beds, where biostratigraphic and magnetostratigraphic methods are limited by lack of preserved microfossils and uncertain reorientation of magnetic minerals in the strata (e.g., Preston et al. 1998; Pearce et al. 1999, 2005, 2008; Ratcliffe et al. 2004, 2010).
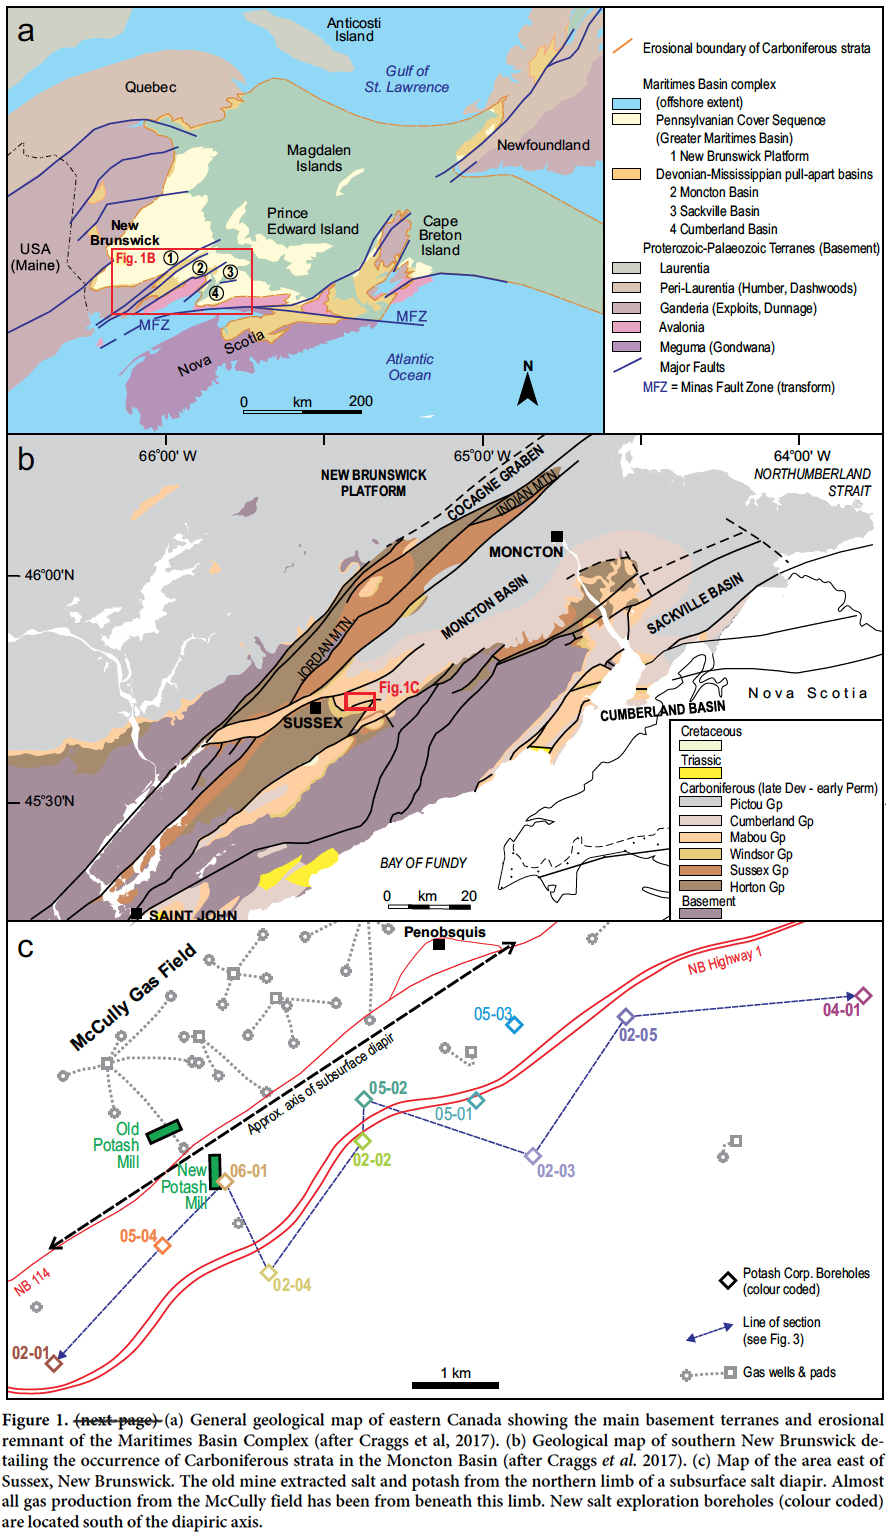
2 Red beds are common in Upper Devonian to Pennsylvanian strata of southeastern New Brunswick, where they form part of the fill in a system of basins (Cocagne Graben, Moncton, Sackville, and Cumberland basins) that are components of the regional Maritimes Basin Complex (Fig. 1; Keighley 2008). Three tectono-sedimentary megacycles (“allocycles” of St. Peter 1993) have been identified (Fig. 2) that indicate a complex history of fault-controlled subsidence, strike-slip motion, basin inversion, and salt tectonics (e.g., Wilson 2005; Wilson and White 2006; Park and St. Peter 2009; Park et al. 2007, 2010; Waldron et al. 2013; Craggs et al. 2017). Red beds are particularly abundant in the 2nd megacycle (Upper Mississippian), where they have been formally differentiated into several formations in the Moncton and adjacent basins. However, in the western part of the Moncton Basin, limited outcrop and borehole data to date have resulted only in a few broadly based studies of the Upper Mississippian red beds (Anderle et al. 1979; Wilson 2005), an informal lithostratigraphy at the sub-group level (St. Peter 1993), and continued uncertainty as to the presence or importance of a mid-red bed unconformity first inferred by Gussow (1953) and subsequently by Jutras et al. (2007) farther north in southern Québec and northern-most New Brunswick. Limited spore recovery from these red beds also has hindered biostratigraphic subdivision (St. Peter and Johnson 2009).
 Display large image of Figure 1
 Display large image of Figure 2
3 A recent potash exploration program by the Potash Corporation of Saskatchewan Inc. (PotashCorp), near Sussex, now has resulted in the collection of over 5 km of drill-core. Sedimentary logging of these cores, together with bulk-rock Inductively Coupled Plasma – Mass Spectrometry (ICPMS) analyses of 131 samples from three of the cores, allows for new insights into the red bed succession, the informal stratigraphy, and supporting evidence for the previously identified unconformity. The results further confirm the utility of whole-rock chemostratigraphy.
GEOLOGICAL SETTING
4 The > 3.5 km-thick Devonian-Carboniferous stratigraphic succession in southern New Brunswick overlies terranes (southwards, Ganderia, Avalonia, and, in Nova Scotia, Meguma) that accreted to Laurentia in the Silurian-Devonian (Fig. 1). However, in this region these terranes were still subject to later relative movements accompanying oblique collision of Gondwana to Laurentia (Alleghanian orogeny, Murphy et al. 2011; Waldron et al. 2015). This provided a major transtensional-transpressional structural control on the younger stratigraphy. Initially, the result was the development of small-scale sedimentary pull-apart basins, such as the Moncton Basin (Craggs et al. 2017).
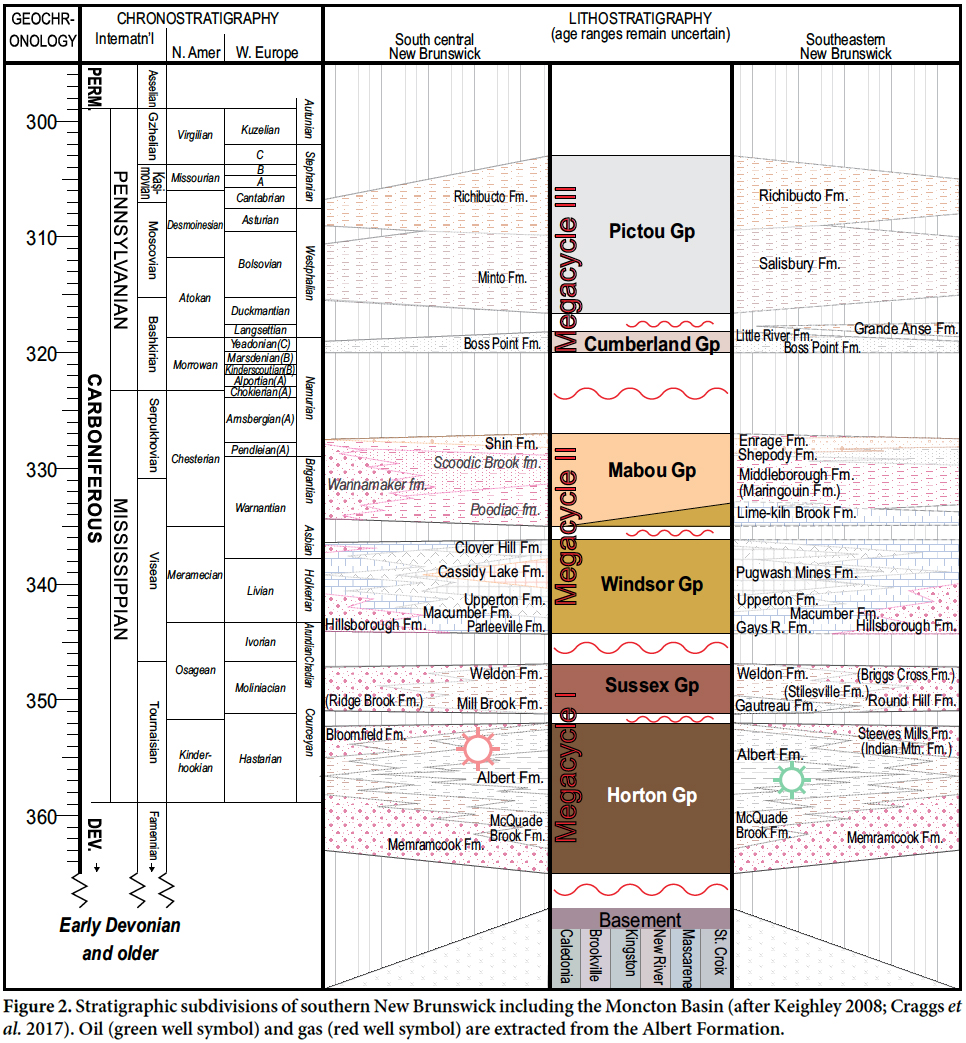
5 The three tectono-sedimentary megacycles recognised in the New Brunswick Devonian-Carboniferous succession (Fig. 2; St. Peter 1993) are separated by interbasinal angular unconformities related to specific tectonic episodes (Murphy et al. 2011). More localized intrabasinal unconformities are identified within individual basins. The first megacycle, which culminated in a late Tournaisian to early Visean inversion, consists of strata assigned to the Horton and Sussex groups. The second megacycle contains strata assigned to the Windsor and Mabou groups. The subsequent late Visean to Serpukhovian inversion (Wilson and White 2006; Murphy et al. 2011), is related to the near-continent-wide Mississippian-Pennsylvanian unconformity, and in eastern Canada is signified by a major episode of transpression and uplift associated with the Minas Fault Zone (Fig. 1a; Murphy et al. 2011). Early Pennsylvanian deposition (Cumber-land Group) again appears to have been initiated in areas of transtension, and rapidly subject to salt tectonism associated with deformation of buried Windsor Group evaporites (Waldron et al. 2013; Craggs et al. 2017). However, in the later Pennsylvanian, thermal relaxation caused regional cooling and subsidence, leading to the development of an enlarged sedimentary basin, which buried most of the rapidly deposited, locally sediment-sourced, and deformed pull-apart basins. Therefore, in contrast to the first two megacycles, the third evolved to also consist of a blanket of more mature, generally more slowly accumulated sediment (Pictou Group) in a more regional terrestrial drainage sys-tem (Gibling et al. 1992).
6 The focus of this paper is on red beds currently included in the upper Mississippian 2nd megacycle (Fig. 2). Within this megacycle, carbonate and evaporite rocks are interpreted to have been deposited following marine transgressions, and red beds to have followed regional uplift or marine regression (Giles 1981, 2009; Wilson 2005). Various formations are combined into the Windsor Group, the lower and upper contacts of which are placed at the base and top of the strati-graphically lowest and highest carbonate or evaporite beds encountered in a particular area (Giles 1981; McCutcheon 1981). In the western Moncton Basin, the uppermost Windsor Group comprises the mined potash and halite (Cassidy Lake Formation) and overlying anhydrite and halite (Clover Hill Formation, McCutcheon 1981; Wilson et al. 2006).
7 In Nova Scotia, additional cycles of red beds, carbonate rocks, and sulfate rocks are reported overlying Cassidy Lake equivalent strata (e.g., Giles 2009); in New Brunswick a red bed succession up to 1 km thick overlies the Cassidy Lake Formation (Webb 2009). Originally considered part of the Gypsiferous Formation (Lyell 1843) or part of Division 8 of the Coal Measures (Logan 1845), and later the Bonaventure Formation (Logan 1864), these red beds in the far southeast of New Brunswick were formally assigned to the Hopewell Group and divided into three units by Norman (1941a, b) and Gussow (1953). A lower, red mudstone-dominated unit (Maringouin Formation, now Middleborough Formation, Jutras et al. 2016), is overlain by interbedded red and grey sandstone, red and grey mudstone, and minor calcareous mudstone-pebble and coalified plant-fragment conglomer-ate, with Cu-mineralized horizons at the base of the unit (Shepody Formation). The uppermost red beds are interbedded conglomerate, sandstone, and mudstone (Enragé Formation). Toward the basin margins, a localized conglomeratic unit interfingers with and progressively overlies Windsor Group strata (Hopewell Cape Formation). Despite the ear-lier names noted above, for stability of nomenclature most authors (e.g., Wilson et al. 2006; Force and Barr 2006; St. Pe-ter and Johnson 2009; Utting et al. 2010; Murphy et al. 2011; Allen et al. 2013; Waldron et al. 2013; Hayward et al. 2014; Holt et al. 2014; Stimson et al. 2016; Craggs et al. 2017) in-clude these and laterally equivalent red bed units sitting on Windsor Group strata in the Mabou Group of Belt (1964, 1965). Overlying plant-bearing grey sandstone, mudstone, and thin coal beds are assigned to the Boss Point Formation (Cumberland Group, Pennsylvanian).
8 In the Sussex region, the informal units of Anderle et al. (1979) have been used for the post-Windsor red beds, namely: grey and reddish brown sandstone, siltstone, and minor conglomerate for the Poodiac formation; greyish red conglomerate, and minor sandstone and siltstone for the Wanamaker formation; and red siltstone, and fine sandstone for the Scoodic Brook formation (note that, following the North American Commission on Stratigraphic Nomenclature, 1983, informal names do not warrant capitalization of “formation”).
9 There has been much debate regarding the nature of the contacts associated with the post-Windsor red beds. Gussow (1953) proposed that a “mid-Hopewell” unconformity separating the Shepody and Enragé formations was equivalent to the Mississippian-Pennsylvanian boundary. As evidence, in a seismic-based cross-section (adjacent to the current study area) he interpreted Shepody-involved thrust faulting to be regionally truncated by overlying Enragé Formation. This latter formation, and its equivalent Claremont Formation in Nova Scotia, also have been assigned to the overlying (i.e., 3rd megacycle) Pennsylvanian Cumberland Group by Ryan and Boehner (1994). More recent seismic interpretations identify “a local intra-Mabou unconformity” adjacent to a thrust-related triangle zone, with Gussow’s regional Mississippian-Pennsylvanian boundary unconformity picked at the Enragé – Boss Point contact (Wilson and White 2006). This latter contact for the Mississippian-Pennsylvanian boundary is also supported by the palynological work of Utting et al. (2010).
10 In Québec, Jutras et al. (2001) noted a channelized disconformable contact between underlying red clastic rocks of the type Bonaventure Formation and the overlying plant-bearing grey clastic rocks of the Pointe Sawyer Formation. Although lacking biostratigraphic control, the underlying red beds were considered time equivalent to the upper Windsor Group strata of Nova Scotia and named the Percé Group by Jutras and Prichonnet (2005). As noted above, this splitting of the red beds has not been adopted by other workers in New Brunswick and Nova Scotia.
METHODS
11 Drill cores (2.5 inch, or 63.5 mm, diameter) from the 2002, 2005, and 2006 PCS exploration program were selected. From southwest to northeast of the study area (Fig. 1c) these holes are named: PCS-02-01, PCS-05-04, PCS-02-04, PCS-06-01, PCS-02-02, PCS-05-02, PCS-02-03, PCS-02-05, and PCS-04-01. Cores from PCS-05-01 and PCS-05-03 were excluded from detailed lithofacies analysis because they are highly fractured. Logging of the approximately 4 km of core was undertaken at the centimetre scale from the depth where coring began in the red beds, down to the contact with underlying evaporite or carbonate; study of Windsor Group strata did not form part of this project. Lithofacies analysis was based on the classification scheme of Miall (1978, 1996).
12 A small biostratigraphic study was attempted on material from grey siltstone beds but no palynologic components were identified that could narrow down the time of deposition beyond what is already known and stated above (G. Dolby, personal communication, 2013).
13 Several of the logged boreholes were also selected for geochemical sampling. For PCS-02-05, 59 samples were collected systematically at regular (~10 m) intervals. For boreholes PCS-05-04 (n = 44) and PCS-02-01 (n = 30), samples were collected by random number generation (converted to borehole depth) using Microsoft Excel to achieve more unbiased results. In all cases, to minimize variation resulting simply from grain size factors (Pearce et al. 1999), materials were collected from the finest grained beds within 1 m of the designated sampling depth.
14 Following Pe-Piper et al. (2008), sample preparation and analyses were performed by Activation Laboratories Ltd. (Actlabs) in accordance with the International Organization for Standardization (ISO) 17025. Preparation procedures are detailed on the Actlabs website (Activation Laboratories Ltd. 2014). Powdered and fused samples were analyzed by Perkin Elmer Sciex ELAN 6000, 6100 or 9000 ICP/MS, and samples from each core were randomized prior to analysis. Three blanks and five controls (three before the sample group and two after) also were analyzed per group of samples. Control samples included standards NIST694, DNC-1, and BIR-1a for major elements, and OREAS 100a and 101a, NCS DC 86312, 70009, and 70014 for minor and trace elements. The relative standard deviation from replicate analyses of the standard is <5% for major elements and <10% for minor/trace elements. The uncertainty associated with various determinations is ± 100 % at the detection limit (DL), ± 15 % at x10 DL and ± 5 % at x100 DL. Duplicates were fused and analyzed every 15 samples with instrument recalibration after every 40 samples.
15 Analyses of the different cores were run several months apart. Although the same standards were run with each analysis, and quality control checks indicate consistent readings, during statistical analyses we follow Tuttle et al. (1983) and do not combine data from different cores into single datasets.
16 In whole-rock geochemical data, variables are non-negative and compositional in nature; values are recorded as a proportion of the whole, i.e., ppm or percent (%). This constrained sample space, or the simplex, leads to what is known as the constant sum problem, which together with an often non-normal distribution of the data, makes basic statistical analyses (e.g., variance, correlation, regression and its derivatives) inapplicable (Pearson 1896; Chayes 1960; Butler 1979; Davis 2002). It also means that the compositional variables are, in fact, ratios whose denominators are rarely the sum of all the constituents available to be measured (Davis 2002). To overcome this problem, Aitchison (1986) demonstrated that centred log ratio (CLR) data transformation allows for the use of standard statistical methods on such geochemical data (Can Mert et al. 2016). This transformation is a simple process done by taking the natural log of each quotient where each compositional variable is divided by the geometric mean of the composition. Elements with more than one recorded value below detection limit remain problematic. For elements with only one such value (cobalt, zinc, germanium, tin, thallium), an artificial value (v) was assigned for statistical purposes, where v = x – (x/10) and x = detection limit (Davis 2002). Elements with more than one value below detection limit were excluded from statistical analyses. The raw data (in ppm) are provided in Appendix A.
SEDIMENTOLOGY
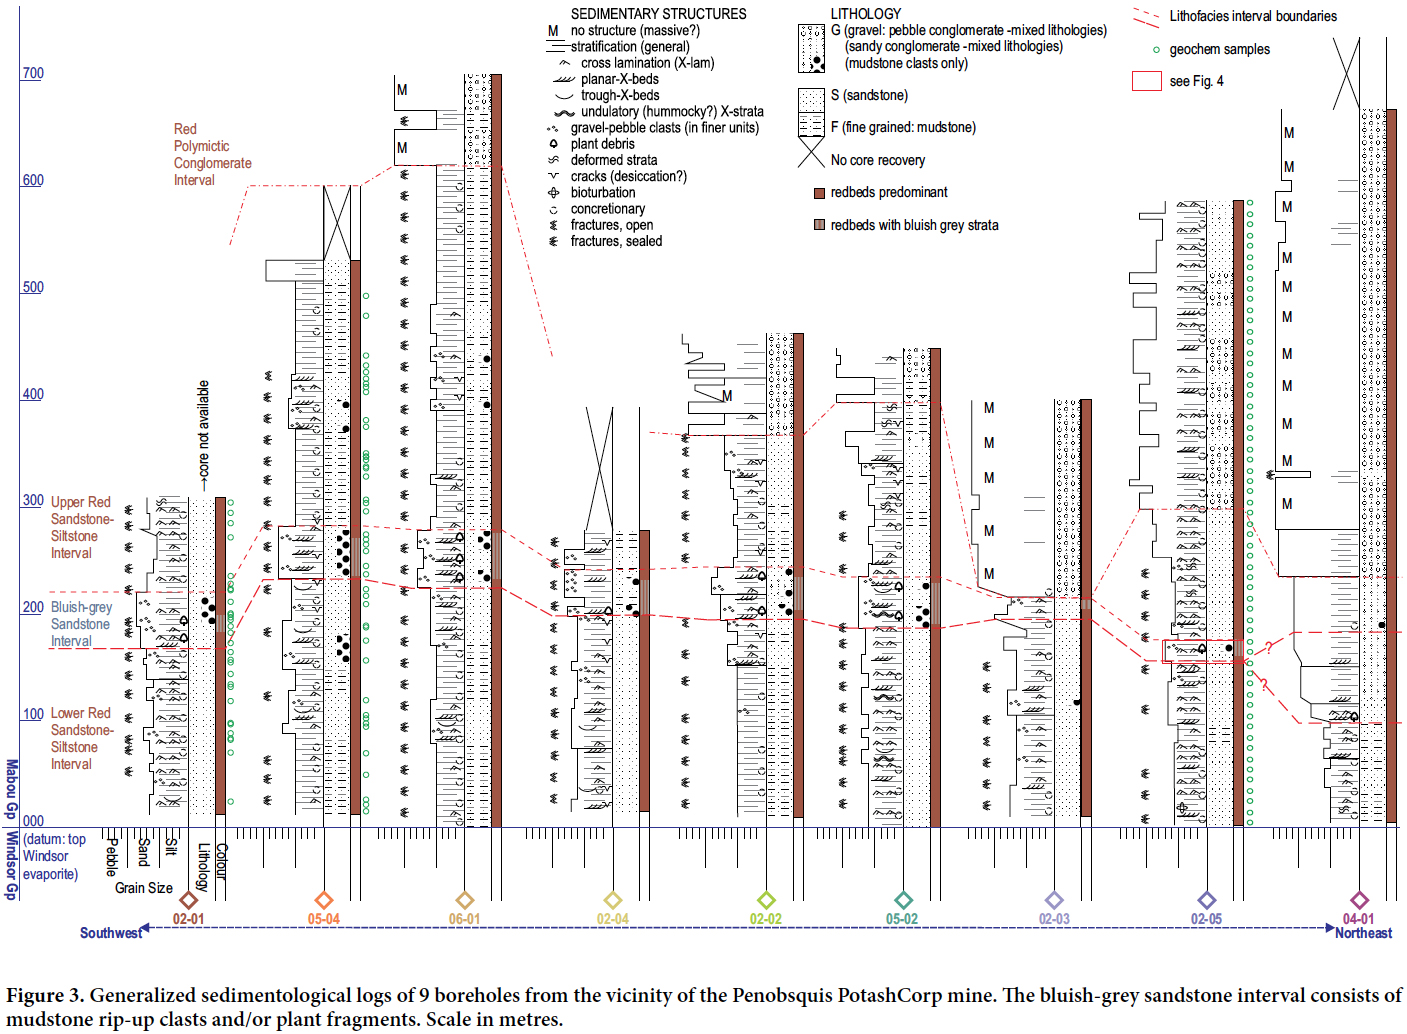
17 Sedimentological analysis of red bed cores taken from most of the recent vertical PCS exploration boreholes (Figs. 1c, 3, 4) resulted in the identification of 11 major lithofacies (Table 1). Lithofacies are mainly reddish-brown, pale brown, brownish-grey, and brown; ferruginous or calcareous; and mainly horizontally stratified. A unique bluish- or brownish-grey sandstone interval containing rip-up clasts and/or plant fragments occurs in the lower parts of most boreholes. The summary sedimentological logs (Fig. 3) indicate that fine-grained and/or sandstone-dominated facies broadly coarsen upward to gravel facies, with the amount of coarse-grained sediment also increasing toward the northeastern part of the study area. Accordingly, four intervals, the lower red sandstone-siltstone interval, bluish-grey sandstone interval, upper red sandstone-siltstone interval, and red polymictic conglomerate interval, have been identified. They are briefly reviewed in terms of their lithofacies associations. Also for brevity, since limited information is preserved in core (e.g., lateral facies relationships and larger scale geometries are not present to narrow down an interpretation), a plethora of possible conditions exist under which these various sedimentary structures are deposited, and a comprehensive discussion of all the possible interpretations is not feasible: only our favoured interpretations are presented.
 Display large image of Figure 3
 Display large image of Figure 4
Lower red sandstone-siltstone interval
18 Description: This interval comprises pale brown to greyish brown, very fine- to fine-grained sandstone and siltstone, with rare scattered thin greenish- or bluish-grey bands and blotches. The beds were observed to have dips of ~5 to ~20 degrees. The maximum core thickness of this interval is ~220 m in PCS-05-04 (in the southwestern part) with a minimum thickness of ~97 m in PCS-04-01 at the northeast corner of the study area. Packages of sandstone beds range in thickness from ~0.5 m to ~27 m, and siltstone packages from ~2 m to ~33 m. Individual packages both coarsen and fine upward; however, the interval shows an overall coarsening-upward trend (except PCS-02-04). The most commonly identified lithofacies are Sh, Sx, Sp, Fl, and Fm, with lithofacies St, Sm, and Fd subordinate. Scattered nodular carbonate and sulfate concretions are also present. Cross-laminations in lithofacies Sx are mostly asymmetric and rarely display climbing. Mudstone rip-up clasts, identified in places in sandstone packages, are light brown to dark brown, subangular to subrounded, and elongate. Such clasts may also be present in rare, thinly interbedded polymictic conglomerate of core from the northeastern boreholes.
19 Interpretation: The colour of the intercalated sandstone and siltstone unit is evidence of subaerial exposure and a low water table in a predominantly oxidizing environment (Walker 1967; Abdul Aziz et al. 2003; Spalletti and Pinol 2005). Horizontally stratified sandstone (Sh) is interpreted as evidence of high energy flow (i.e., upper plane bed), probably associated with flooding events (Miall 1977; Khalifa et al. 2006; Türkmen et al. 2007). Cross-stratified facies (i.e., Sx, Sp, and St) commonly indicate the waning stage of flooding and decreasing velocity of flows towards lower flow regime conditions (Spalletti and Pinol 2005; Khalifa et al. 2006; Hadlari et al. 2006). Asymmetric current ripples were produced by unidirectional current (Chakraborti et al. 2009; Köykkä 2011), and the climbing shape of these ripples indicates high rates of aggradation (Collinson 1996). Fine-grained facies (i.e., Fl and Fm) represent deposition mostly from suspension (Hadlari et al. 2006; Köykkä 2011).
20 Structureless or massive sediments (i.e., Sm and Fm) are interpreted as having formed under conditions of high rates of suspension settling from currents of moderate to high sediment concentration (Abdul Aziz et al. 2003; Spalletti and Pinol 2005). Other possibilities exist but are less likely. For example, animals and plants are known to have colonized the local landscape by Mississippian times (e.g., Keighley and Pickerill 1994, 2003; Falcon-Lang 2004). Thus, massively bedded siltstones might indicate complete bioturbation of the substrate (Rhoads 1967), but there is no instance of partly bioturbated beds with distinct burrows or roots to suggest soil-forming activity, which would be an odd dichotomy.
21 Soft-sediment deformations (Fd) indicate release of excess pore-water pressure or dewatering (Spalletti and Pinol 2005). Siltstone rip-up clasts are interpreted as a record of high energy flooding and reworking of previously deposited mudstone (Spalletti and Pinol 2005; Köykkä 2011). Inter-bedded sandstone units indicate deposition from unidirectional water flow of both waning velocity (fining-up beds, e.g., McEwen et al. 2011) and increasing velocity (coarsening-up beds, e.g., Heward 1978). The presence of siltstone rip-up clasts indicates downcutting into intraformational sediment, which could be considered evidence of upstream channelization. The small core diameter and many core breaks at the contact between sandstone and mudstone preclude confirmation of downcutting and channelization (i.e., fluvial flow). Although coarsening-upward profiles could represent, for example, prograding fan lobes, crevasse splays, or avulsion belts, they can also be related to base-level changes (Türkmen et al. 2007). Collectively this association of sandstone and intercalated siltstone favours a braidplain or distal alluvial fan setting. Laminated red bed mudstone, with rare nodular carbonate and sulfate but no bioturbation and rhizoconcretions, suggest harsh terrestrial conditions in the floodplain environment: regolith, but no paleosol, development.
Bluish-grey sandstone interval
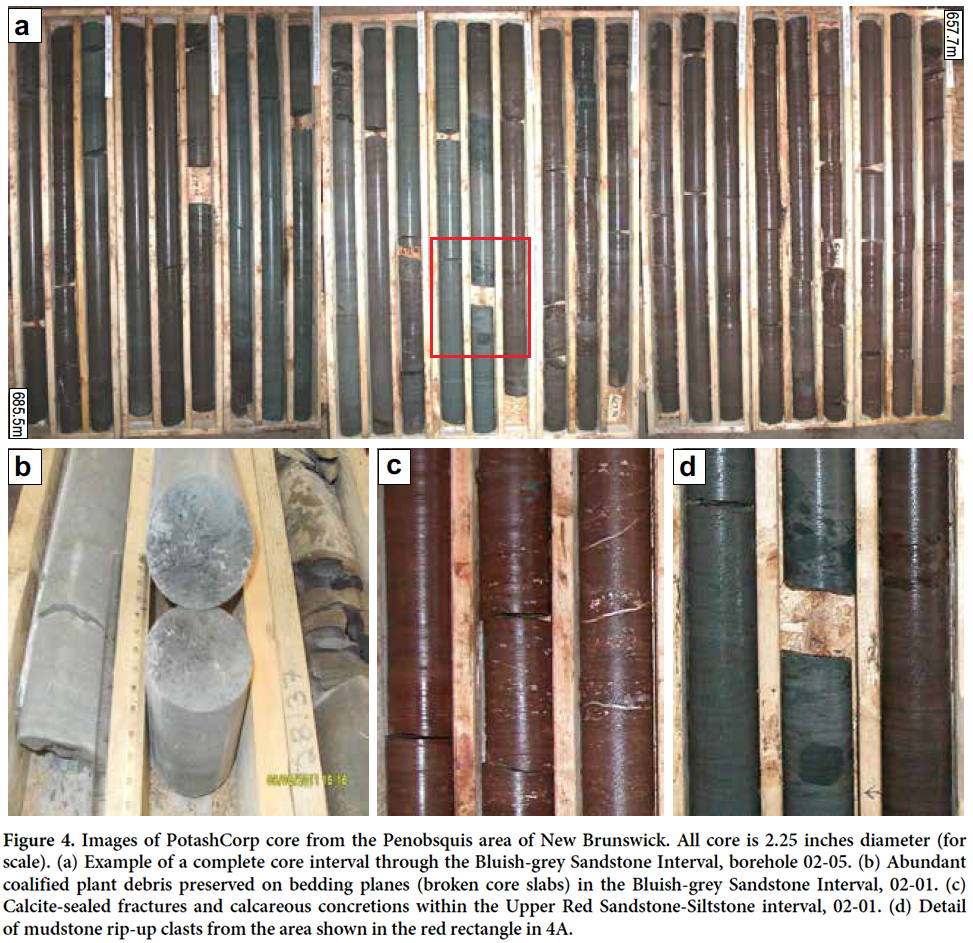
22 Description: This interval is composed of gently dipping (up to 20 degrees) pale brown, brownish-grey, bluish-grey, or mottled grey-brown, occasionally pebbly, fine- to coarse-grained (dominantly medium-grained) sandstone and siltstone. Unlike the under- and overlying intervals, the grey strata may be metre scale in thickness. In the western part of the study area, the thickness of this interval is ~75 m in PCS-06-01 and PCS-02-04, but < 20 m in PCS-02-03 (middle part of the study area). The thickness of the measured sandstone packages range from ~0.5 m to ~12 m and siltstone packages range from ~1 m to ~4 m. Both coarsening- and fining-upward packages are identified (but rarely at the scale that can be illustrated in the summary logs, Fig. 3); however, the interval typically shows an overall coarsening-upward trend (only PCS-02-03 shows a distinct fining-upward trend). The major lithofacies identified are Sh, Sx, and Sp with Fl, St, Sd, and Fm as subordinates. Cross-laminations or ripple cross-laminations (Sx) are asymmetric in profile. Coalified plant fragments (Fig. 4b) are unique to sandstone of this interval, and they were observed in most cores (not PCS-05-04 and PCS-02-03). Except for PCS-02-03 and PCS-04-01 (northeastern part of the study area), some sandstone also contains mudstone rip-up clasts of a size that can exceed the diameter of the core. Where occurring discretely, these clasts are grey, light brown or dark brown, angular to sub-rounded, and typically elongate (Fig. 4d). Again, such clasts may also be one component of several in rare, thinly inter-bedded polymictic conglomerate that occurs in the northeastern boreholes.
23 Interpretation: Broadly, the lithofacies association in this interval is little different from that of the underlying lower red sandstone interval. However, the more extensive grey colour of sediment and the preservation of organic matter suggest waterlogged conditions were sufficiently prevalent that organic, likely plant, matter was preserved, and oxidation of iron did not progress far enough to form haematite (Wright and Sandler 1994; Collinson 1996; Abdul Aziz et al. 2003). However, no roots, burrows, or other clear indicators of palaeosol are present.
24 Across the study area, this interval can be considered to mark a shift to a more permanently high-water table and thus a relative rise in base level, but otherwise still a braid-plain or distal alluvial fan setting. The cause of this rise may be the result of one or a combination of factors; rising lake or sea level (eustacy), tectonism resulting in either relative lake-/sea-level rise, or drainage basin reorganization, a wetter climate. This is further discussed below.
Upper red sandstone-siltstone interval
25 Description: This interval is of gently dipping (~5 to ~30 degrees), reddish-brown, pale brown, and brown, very-fine- to fine-grained sandstone and siltstone, with coarse-grained sandstone also present in PCS-02-05 and PCS-04-01. As in the lower interval, thin greenish- or bluish-grey bands and blotches are irregularly present. In the western part of the study area the interval is ~300 m thick (PCS-06-01), but much thinner (i.e., ~10 m in PCS-02-03, ~40 m in PCS-04-01) in the middle and northeastern parts of the study area. The thickness of the measured sandstone packages ranges from ~0.5 m to ~15 m. As previously, both coarsening- and fining-upward packages are identified. Similarly, the interval shows an overall coarsening-upward trend in most boreholes (Fig. 3). Sandstone predominates in most cores, except for PCS-06-01, PCS-05-04, and PCS-02-04 (western and southwestern part of the study area) where siltstone is dominant. In the sandstone, lithofacies Sh, Sx, Sp, and subordinate Sm are recognized; Fl, Fm, and subordinate Fd are the commonly identified lithofacies in the siltstone. Again, cross-laminations (Sx) are mostly asymmetric in shape, with climbing cross-laminations identified in PCS-02-01, PCS-06-01, and PCS-05-02. Mudstone rip-up clasts, identified rarely in sandstone packages and also in thinly interbedded polymictic conglomerate, are light brown to dark brown, subangular to subrounded, and elongate.
26 Interpretation: This interval is considered to be similar to the distal alluvial fan to floodplain facies association described for the lower red interval, and represent a return to arid, ephemeral flow conditions in the study area. However, predominance of siltstone in the western and southwestern parts of the study area is inferred to represent waning of flood flow followed by suspension deposition (Hadlari et al. 2006; Köykkä 2011).
Red polymictic conglomerate interval
27 Description: This interval is not recorded in logged cores from PCS-02-01 and PCS-02-04 (in the southwestern part), and increases in thickness to over 500 m in PCS-04-01 in the northeastern end of the study area (Fig. 3). The gently dipping beds (up to ~25 degrees) comprise conglomerate packages that are up to ~58 m thick, sandstone packages up to ~14 m thick, and siltstone packages up to ~7 m thick. As with the other intervals, both coarsening- (dominant in this case) and fining-upward sequences exist at different scales. The conglomerate is composed of granule- to pebble-sized, poorly sorted, subangular to subrounded polymictic clasts. Felsic igneous rocks and metamorphic rocks (e.g., schist, gneiss) are the most commonly identified clast types; mud-stone clasts also occur. Matrix-supported conglomerate predominates over clast-supported conglomerate (only identified in PCS-02-03, PCS-02-02, and PCS-05-04). The conglomerate matrix typically consists of reddish-brown to pale brown and medium- to very-coarse-grained sandstone. The commonly identified lithofacies within this interval are Gmg, Gcm, and Sh; subordinate lithofacies are Sx, Sp, and Fm. Asymmetric cross-laminations or ripple cross-laminations (Sx) were identified only in PCS-02-05 and PCS-05-02.
Interpretation: Matrix-supported conglomerate (Gmg) indicates deposition from debris flows where they moved as dense masses and the matrix strength was large enough to transport the clasts (Blair and McPherson 2009). Clast-supported conglomerate (Gcm) is also considered the product primarily of debris flows, rather than fluvial flow, because of the combined lack of imbricate pebbles, cross stratification, and erosion surfaces within beds (Blair and McPherson 1992; Martins-Neto 1996; Sohn et al. 1999), although these absences might simply be a function of observations being restricted by the narrow core diameter. The angularity of the clasts indicates deposition probably close to the source (Köykkä 2011). The poor sorting and polymictic nature indicate that there were a variety of sources for the clasts (Veevers et al. 2007). Gravel beds separated by discontinuous lithofacies Sh, Sp, and Sx indicate that deposition of the sand occurred within gravel frameworks by sediment-laden aqueous currents (Hadlari et al. 2006). Rare fine-grained sediment (Fm) suggests that distinct flow events alternated with low energy fallout deposits of episodic floods (Spalletti and Pinol 2005). Thicker bedded conglomerate to the northeast indicates that the alluvial fan apex was located in this direction. Overall coarsening- and thickening-upward sequences suggest active alluvial fan progradation and outbuilding (Heward 1978; Türkmen et al. 2007).
CHEMOSTRATIGRAPHY
28 The grey sandstone interval is a distinct stratigraphic marker in the study area, the base of which, as interpreted, marks a shift in depositional conditions. The bulk geochemical data collected (from PCS-02-01, PCS-05-04, and PCS-02-05) can be used to statistically test whether the base of the grey sandstone interval is also a distinct chemostratigraphic horizon. Simply, for comparison of variances and mean values, the null hypothesis can be tested against its opposite:
H1:Hupper interval ≠ Hlower interval
where below the base grey sandstone interval is considered as ‘lower interval’, and the base grey sandstone interval and above are considered as ‘upper interval’. Significance was set at α= 0.05 in all analyses. Differences in correlation coefficients and simple regression equations (with SiO2 as the explanatory variable) provide additional comparisons.
29 Geochemical data can be presented in different ways, including simple plots of specific elements against depth or location, and scatter plots (Harker diagrams and discriminant plots) of two elements or two computed groups of elements, e.g., to identify provenance. In the selected plots presented herein (Figs. 5 to 9), data from the lower interval are coloured blue, and data from above the base of the grey sandstone interval are coloured red.
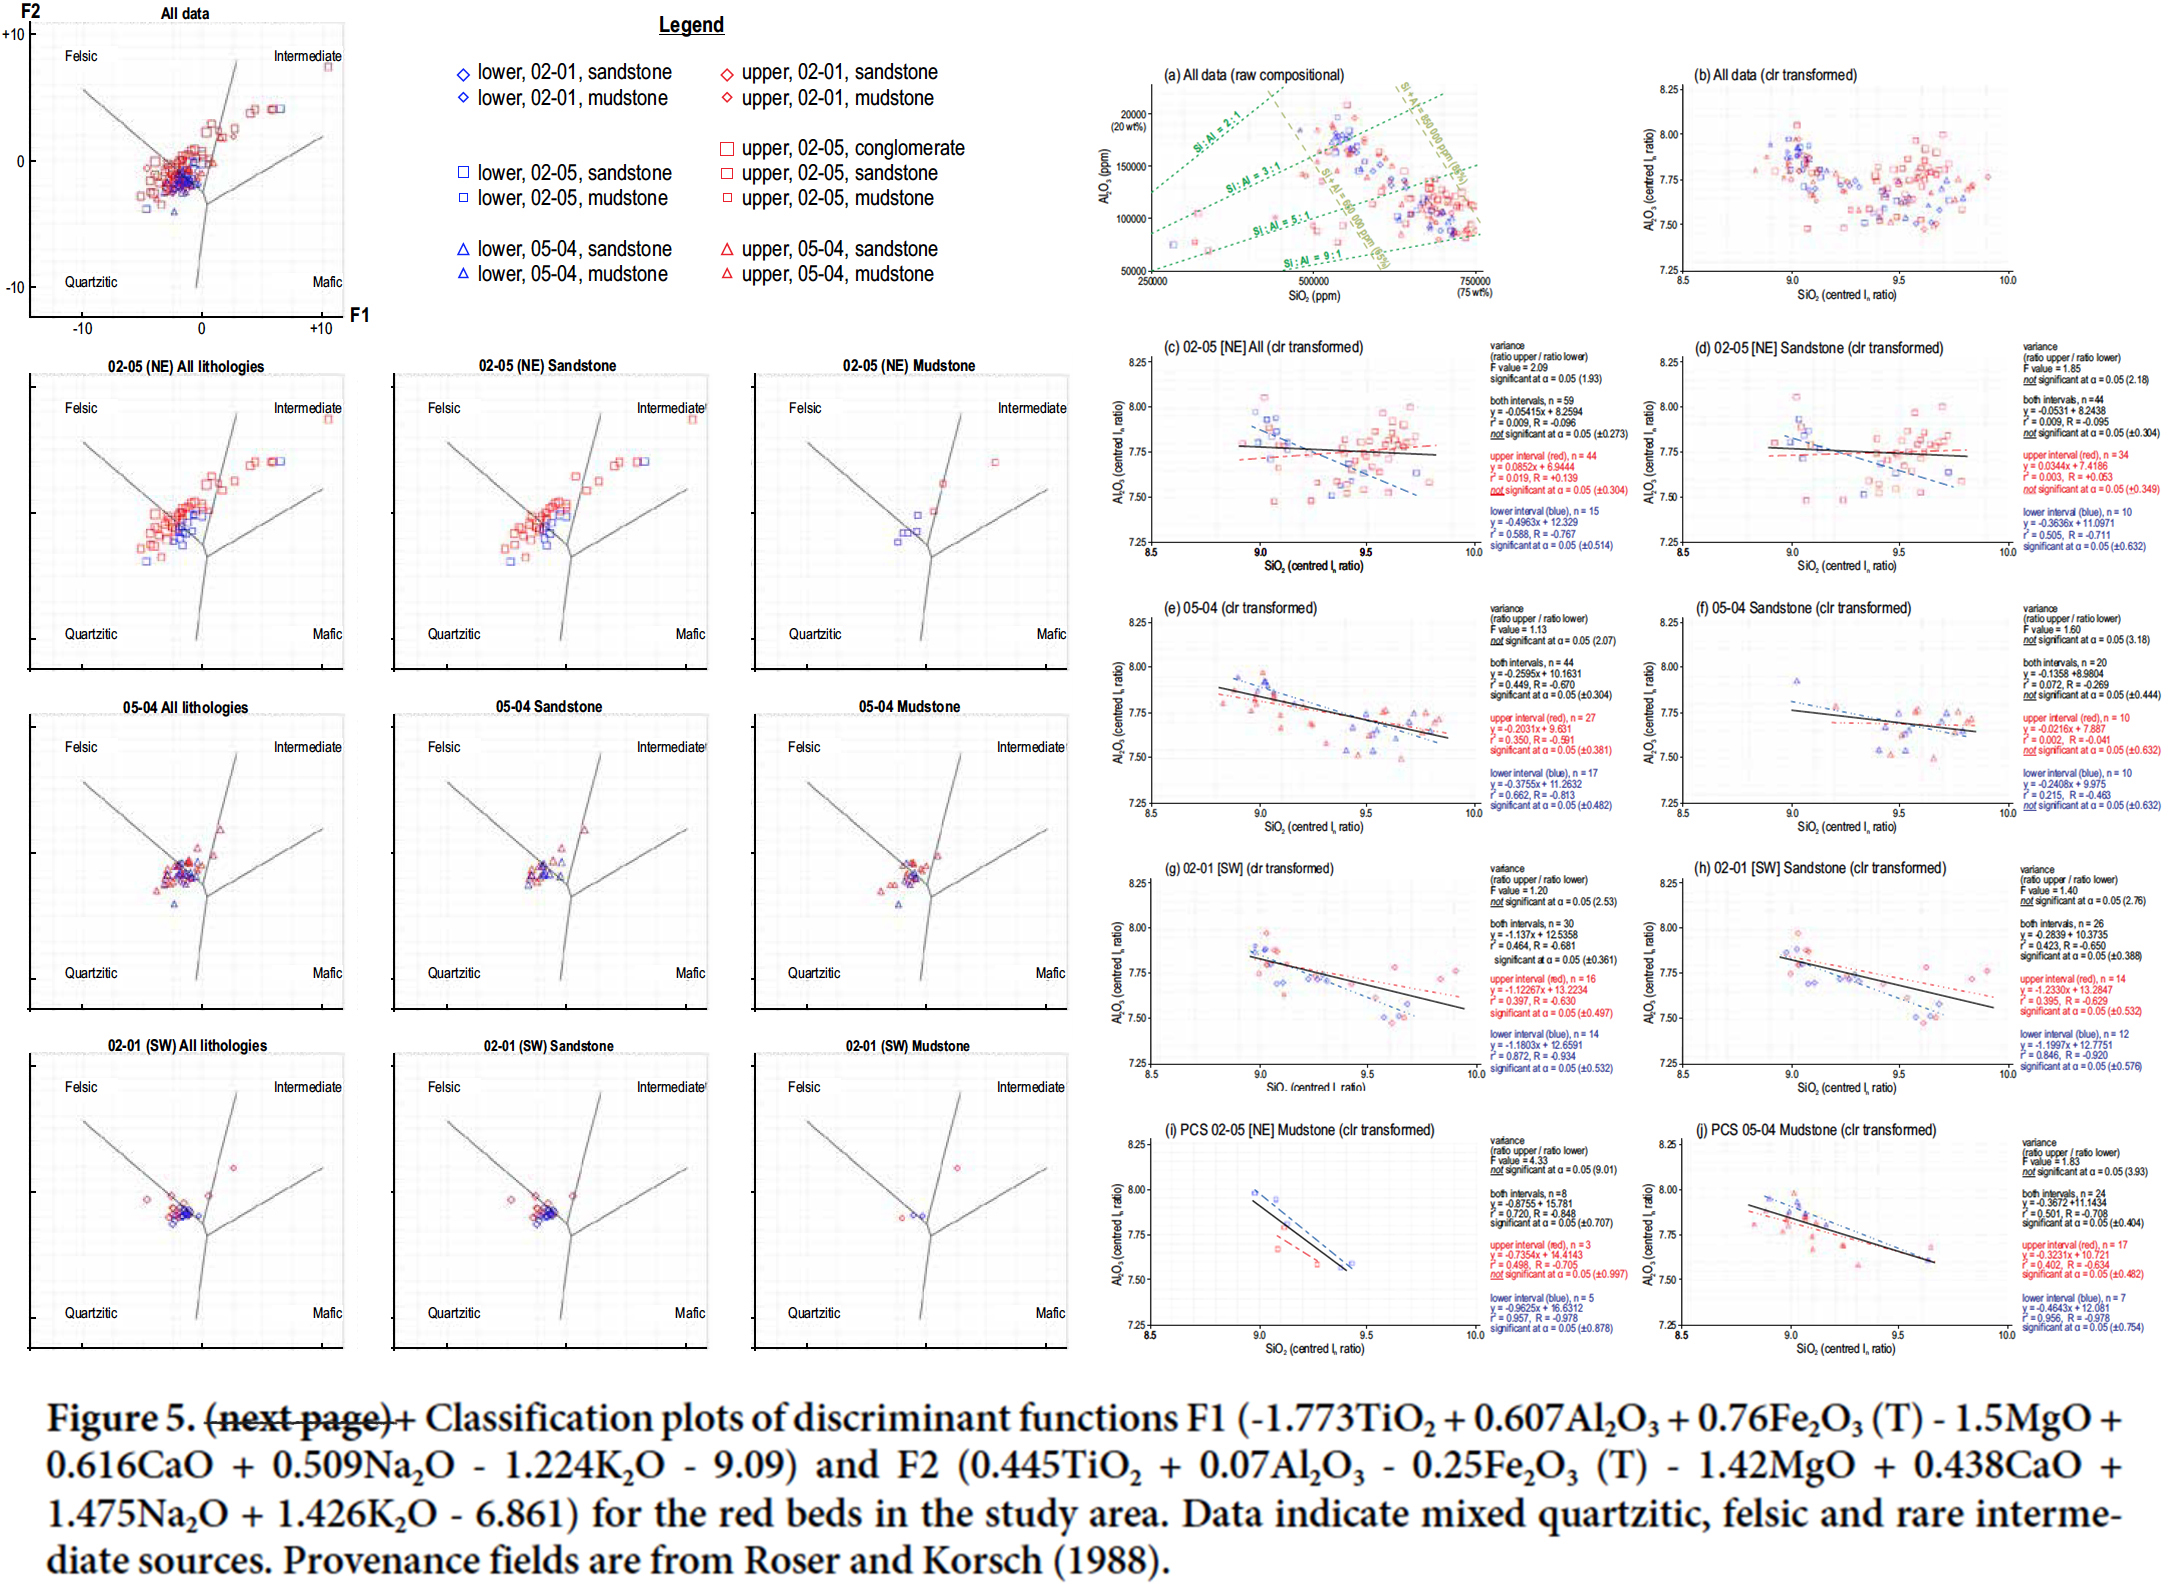
Provenance
30 Results: The provenance diagrams of Roser and Korsch (1988) were developed from a principal component analysis of several major elements measured from sandstone and mudstone of readily determinable provenance. The plots of provenance for the Sussex boreholes indicate that the red beds are of mixed quartzitic, felsic, and rare intermediate source (Fig. 5). They also suggest a difference between upper and lower interval samples. Materials from the lower interval are more tightly constrained and plot to the lower right of the data from the upper interval. The plots also suggest that the distinction might be most pronounced in the material from core PCS-02-05. It appears that these provenance graphs were first constructed using non-transformed data and so statistical analyses to test the similarity of upper and lower intervals were not performed using our data. Instead, the suggestion of a difference between the upper and lower interval is further investigated using transformed (centered log ratio) data of paired elements below. These further investigations are undertaken critically because Pe-Piper et al. (2008) noted that bulk geochemical approaches to provenance analysis of the terrigenous sedimentary rocks lack a globally applicable set of element discriminants.
31 Interpretation: The provenance plots are indicative of a more restricted suite of minerals, which consist of a higher mafic component, in the lower interval relative to the upper interval. Also, such a distinction may be more pronounced in the more proximal, NE part of the study area.
 Display large image of Figure 5
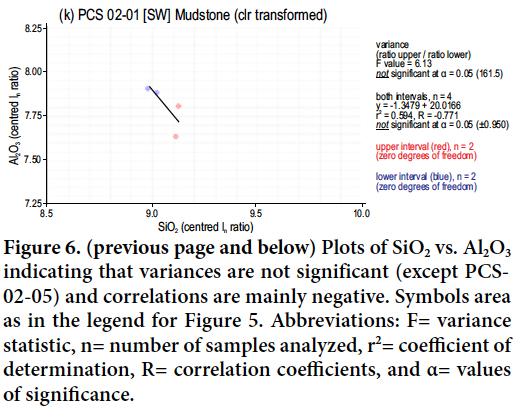
SiO2:Al2O3
32 Results: For SiO2 plotted against Al2O3, the raw data from the Sussex boreholes indicate that Si and Al are the two dominant elements, representing between 65% and 85% of the total composition (Fig. 6a). The four outliers, from PCS-05-04, represent the samples with the highest Ca abundance. For the transformed data, a significant difference in the variance of the Si:Al ratios between the upper and lower intervals is identified only in PCS-02-05 (all lithologies combined, Fig. 6c). However, with the exception of the upper interval in PCS-02-05, there is a significant negative correlation both in the upper and lower intervals. A similar pattern is present when the data are subdivided on lithologic character (Figs. 6d to k). The random sampling program did not result in sufficient mudstone samples for statistical analysis.
33 Interpretation: Silica (Si) and aluminum (Al) are major elements in many of the same common sedimentary minerals, in a ratio of ~3:1 for K-feldspars and ~1:1 for anorthite or kaolinite. A mix of kaolinite and K-feldspar, or of other clays and micas (typically also with Si:Al ratios between 3:1 and 1:1) in different samples would give increasing scatter somewhere between 3:1 and 1:1. However, some common Si-bearing minerals lack Al, e.g., quartz, zircon, and titanite. Samples also containing an increasing proportion (with respect to the Al-silicates) of these latter minerals would plot closer to the Si axis and produce even greater scatter. Therefore, viewing the data as a whole, the red beds can be considered a mix primarily of Si-minerals and subordinate alumino-silicate minerals.
34 Elemental abundances are typically reported as weight proportions (in % or ppm), and so are subject to the constraint: xSi + xAl (… + xD) = 100% (Aitchison 1986). For non-transformed data, the sample space is confined below the negative gradient line of closure (Aitchison 1986), which in a plot of Si:Al runs from 0Si:100Al through to 50Si:50Al, (pure kaolinite or similar), and down to 100Si:0Al (pure silica). Different abundances of (alumino-) silicates in the samples trend left and below the closure line. Accordingly, even though it is likely Al always positively associates with Si (i.e., Al always occurs in an alumino-silicate mineral), the closure effect in a compositional dataset promotes a negative association between these two predominant elements (Davis 2002): any increase in the amount of quartz must correspond to a decrease in the amount of alumino-silicate.
35 As noted in the sedimentology, the upper interval contains more abundant coarser-grained lithologies. This is a potential source of bias, as quartz tends to concentrate in the coarser fraction (Korsch et al. 1993). But samples above and below the base of the grey interval exhibit a negative gradient, indicating that both high and low Si:Al ratios occur throughout the succession. Most importantly, the transformed data (Fig. 6) display more limited scatter about the regression line and significant negative correlations for the lower samples compared to the upper interval. Although the trend is not ubiquitous, it suggests less variable compositions and fewer minerals in the lower interval in all wells, regardless of grain size.
 Display large image of Figure 6
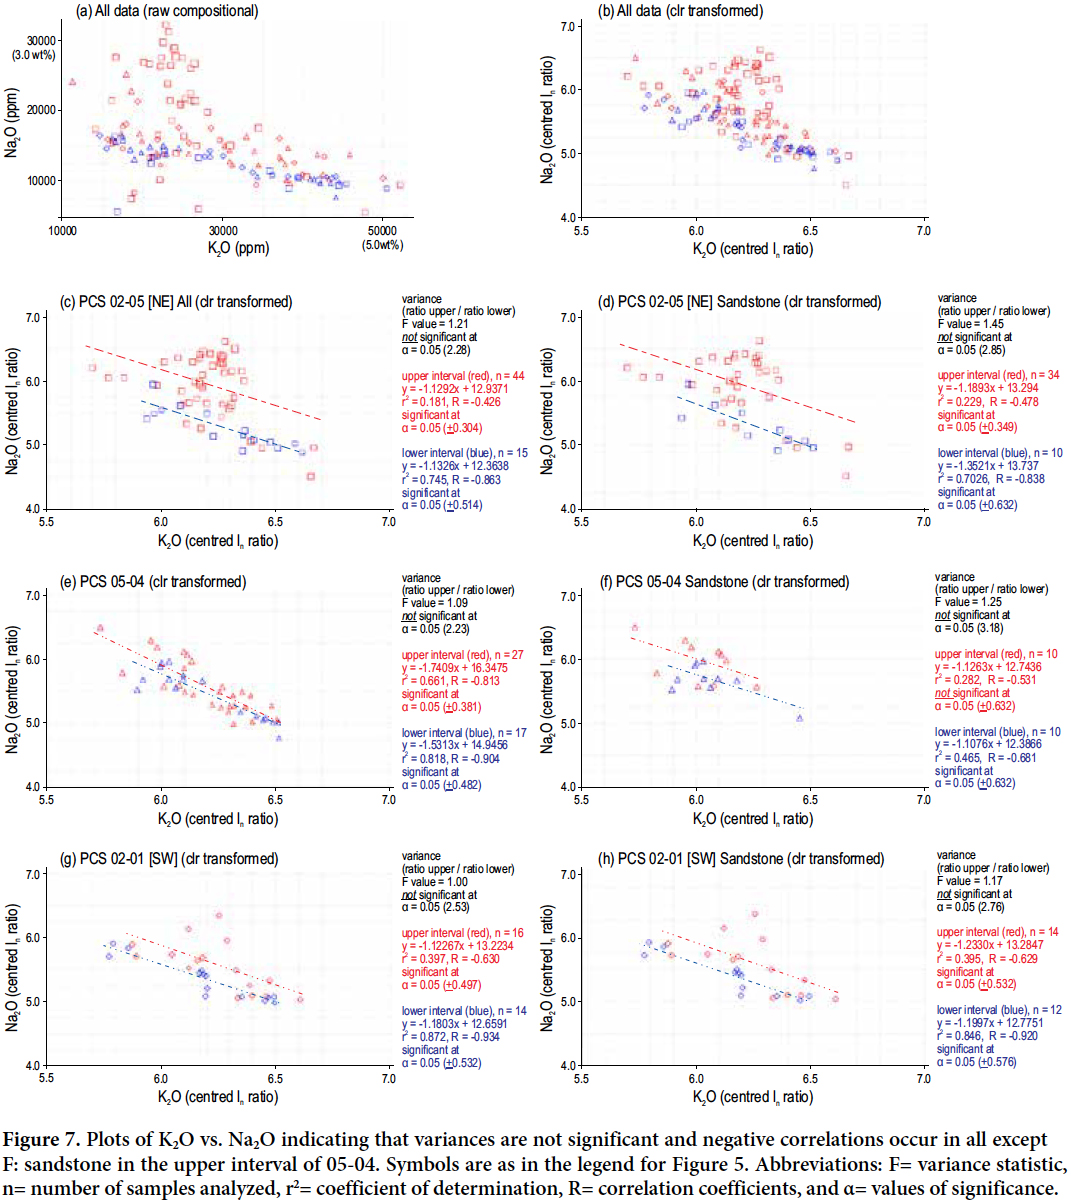
K2O:Na2O
36 Results: When Na2O is plotted against K2O, no significant variances are noted. For all lithologies (Figs. 7c, e, g) there is a significant negative correlation to the data in the lower and upper intervals for all three boreholes, with Na content typically being less in the lower interval of each borehole. The same pattern is present in plots of sandstone lithologies (Figs. 7d, e, h), although correlations are significant in all cases except for the upper interval of PCS-05-04.
37 Interpretation: The Na2O vs. K2O scatter plot is commonly used in chemostratigraphic studies, but typically with K and Na expressed as ratios of Ti (whereby spurious correlations can be created if the data have not been transformed; Roll inson 1993; Davis 2002). The plot is generally considered to reflect the proportion of albite to anorthite feldspar, and of clay minerals montmorillonite to illite (Sabaou et al. 2009). Higher Na values in the upper interval suggest a greater ratio of albite (Na-rich) in the feldspar component and probably more mafic rock (e.g., gabbro and basalt) weathered in the source. As previously noted, for the major oxides, the effect of data closure is what controls the negative trend.
 Display large image of Figure 7
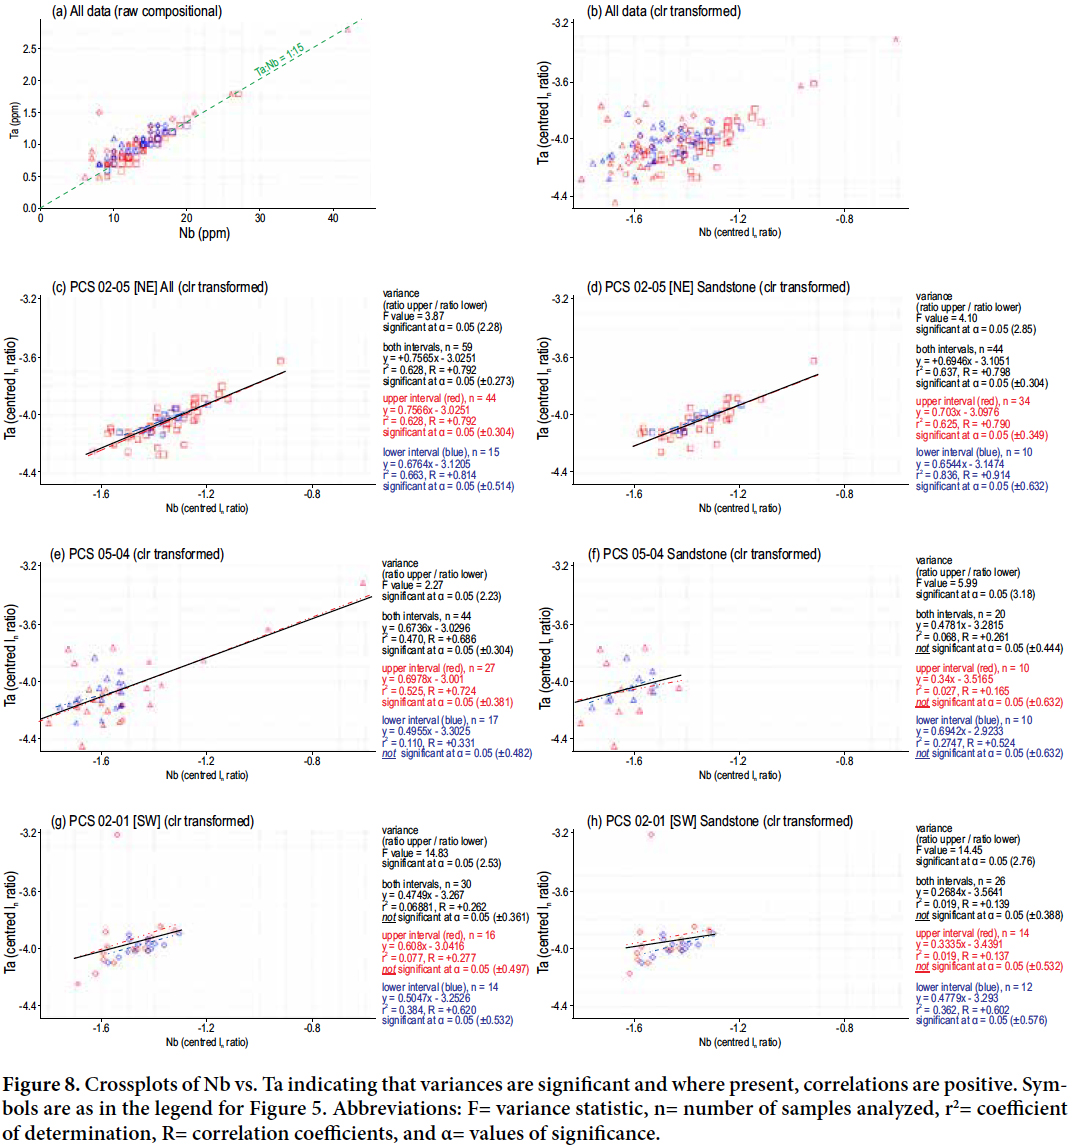
Nb:Ta
38 Results: Raw data show the ratio of Nb:Ta is ~15:1 (Fig. 8a). Significant variance in this ratio occurs between the upper and lower intervals in all wells (greater data spreads exist in the upper interval). However, there is only a significant positive correlation coefficient between the two elements in PCS-02-05 and for the lower interval in PCS-02-01 (for the plot of all lithologies, the three outliers of mudstone influence the significant correlation in PCS-05-04).
39 Interpretation: Nb and Ta are typically enriched in felsic igneous rocks (Yang et al. 2008) and these elements are known to substitute in rutile (Pearce et al. 2005; Meinhold, 2010; Tonje et al. 2013). Also, in silicic magma, the concentrations of Nb and Ta closely covary with the concentration of TiO2 and the ratio of Nb/Ta decreases as the magmatic composition becomes less mafic and more silicic (Zhou et al. 2000). However, the variation in Nb should be considered when bulk geochemical data are analyzed in sandstone (Pe-Piper et al. 2008). In this study, for sandstone samples, variances are different between the upper and lower intervals indicating that the upper interval can have both more mafic and more silicic provenance components relative to the lower interval.
 Display large image of Figure 8
TiO2:Cr
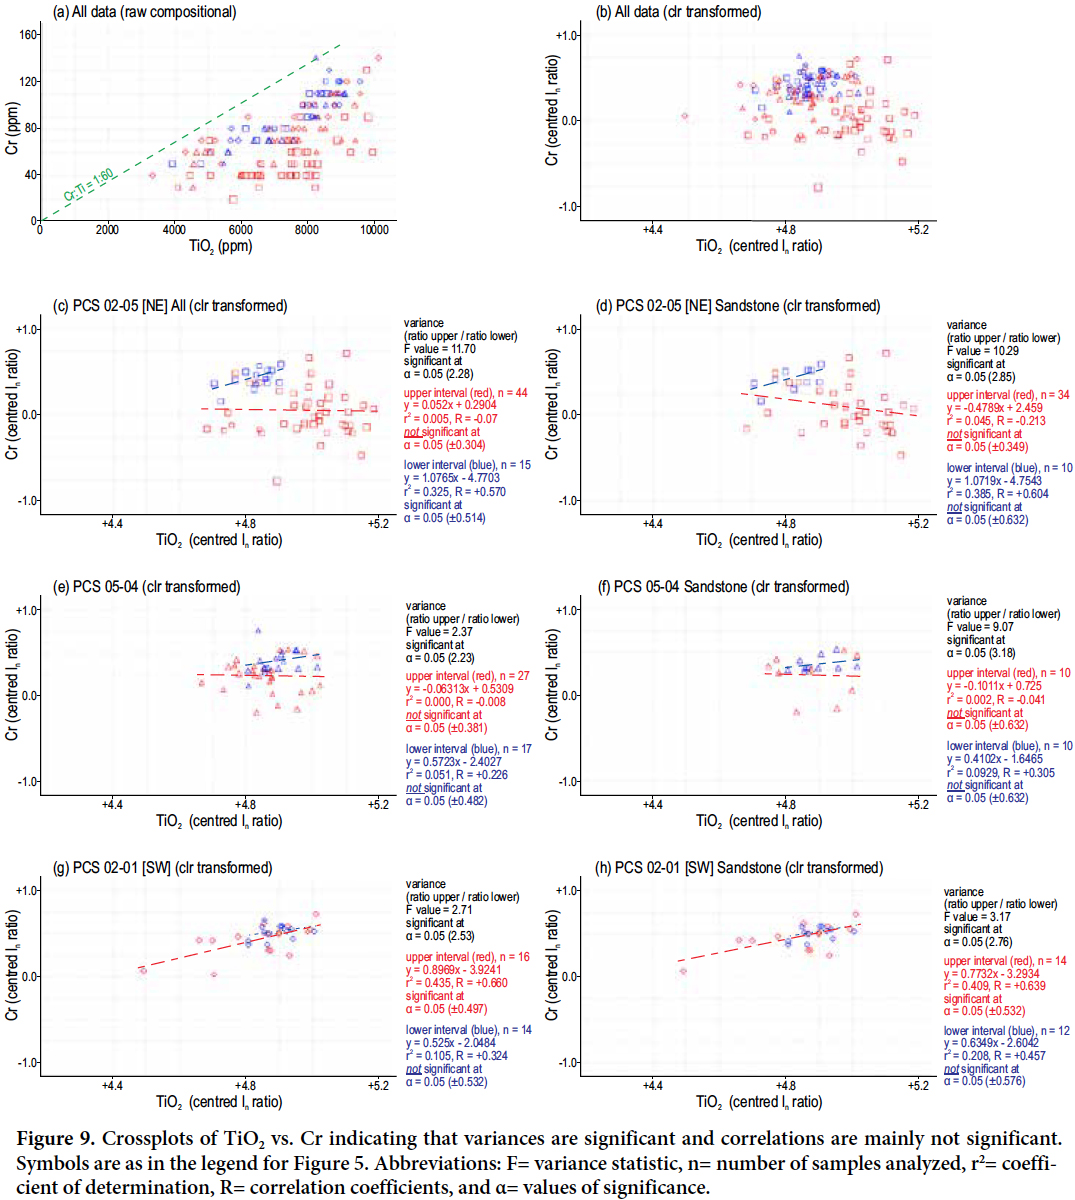
40 Results: When TiO2 is plotted against Cr (Fig. 9), the raw data indicate that Cr values are never greater than ~1/60 TiO2 values. Correlation coefficients are rarely significant (e.g., upper interval in PCS-02-01) because Cr shows little variation with respect to TiO2. However, differences in the variance of the TiO2:Cr ratio are significant in all wells, whether for all lithologies combined, or for sandstone only. Cr values are typically lower in the upper interval whereas TiO2 values are more variable and decrease from northeast to southwest in the upper interval.
41 Interpretation: The ratio of Cr:TiO2 in the estimated average composition (Lentz 2003) of continental crust (~1:53) and North American Shale Composition (~1:63) is compatible with the present observations. However, whole-rock concentrations of TiO2 and Cr are controlled primarily by the abundances of the heavy minerals, e.g., chrome-spinel for Cr and rutile for TiO2 (Preston et al. 1998; Pearce et al. 2005; Meinhold 2010; Ratcliffe et al. 2010; Tonje et al. 2013). Also, Cr is more likely associated with the mafic-derived heavy minerals (Garver et al. 1996; Pearce et al. 1999; Ratcliffe et al. 2010). The concentration of TiO2 is controlled by the composition of different types of magma (Ti more enriched in mafic magma) and TiO2 tends to be enriched in the residual phases during weathering (Zhou et al. 2000). The absence of significant correlations suggests that elemental con centrations are not only a factor of the heavy mineral phase, but also of several other mineral phases, e.g., feldspars and clay minerals. Lower Cr values in the upper interval compared to the lower interval indicate that the upper interval had low to moderate mafic and more felsic influence in the source region. Variation in TiO2 concentration in the upper interval may be due to the degree of mixture of varied source material or provenance change. Thus, the variability of Cr and TiO 2 is related to polycyclic origin, e.g., mixing of heavy mineral phases and sediment recycling. St. Peter and Johnson (2009) previously reported the presence of a Ti-Fe placer deposit ~25 km SE of Moncton in Hopewell Cape Formation (Mabou Group) strata, which they interpreted to reflect reworking of what would have been an uplifted, but now-buried, Ti deposit in Devonian(?) anorthosite.
 Display large image of Figure 9
DISCUSSION
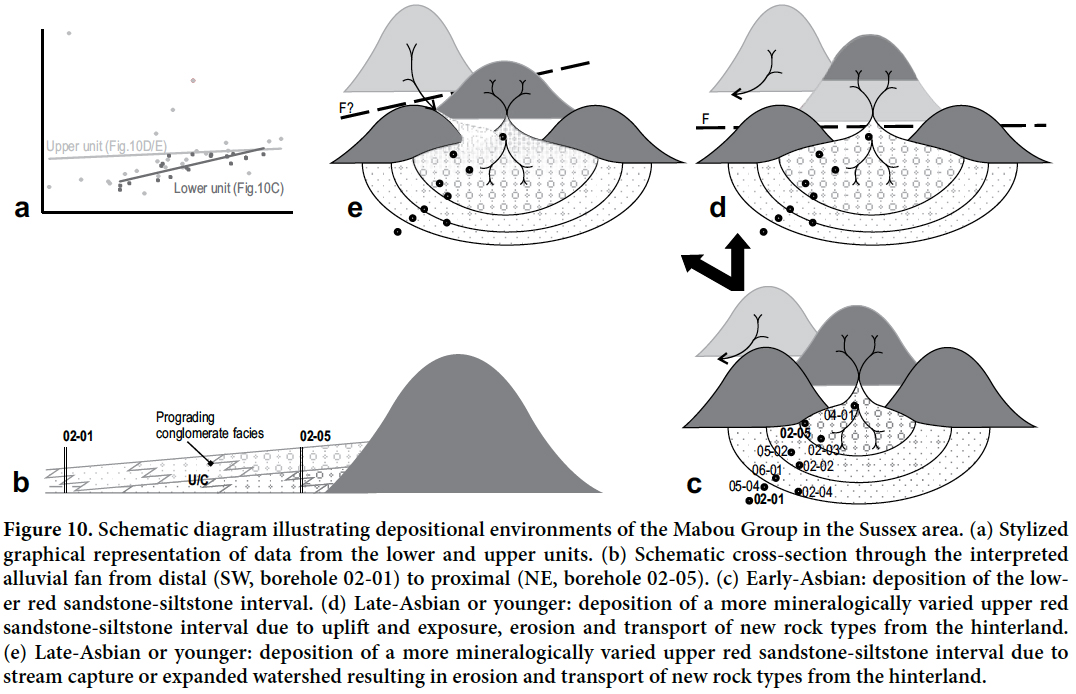
42 The general lithofacies distribution in the studied boreholes suggests an alluvial fan to floodplain model, with the proximal fan located toward the northeast (Figs. 3, 10). Over time, the conglomerate units were able to prograde further toward the southwest. Of particular interest, however, is what we demarcate as the “bluish-grey interval”, where exists a distinct combination of metre-scale bluish-grey beds of sandstone (non-red zones exist elsewhere but not at this scale), red or grey mudstone pebbles (i.e., rip-up clasts – also present, but to a lesser extent, at other stratigraphic levels) and, unique to this interval, plant detritus. As previously noted, preservation of plant fragments and patchy grey colouration indicate a more prevalent reducing environment. The presence of rip-ups suggests associated incision and reworking by channelization. This could be related to a rise in the water table (the terrestrial proxy for ‘base level’), either related to relative sea- or lake level rise or simply a wetter climate resulting in more perennial discharge. The geochemical data above and below the base of the bluish-grey interval in addition indicate significant differences in the elemental compositions that likely reflect more varied provenance in the younger strata. This change could be due to gradual unroofing of additional rock types in the hinterland drainage basin.
 Display large image of Figure 10
43 In seismic profiles that cross the study area (Wilson and White 2005; fig 3b in Keighley 2008) a mid-Mabou angular unconformity, passing south into a (dis-) conformity can be picked, ~300–400 m above top Windsor, to the north of the subsurface Windsor-salt diapir (Fig. 1c). The Mabou Group is everywhere poorly imaged south of the diapir in the study area, but the bluish-grey interval might sit on the same unconformity south of the diapir. If so, rip-up clasts may be the result of vertical, rather than lateral, incision due to relative base-level fall; the reducing environment was potentially the result of base-level rise during subsequent infill of the incised valley. The lack of any distinct change in the dips of beds in PCS cores from above and below the base of the grey-coloured interval favours a disconformable contact, but the limitations of assessing minor changes in bedding from core material cannot rule out an angular boundary. Elemental geochemistry indicates a more varied suite of detrital minerals above the base grey-coloured interval (i.e., above the unconformity). This is indicated in the provenance plots and the goodness of fit to regression lines of Si:Al and K:Na, and statistically confirmed in f-tests of variance of Nb:Ta and Ti:Cr ratios between upper and lower intervals (Figs. 5 to 9). If tectonic uplift was involved in producing the unconformity, more varied source rocks could have been unroofed, weathered, and eroded from the hinterland. Alternatively, stream capture producing a larger hinterland exposing more varied lithologies may have resulted from uplift, or simply wetter climatic episodes, related to renewed relative base level rise following the development of the unconformity (Fig. 10).
44 Two different lithostratigraphic interpretations of the succession are possible. First, the grey sandstone interval, not previously recognized in outcrop in the Sussex area, may be considered equivalent to the Shepody Formation in the far southeast of New Brunswick. The lower red sandstone-siltstone interval would then be equivalent to the Middleborough Formation (syn. Maringouin Formation), and the upper red beds possibly equivalent to the Enragé Formation. In the type sections (southeastern New Brunswick), the thicknesses of the Maringouin, Shepody, and Enragé formations are ~496 to ~700 m, ~200 to ~330 m, and ~100 to ~150 m, respectively (St. Peter and Johnson 2009). If this interpretation is accepted, it would be the first indication in the Moncton Basin of a base-Shepody Formation disconformity, as Gussow (1953) previously identified an unconformity that he associated with the top of the formation. However, in contrast to the type sections, thicknesses of the equivalent ‘formations’ are quite different in the study area: ~220 to ~97 m, ~75 to ~7 m, and ~300 to ~10 m, respectively.
45 Alternatively, where the Windsor Group is more extensively exposed in Nova Scotia, five transgressive-regressive cycles are delineated (Giles 2009). Interfingering red bed intervals can be more than 250 m thick (Ryan and Boehner 1994), and a major unconformity is identified in the Asbian. Contrastingly, in the Moncton Basin, no late-Asbian (cycle II, e.g., Lime-kiln Brook Formation) and post-Asbian (cycle III to IV) Windsor Group carbonates or evaporites are known (St. Peter and Johnson 2009): the Lime-kiln Brook Formation is present only in the far SE part of New Brunswick in the Cumberland Basin (Fig. 2; Craggs et al. 2017). If the final marine regression of the Windsor Group sea in the Moncton Basin took place before the development of the Asbian unconformity, then an alternative lithostratigraphy for the Sussex area could be that the lower red bed unit, although by definition Mabou Group (lying above the uppermost preserved limestone), may be a Windsor Group cycle I landward equivalent. The capping grey sandstone and upper red beds would be cycle II transgression and regression equivalent or younger (Fig. 10), and strata equivalent to the Shepody Formation would, if ever deposited, overlie the studied section. Red beds disconformably underlying grey and plant-bearing sandstones have also been considered Windsor Group equivalent in Québec, where they have been assigned to the Percé Group (Jutras et al. 2001; Jutras and Prichonnet 2005). Although the latter interpretation is favoured, a final decision as to the most appropriate lithostratigraphy is still considered premature, because the unconformity has still not been mapped (and confirmed) in outcrop.
SUMMARY
46 One of the main constraints on previous studies of the red bed succession assigned to the Mabou Group of New Brunswick has been limited data due to poor outcrop exposure. However, access to nearly 5 km of recent drill cores from 11 boreholes has allowed sedimentological logging of several hundred metres of a continuous red bed succession. The succession can be divided into four intervals, i.e., the lower red sandstone-siltstone interval, bluish-grey sandstone interval, upper red sandstone-siltstone interval, and red polymictic conglomerate interval. The lower three intervals are interpreted as braidplain or distal alluvial fan deposits. The conglomerate interval indicates predominately debris flow alluvial fan deposits. The bluish-grey sandstone interval is associated with relative base level change that may simply be related to climate change or possibly to the development of a disconformity at its base.
47 A disconformity within post-Windsor Group red beds is supported by whole-rock geochemistry of 131 samples from three of the drill holes. Elemental variations observed through analysis of major element oxides and trace elements suggest a more varied or mixed provenance above the grey-coloured sandstone interval. For example, Nb:Ta and Ti:Cr ratios indicate a significant difference in the variance between upper and lower intervals.
PotashCorp, and particularly project contacts Brian Roulston, Arnfinn Prugger, and Colin MacDonald, are thanked for funding the study and for permission to publish. Activation Laboratories Ltd., Ancaster, Ontario, undertook the geochemical analyses. Two anonymous reviewers provided many constructive comments that have significantly improved the manuscript, which originated as the main part of the first-named author’s M.Sc. thesis at the University of New Brunswick.
Appendix
 Display large image of Appendix ANotes: data in ppm; ss = sandstone; st = siltstone or finer grained.