Articles
Seafloor pockmarks and gas seepages, northwestern Bay of Fundy, New Brunswick, Canada
ABSTRACT
Bathymetric images of linear and circular pockmark depressions on the Bay of Fundy seafloor, offshore eastern Canada, are interpreted to have been caused by escaping gas from underlying sediment or bedrock. Shallow interstitial gas within marine sediments restricts seismic reflection imaging (acoustic masking) of sub-bottom units resulting in obscured reflections within seismic profiles, confirming that interstitial gas is present in the underlying units. Pockmark fields are frequent in several bays and shallow coastal areas along the northern coast of the Bay of Fundy. The largest field containing over 10 000 pockmarks occurs in Passamaquoddy Bay, an estuary underlain by igneous and metamorphic bedrock. These features are interpreted to be caused by generation of biogenic methane from the microbial breakdown of organic matter buried within Holocene-age sediments and along the underlying Pleistocene/Holocene unconformity. The unconformity is recorded as a distinctive horizon that represents a time when glacier recession resulted in exposure of parts of the bay to sub-aerial erosion and growth of terrestrial vegetation at locations subsequently submerged by post-glacial transgression. Three areas of potential thermogenic gas occurrence were identified in seismic profiles collected south and east of The Wolves islands, New Brunswick. The underlying bedrock has not yet been precisely mapped, although outliers of Carboniferous-age bedrock that is the major petroleum source in New Brunswick may extend into this area of the Bay of Fundy.
RÉSUMÉ
Selon des images bathymétriques montrant des cavités linéaires et circulaires sur le plancher océanique de la baie de Fundy, au large de la côte est du Canada, on estime que celles ci ont été causées par des fuites de gaz provenant de sédiments sous-jacents ou du substrat rocheux. La présence de gaz interstitiel et de sédiments marins en faible profondeur restreint l’imagerie par réflexion sismique (masquage acoustique) des unités sous-jacentes, ce qui occasionne des coupes sismiques obscures et confirme la présence de gaz interstitiel dans les unités sous-jacentes. Les champs parsemés de dépressions coniques sont fréquents dans plusieurs baies et zones peu profondes sur la côte nord de la baie de Fundy. Le champ le plus vaste, qui compte plus de 10 000 dépressions, se trouve dans la baie de Passamaquoddy, un estuaire dont le substrat est composé de roches ignées et métamorphiques. On estime que ces caractéristiques sont attribuables à la production de méthane biosynthétique découlant de la décomposition microbienne de matières organiques enfouies dans des sédiments de l’Holocène et au niveau de la discordance sous-jacente du Pléistocène et de l’Holocène. La discordance est consignée comme un horizon distinct qui représente une période où le retrait des glaciers a exposé des zones de la baie à l’érosion subaérienne et a entraîné la croissance d’une végétation terrestre à des endroits qui ont par la suite été submergés en raison de la transgression post glaciaire. Trois zones d’occurrence possible de gaz thermogénique ont été repérées dans les profils sismiques saisis au sud et à l’est de l’archipel des Loups, au Nouveau Brunswick. La cartographie précise du substrat rocheux n’a pas encore été établie; toutefois, le substrat rocheux du Carbonifère, qui constitue la principale source de pétrole au Nouveau-Brunswick, pourrait s’étendre à ce secteur de la baie de Fundy.
[Traduit par la redaction]
INTRODUCTION
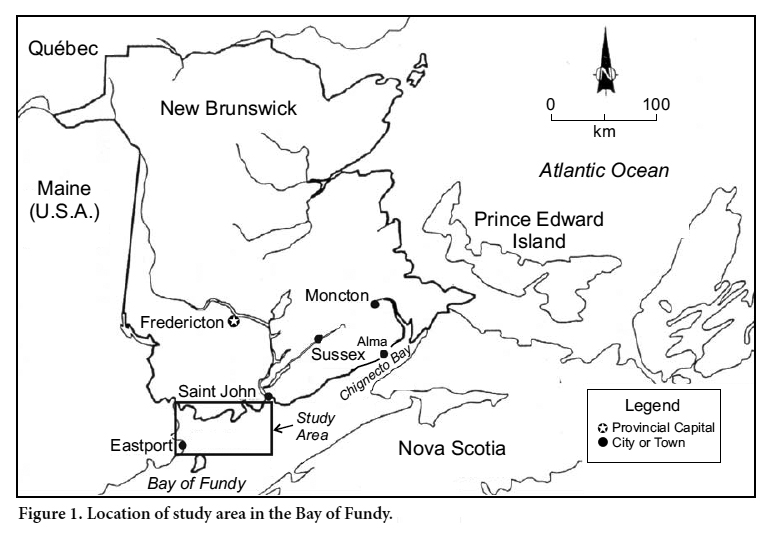
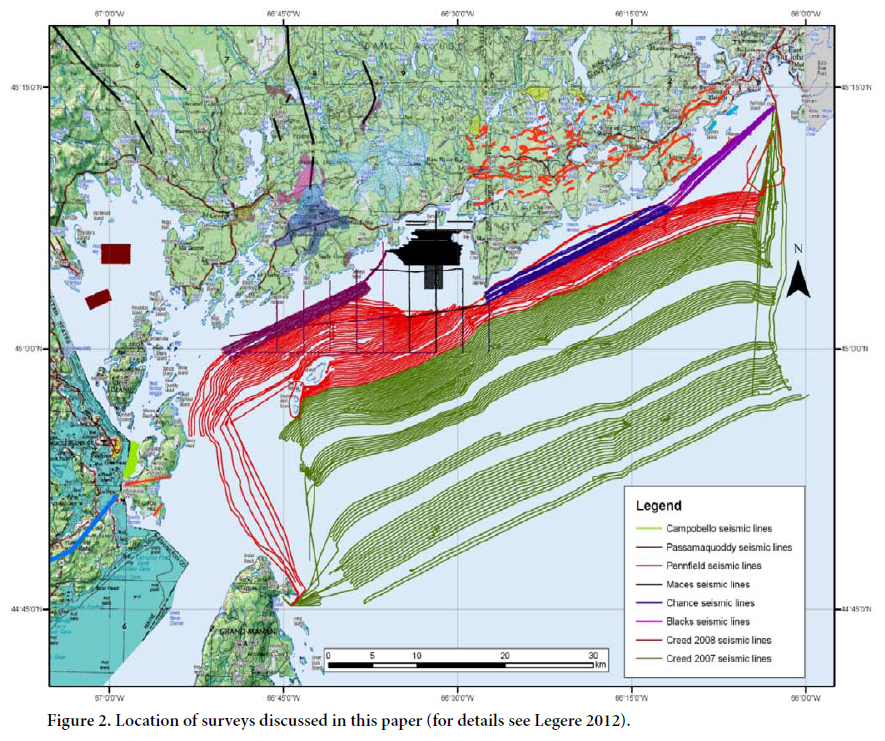
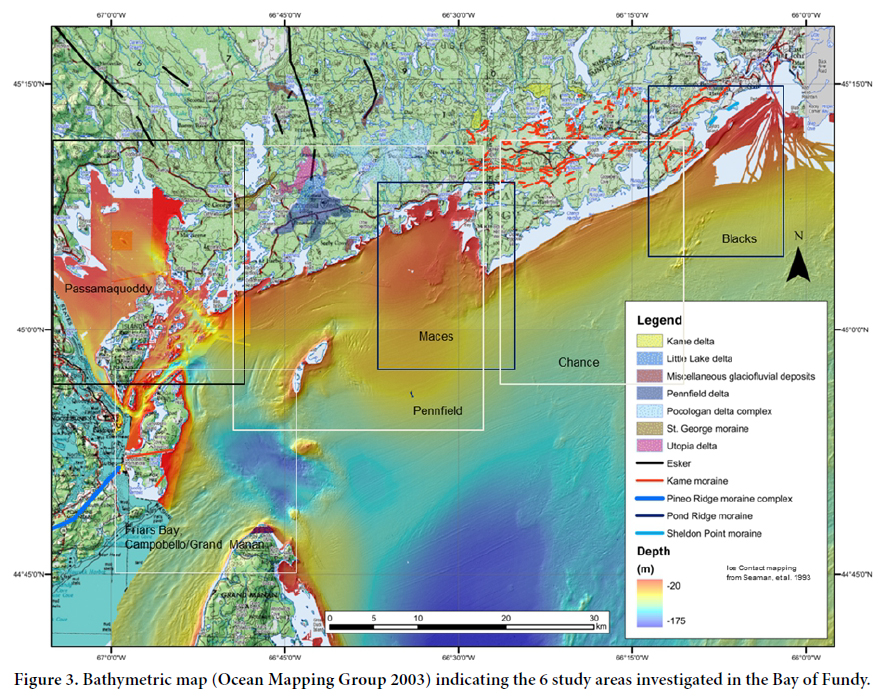
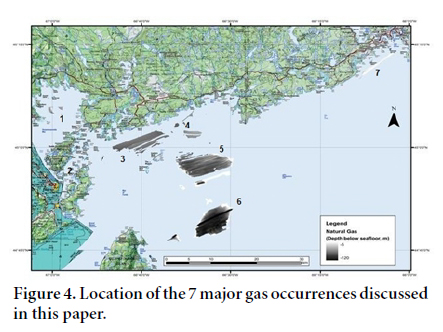
1 The Bay of Fundy (BOF), a branch of the Gulf of Maine (GOM), is a linear water body trending northeast between New Brunswick and Nova Scotia in eastern Canada (Fig. 1). Between 2006 and 2009 the Geological Survey of Canada at the Bedford Institute of Oceanography in conjunction with the Canadian Hydrographic Service (CHS) and the Ocean Mapping Group (OMG) at the University of New Brunswick conducted a mapping program for the Bay of Fundy (Ocean Mapping Group 2003). Geophysical data were acquired during cruises conducted by the GSC Atlantic, CHS and OMG from 2007 to 2009 with the research vessels CSL Heron and CCGS Frederick G. Creed. Bathymetry and stratigraphic profiles were defined from multibeam bathymetric surveys and 427 3.5kHz sub-bottom profiler lines representing over 6500 km of seismic track lines of the northwestern Bay of Fundy between Eastport, Maine and Saint John, New Brunswick (Figs. 1, 2). A secondary data set containing seismic lines and backscatter data from the CCGS Frederick G. Creed cruise of 2007 enabled limited examinations offshore of the primary study areas for locations of natural gas (Legere 2012; Broster and Legere 2016a). These data-enabled interpretations of the character, thickness of units, stratigraphy, landforms, and natural gas occurrences presented here. For the present study, the BOF data were examined in detail in six primary areas in the study area designated as (1) Campobello, (2) Passamaquoddy, (3) Pennfield, (4) Maces Bay, (5) Chance and (6) Blacks (Figs. 1, 3). Sub-seafloor gas was detected at seven sites (Fig. 4) but only areas interpreted to have significant subsurface occurrences of natural gas are discussed here.
 Display large image of Figure 2
Seafloor features indicating subsurface gas
2 Linear and circular depressions, or ‘pockmarks’, are a common feature recorded in bathymetric images of the Bay of Fundy seafloor and are considered by many to be important indicators of escaping gas. A dense distribution of pockmarks covering the seafloor was first reported by King and MacLean (1970), who described them as “concave, crater-like depressions that occur in profusion on mud bottoms across the Scotian Shelf”. Subsequently, pockmark fields have been described worldwide on a variety of geologic settings from oceans, seas and some lakes (e.g., Hovland and Judd 1988; Hovland et al. 2002; Rogers et al. 2006; Webb et al. 2009).
3 Interpretation of seismic profiles defines depth of structures, stratigraphic units, and enables recognition of gas under the seafloor. For example, shallow interstitial gas within marine sediments restricts seismic reflection imaging (acoustic masking, e.g., Fader 1997) of sub-bottom units resulting in a gas curtain obscuring seismic profiles and indicating that interstitial gas is present in the underlying units. As others have noted from seismic data (Rogers et al. 2006), gas is not always found below pockmarks, allowing seismic penetration to bedrock and implying that the structure does not represent a continuous release from the underlying units, but was likely caused by a single catastrophic expulsion. Occasionally it is also recognized that where gas-rich zones are found in seismic profiles, they are not universally overlain by pockmarks.
4 Pockmarks have a wide range of sizes and shapes, often found as circular craters from less than one metre-, to greater than 700 m in diameter and exceeding 45 m in depth (King and MacLean 1970; Gontz 2002). Commonly they are found locally as 10–50 m wide conical depressions tapering downward with depths 5–10 m deep (Hovland and Judd 1988; Rogers et al. 2006). The preservation of some pockmarks may be the result of seabed currents, inhibiting infilling and sediment accumulation within the pockmarks (e.g., Josenhans et al. 1978). Pockmarks can be formed by expulsion of gas or fluids (as discussed below), nonetheless it could be expected that pockmarks would remain active until the supply of gas or fluid was depleted and bottom sediment began filling the depression. Internal reflectors (stratification) are thought to represent alternations in the sand and silt content of the sediments, perhaps resulting from high tidal currents and strong seasonal effects on sedimentation (Belknap and Shipp 1991; Bacchus 1993). One type of pockmark is called ‘eyed’ and has been described as having an acoustically stronger backscatter reflection in its centre. The higher acoustic backscatter results from either the presence of carbonate deposits from biological activity or from erosive upwelling processes winnowing away the finer sediments and leaving behind coarser materials (Pecore and Fader 1990; Hovland et al. 2002).
5 Although pockmarks are often circular, they may also be elongated in form. Linear structures have been attributed to scour of original pockmarks caused by strong bottom currents or iceberg keels (Paull et al. 1999; Rogers et al. 2006). Elongated pockmarks, or furrows (Brothers et al. 2011), can occur where bottom tidal currents are high with elongation oriented in a preferred direction of currents (Josenhans et al. 1978; Nelson et al. 1979; Boe et al. 1988; Paull et al. 1999) or where gas or fluid is seeping from a long, narrow fissure. The occurrence of pockmarks in a linear orientation on bathymetric images may be indicative of structural control from faults or contacts and suggest a possible thermogenic origin; that is, by gas developed at great depths and high temperatures by the cracking of kerogens in sedimentary rocks. The thermogenic origin is further supported where acoustic masking occurs in seismic reflection profiles collected over locations suspected to be underlain by gas-bearing bedrock. In southern New Brunswick gas is found mainly in bedrock of Carboniferous age (Park 2014; S. Hinds, personal communication, 2015).
6 The origin of pockmarks is still debated, but the two processes generally accepted are escaping ground fluids or natural gas (Kelley et al. 1994; Pecore and Fader 1990; Rogers et al. 2006, Gontz 2002). An origin from groundwater seepage is often ruled out due to the lack of a local hydraulic head and undisturbed nature of the marine sediments underlying the structures or evidence of acoustic masking (Kelley et al. 1994; Rogers et al. 2006). Gas-generated pockmarks can be caused by the escape of thermogenic and biogenic natural gas from petroleum occurrences, methane hydrates and organic-rich sediment deposits (Nelson et al. 1979; Fader 1991; Kelley et al. 1994; Belknap et al. 2002; Rogers et al. 2006). Gas or liquid emissions are considered as a plausible event that would contribute to the buoyancy and lifting of sea bottom muds associated with crater development (Pecore and Fader 1990). Winnowing as a result of catastrophic expulsion of fluid or gas, could explain removal of fine-grained muds and retention of course-grained sediment or clasts within the centre of a blow-out structure, resulting in an eyed pockmark.
7 At some locations the pockmarks may be biogenic in origin, formed from gas produced by the anaerobic microbial breakdown of organic matter contained in organic–rich sediments (Fader 1991; Kelley et al. 1994; Wildish et al. 2008). Rogers et al. (2006) suggest that pockmark fields are a common feature of every muddy embayment along the Maine coast, but not found in sandy embayments (Kelley et al. 2003; Rogers et al. 2006). Decay of interstitial material or lenses of buried organics in muddy sediments is a lengthy process involving, (1) the time necessary for decomposition and (2) entrapment of a quantity of gas sufficient to permeate through, or to find a conduit through overlying impermeable sediments (Gardiner et al. 2003). Sand has a higher permeability than mud and would allow decomposition gases to percolate through the sediment column and be released into the water without forming an escape structure.
Methods
8 To measure accurately georeferenced bathymetry the CSL Heron and the CCGS Frederick G. Creed used the “Position Orientation System for Marine Vessels” (POS/MV). This system is a differentially corrected and inertially aided dual GPS positioning system used with tidal data to enable accurate estimates of seafloor topography from a moving platform. The acoustic mapping instruments included a 3.5 kilohertz (kHz) Knudsen 320 Marine Echosounder and the Kongsberg EM1000, EM1002, EM3002 multibeam and Kongsberg EM710 bathymetric surveys. Errors in refraction were corrected using sound velocity profile data collected at the time of the surveys. The Kongsberg EM1000, EM1002, EM3000, EM3002, and EM710 systems recorded depth for multibeam bathymetry and backscatter; data were collated and gridded for depth data. The data were collected as part of a wider investigation by the Geological Survey of Canada at the Bedford Institute of Oceanography (see: Todd et al. 2011; Todd and Shaw 2012) and subsequently processed using the OMG SwathEd Software Package, allowing for corrections for time delays, manual bathymetric data cleaning, and generating backscatter and multibeam digital terrain models. As a result of limitations of the ESRI ArcMap (Environmental Systems Research Institute) software, all bathymetric data employed 15 m resolution bathymetry to generate the images. Processing of the sub-bottom data used SegyJp2Viewer GSC software developed by Robert C. Courtney (Geological Survey of Canada — Atlantic) and used to view and interpret single-channel SGYJP2 files. The files are exported as shape files so they can be added to digital map sheets compiled in ESRI ArcMap software for digital interpretation and mapping of related features.
9 The thickness of each seismic unit identified on the reflection profiles were calculated assuming an acoustic velocity of 1500 m/s in water and surficial sediments. Sound in glacimarine muds is 1500–1800 m/s and in sand and gravel 1600–2700 m/s. Thus, the assumed velocity underestimates the thickness of these sediments by 6.7% and 16.7–23.3% respectively (Davies et al. 1992; Belknap et al. 2005). Units were identified by recognition of internal characteristics such as stratification, point reflectors, and intensity of reflections at the bounding surfaces. High backscatter intensity or high reflectivity and a strong acoustic return, was interpreted as bedrock or coarse-grained sediment and shows on images as white and light gray tones. Low backscatter or low reflectivity resulted in a weak acoustic return, interpreted as fine sediment and shows as black and dark gray tones (cf. Lurton 2002; Oliveira and Hughes Clarke 2007). Seismic horizons were referenced to the seafloor as the horizon datum.
Geological setting
10 The BOF is approximately 145 km in length, varying in width from 100 km and a depth of 200 m at the western end at the GOM, shallowing in depth and tapering to 48 km wide towards the northeastern end (Tagg and Uchupi 1966; Swift and Lyall 1968; Fader et al. 1977; Desplanque and Mossman 2001; Shaw et al. 2008). The wedge-shaped bay and the near resonance with the Atlantic Ocean tides facilitates some of the highest vertical tidal ranges in the world changing from 5 m at the mouth of the bay to approximately 17 m at the head of the bay (Hachey and Bailey 1952; Scott and Greenberg 1983; Desplanque and Mossman 2001; Dashtgard et al. 2007; Shaw et al. 2008).
11 The BOF is sited in a half-graben called the Fundy Basin, with faults on its northwestern margin. The Fundy Basin was formed along the eastern margin of North America at the time of the breakup of Pangaea during the Middle and Late-Triassic (Wade et al. 1996). The Avalon terrane forms the basement rocks along the New Brunswick side of the BOF. These units are low-grade metamorphic, igneous and sedimentary rocks consisting of Middle–Late Proterozoic metamorphic rocks, Late Proterozoic rifted cratonic volcanic arcs and younger Cambrian–Ordovician, Silurian–Early Devonian and Triassic rocks (Uchupi and Bolmer 2008). Offshore the units may be covered by undifferentiated Triassic units (E. King, personal communication, 2015).
12 At the western boundary between the Gulf of Maine and the Bay of Fundy is an archipelago of 20 islands (Legget 1980); the largest in size is Grand Manan Island followed by Campobello Island (Fig. 3, gas site 2 on Fig. 4). Extensive moraines and kame delta complexes extend along coastal areas of New Brunswick some of which can be traced across the islands into eastern Maine. These deposits represent a significant recessional position during the end of the Wisconsinan glaciation with submerged features recorded in the BOF bathymetry (Broster and Legere 2016b).
 Display large image of Figure 3
 Display large image of Figure 4
Pleistocene and Holocene
13 During the Wisconsinan, several glaciers developed into a large ice sheet in the Maritime region of Canada, collectively referred to as the Appalachian Ice complex (Stea 2004). At the time of the glacial maximum, the ice sheet terminated at the edge of the continental shelf (Shaw et al. 2006) and worldwide sea level was -120 ± 20 m lower than at present (Pirazzoli 1991). As the ice sheet retreated to the coastal areas of the province, the sea inundated the isostatically-depressed lands vacated by the disintegrating ice mass. Elevated glacimarine deltas and shoreline features occurring up to 100 km inland, represent an upper marine limit that may have been as high as 80 m and resulted in the formation of inland seas (Seaman 2006; Broster and Dickinson 2015). Locally, glacier ice masses retreated northward onto the BOF coast sometime between 13400 and 17787 y Cal BP (calibrated; Todd and Shaw 2012; Broster and Dickinson 2015). At that time relative sea level fell in the BOF assisted by isostatic rebound and large areas were vegetated prior to sea level rising to its present elevation.
14 For the coast of Maine, Kelley et al. (2010) present a calibrated relative sea level curve updated from Barnhardt et al. (1995) and Belknap et al. (2005), demonstrating shorelines above 70 m asl prior to dates of 15 ky Cal BP and a major low stand of -60 m at approximately 12.5–12 ky Cal BP (Fig. 5). Due to variation in glacial unloading (Bacchus 1993) and rate of recovery, isostacy likely occurred at different extremes across regions thus blurring wide-scale sea-level correlations (Kaplan 1999). In the BOF eustatic lowering would have resulted in exposure to subaerial conditions for large areas along the coasts, prior to the return to amplified high tides over the last 7000 yrs. The sea level curve (Fig. 5) indicates that coastal areas above -15 m were exposed to subaerial erosion and occupation by vegetation for more than 5000 yrs and areas as deep as -60 m for a few hundred years. During this time wave base may have contributed to suabaquatic erosion to levels now at depths >60 m, depending upon local isostacy and forebulge conditions. A glacially-driven regression and transgression sequence could account for the Pleistocene/Holocene unconformity (Broster and Legere 2016a, b) that is widely recognized to depths as deep as -90 m (Kelley et al. 1994; Rogers et al. 2006; Legere 2012) and the occurrence of modified and buried submerged glacial landforms (Dashtgard et al. 2007; Desplanque and Mossman 2004; Rogers et al. 2006, Shipp et al. 1999; Legere et al. 2012).
 Display large image of Figure 5
OBSERVATIONS AND INTERPRETATIONS
15 The seismo-litho facies adopted here, were identified from earlier investigations (Legere 2012; Broster and Legere 2016b) and correlated with stratigraphic units found along the Scotian Shelf by Fader et al. (1977) and Maine Inner Shelf by Bacchus (1993). The major facies from oldest to youngest in the BOF, consist of undifferentiated bedrock (BR), till (T), glacimarine undifferentiated (GM), glacimarine proximal (GM1), distal glacimarine (GM2), and Holocene-age marine (M). The Holocene sediments form the uppermost acoustically transparent layer that is present in all survey lines investigated (e.g., Figs. 6–8).
16 Bathymetric images of circular and linear pockmark depressions on the Bay of Fundy seafloor indicate locations of escaping fluids or gas from underlying sediment or bedrock. In seismic profiles (e.g., Figs. 7, 8), the pockmarks taper downward and are confined to the Holocene sediments, with the largest and deepest structures reaching the underlying unconformity (U). The unconformity is recorded as a distinctive horizon separating the surface Holocene-age unit from Wisconsinan glacimarine and glacifluvial deposits (Broster and Legere 2016b) and represents a time when rapid glacier retreat resulted in exposure of shallow parts of the bay to erosion and vegetation, at locations subsequently submerged by rising sea level.
Passamaquoddy Bay (gas location 1)
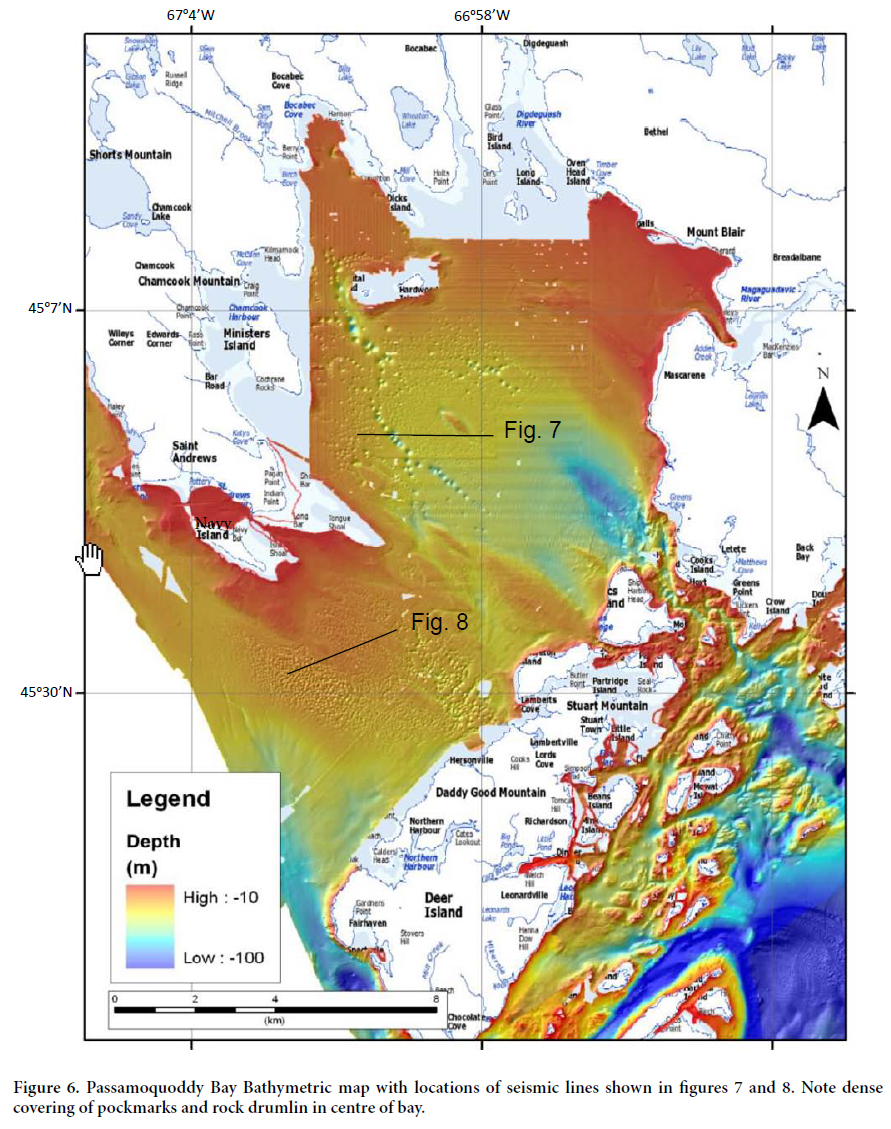
17 The floor of Passamaquoddy Bay (gas location 1, Fig. 3) is densely covered with pockmarks covering an area of 87 km2 (Fig. 6). The pockmarks in this area are estimated to number up to 11 000, varying in diameter from 1 m to 300 m and reaching depths up to 29 m below the seafloor (Pecore and Fader 1990; Wildish et al. 2008). The pockmarks are found as single features or as groups of linear chains. The highest density of pockmarks occurs in two large areas: the central to northern part of the bay where they occur in linear chains of northwest-southeast orientation and show high points of reflectivity in the centres of the structures (Fig. 6).
 Display large image of Figure 6
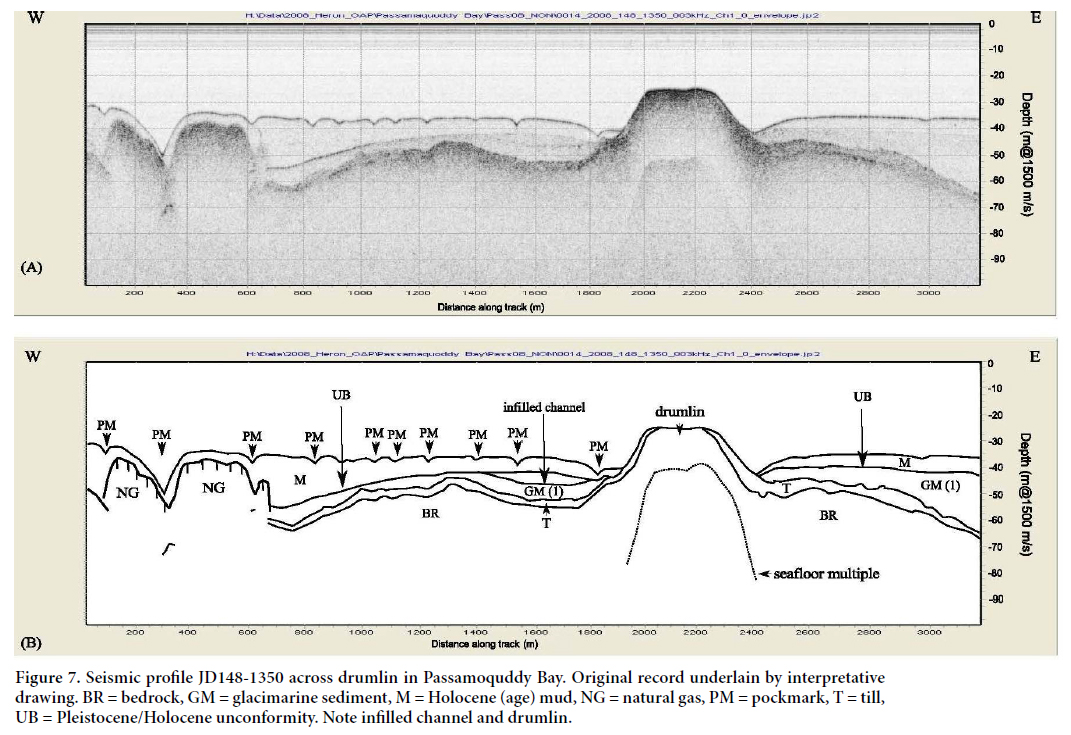
18 In the central part, pockmarks form outlines around structural highs on the floor of the bay. One landform outlined by a chain of pockmarks (line 1, Fig. 6) is interpreted as a drumlin approximately 20 m high, 400 m wide, 1.2 km long, and oriented to the southeast, parallel to local striae directions recorded along the shoreline (Seaman 2006). Seismic reflection profiles across the structure (Fig. 7) are interpreted as indicating a bedrock drumlin with a cover layer of till, thin on top and thickening off the sides of the landform. Marine sediments overlie till and onlap onto the sides of the drumlin. The occurrence of natural gas is indicated in the western part of the seismic line but not found under the drumlin or under pockmarks within a kilometer east or west of the drumlin (Fig. 7).
 Display large image of Figure 7
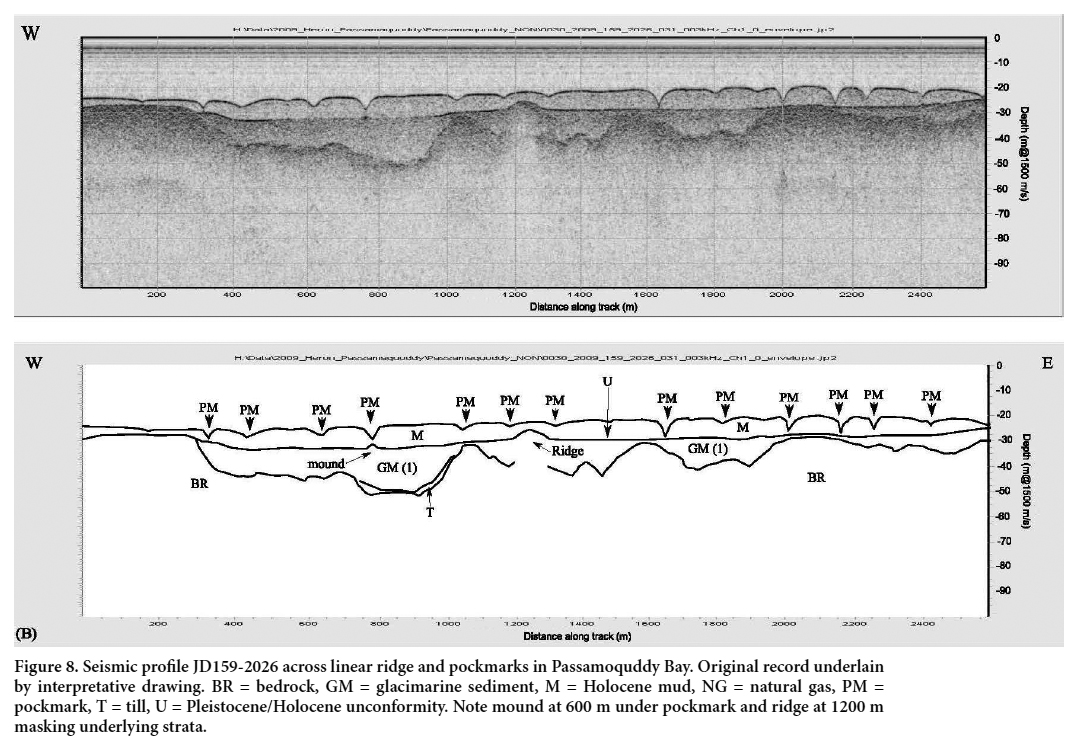
19 Other southeastward oriented ridges and flutes were found in the seismic profiles demonstrating that the pockmarks occurred only along the structures and were not found overlying them (Fig. 8). These landforms were interpreted as sand and gravel, and till ridges that were not conducive to pockmark formation. Tills deposited subglacially are commonly found to be over- consolidated and would be of a higher density than surrounding marine muds and thus more difficult for gas or fluid to permeate. Sand and gravel would allow gas or fluid to percolate as it was generated and likely would not facilitate formation of large pockmarks. Seismic returns indicated that natural gas was not underlying the ridges or pockmarks. All pockmarks in each seismic line were found to be confined to the Holocene unit although some terminated at the unconformity. A small mound of sediment found at the level of the unconformity directly under a pockmark (Fig. 8) may represent the catastrophic release of gas or fluid and subsidence of coarse materials to a competent level during fluidization of overlying sediments from ground shaking. However, Carboniferous-age bedrock is not known to occur at this location (Fig. 9). Additionally, as the area is surrounded by low terrain and therefore lacking a significant hydraulic groundwater gradient, the origin of the pockmarks is likely a result of biogenic decomposition of interstitial organics in Holocene-age marine sediments or synchronous with development of the unconformity.
 Display large image of Figure 8
 Display large image of Figure 9
Areas of gas potentially overlying Carboniferous bedrock
20 Five of the seven areas demonstrating natural gas in multiple geophysical tracks from the Frederick G. Creed 2007 and 2008 surveys (study areas 3–7, Figs. 4, 10) may overlie outliers of Carboniferous bedrock. Two locations east and southeast of The Wolves (locations 5 and 6, Fig. 4) represent occurrences of gas in areas up to 40 km2 in size. Area 6 represents gas occurring at a depth of more than -125 m within a 2 km wide depression interpreted as a large glacially-eroded valley in bedrock (see Legere 2012, fig. 4.73).
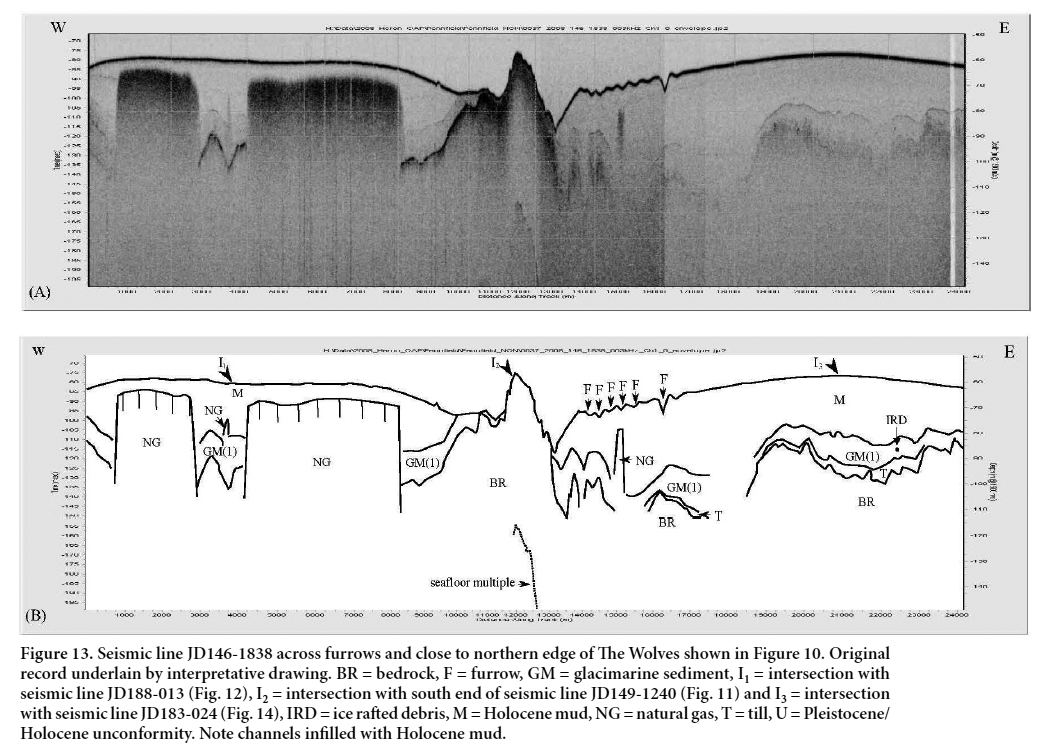
21 Seismic tracks located north, northwest and east of The Wolves (areas 3, 4, 5, Fig. 4) indicate underlying occurrences of gas found at depths of approximately -80 m or deeper and adjacent to large V-shaped furrows at the surface (Figs. 10–14). The elongated furrows have not been infilled by sediments, either a result of their recent formation or because they were formed and preserved by the high currents in these areas. It is more likely that the furrows are generated by bottom currents, considering the magnitude of tides and volume of water moved across these areas, and that the gas occurrences are coincidental with some of the furrows rather than causal. Although separate units can be distinguished in some seismic lines collected across these areas, most of the sub-bottom lines from the 2007 survey data were of poor quality caused by a malfunction in the Knudsen instrumentation at the time of data collection (see Legere 2012). However, the unique acoustic masking effect of natural gas enables its occurrence to be easily distinguished in the seismic data. Rogers et al. (2006) suggest that migration from deeper sources along permeable units or conduits could develop pockmarks or furrows at points of escape without the presence of a gas curtain. Previous mapping along the shore, have identified igneous and metamorphic lithologies (Fig. 9), but bedrock data from sub-sea drilling in the BOF is unavailable.
 Display large image of Figure 10
 Display large image of Figure 11
 Display large image of Figure 12
 Display large image of Figure 13
 Display large image of Figure 14
DISCUSSION
22 Glacial evacuation of the coastal areas during a period of lowered sea level and isostatic depression resulted in the former seafloor becoming an exposed shelf (Kelley et al. 1994; Belknap et al. 2002; Rogers et al. 2006; Legere 2012; Broster and Legere 2016b). Emergence gave rise to erosion, colonization by plants, and the development of lakes and wetlands that were subsequently inundated and buried by modern Holocene muds. The timing of deglacial and eustatic sequences proposed in the preceding model of development is supported by the widespread occurrence of pockmarked fields in areas at depths shallower than -40 m. Pockmarks are a common feature of glaciated areas in the northern hemisphere such as Alaska (Nelson et al. 1979), Norway (Webb et al. 2009) and the North Sea (Hovland 1989). High organic content of marine muds in bays and tidal flat deposits is a feature of glaciated regions that experience cycles of increased production of organics during lowstands and subsequent burial of deposits synonymous with decay of large ice sheets. The slow decomposition of interstitial or buried organic debris due to anaerobic digestion by microorganisms is one source of biogenic gas that could cause pockmarks. However, the geometry of the structure can indicate a source and mechanism of gas emission. For example, eyed pockmarks and rare mounds directly underlying pockmarks, suggest that during formation of these structures some of the coarser debris could have fallen back into the depression. Several concepts have been proposed regarding the catastrophic release of gas from biogenic sources including disturbance from meteorite impact (Nelson et al. 1979), neotectonic and fault movements (Kelley et al. 1989), ice rafting (Paull et al. 1999) or wave pumping during violent storms (Rogers et al. 2006). The existence of a pockmark directly over a sediment mound at the unconformity found at a location close to the Oak Bay Fault in Passamoquoddy Bay (Figs. 5, 8) may support previous reports by Kelley et al. (1989) suggesting a possible seismic event participated in the formation of some structures. This concept is further supported by documented seismic events in this area by Burke (2004).
23 Any large ground-shaking event such as an earthquake or large landslide could cause interstitial gas bubbles to be suddenly expelled into the water column. While a sudden external catastrophic event would facilitate the expulsion of interstitial gas, it is likely that gas trapped in or under impermeable clay-rich sediments could be released once a volume of gas achieved a critical pressure sufficient to permeate or fracture overlying sediments. Such a release of gas would explain the significant bubbling events observed over pockmarks by a diver, and at another time seen at the water surface by a fisherman, during times not associated with storm conditions or ground shaking (Kelley et al. 1994; Rogers et al. 2006).
24 Groundwater seepage might not be accompanied by the release of bubbles, although fluid or gas piping could suspend fine-grained sediments or cause liquefaction of the area of escape, enabling dispersal of any suspended fine-grained sediments by currents and forming collapse structures. The steep walls of some pockmarks with their angle of repose reported as steep as 30° and 35° (Rogers et al. 2006; Webb et al. 2009) would be difficult to maintain unless facilitated by currents or repeated emissions. A repeated periodic large volume release, or sustainable continuous release of gas or fluid is more likely to maintain a cavity at point of formation than would a single one-time event that would allow the depression to be infilled with bottom sediments over time. Older, one-time events are possibly indicated by the absence of gas underlying a pockmark, were as the indication of gas in seismic returns represent a sub-bottom source now present and possibly repetitive. Thus, pockmarks in our study area have likely been formed by both catastrophic events as well as slow gradual emissions.
25 The large areas of gas occurrences north, east and southeast of The Wolves are at locations as deep as -80 m below sea level for areas 4 and 5, and as deep as -125 m for area 6 (Fig. 4). The underlying bedrock lithology is unknown so a thermogenic source cannot be entirely dismissed. However, these occurrences could be biogenic, resulting from selective deposition of organic-rich detritus into glacial eroded valleys or overdeepening serving as subaqueous depocentres. While depocentres are a plausible explanation for gas origins, seismic masking obscures sub-bottom topography in many locations. Alternatively, these deeper occurrences may be evidence that relative sea level in the BOF in certain areas was at a depth below -125 m for a period following local retreat of glacial cover and prior to isostatic rebound and submergence.
CONCLUSIONS
26 It has long been known that pockmarks and furrows can indicate buried subsea sources of thermogenic gas. At depths to -125 m in coastal waters, and especially in glaciated regions, exploration for thermogenic gas occurrences can be compounded by the occurrence of pockmarks originating from biogenic deposits from a time when relative sea level was much lower than at present. Such glacial-driven transgression/regression cycles have world-wide influence along shorelines, but are of special significance to shallow embayments. In the BOF, fields of pockmarks above -40 m in depth commonly denote large areas of biogenic gas from interstitial sediments and vegetation deposited during development of the Pleistocene/Holocene unconformity. Gas occurrences at sites deeper than -90 m may represent organic detritus that was transported and deposited in interstitial muds during storm events or from marine organisms. However, these depositional origins would not be expected to produce large fields of dense pockmarks.
27 Seafloor furrows possibly resulting from both bottom currents and seeps of natural gas were found in three study areas that may be underlain by Carboniferous-age bedrock that is the major petroleum source rock in New Brunswick. Two areas of ~40 km 2 in size east and southeastward of The Wolves, at depths between 80 m and 125 m, have potential for exploration for fossil fuels. However, a biogenic origin for these occurrences cannot be discounted until the bedrock lithology is confirmed as gas-generating.
28 Pockmarks found over areas of metamorphic bedrock and not demonstrating evidence of underlying gas in seismic surveys, suggest that the structures have resulted from a biogenic source now depleted. Conversely, seismic evidence of gas at depth and occurrences of bubbles rising from the seabed suggest a source that may be presently venting gas. These comparisons indicate that the variation in pockmarks found in the BOF can be attributed to different periods of development, the volume of gas generated, duration of gas release, sea floor currents, and sediment infilling of pockmarks.
We are indebted to Doug Cartwright and John Hughes Clarke formerly of the Ocean Mapping Group, University of New Brunswick; Russ Parrot (Geological Survey of Canada) who led the bathymetric survey of the Bay of Fundy, Bob Courtney, Edward (Ned) King and Dave Mosher of the Geological Survey of Canada at the Bedford Institute of Oceanography. The authors are especially grateful to Edward King, Brain Todd and the Atlantic Geology editors for critical suggestions that improved the revised manuscript.