Articles
Late- and post-glacial history of the East Branch of the Penobscot River, Maine, USA
ABSTRACT
Between ~20 and 15 ka the Laurentide Ice Sheet retreated from the edge of the continental shelf, first to the Maine coast and then across Maine to the northern reaches of the Penobscot Lowland. The Lowland, being isostatically depressed, was inundated by the sea. As ice then retreated into Maine’s western mountains, valleys through the mountains became estuaries. In the estuary now occupied by the Penobscot River’s East Branch, ten ice-marginal deltas were built during pauses in this part of the retreat. By 14 ka the ice had retreated far enough to expose land in the valley bottom between the ice front and the sea, and the Penobscot River was (re)born. This occurred near the present confluence of the Seboeis River and the East Branch. The river gradually extended itself northward as the ice retreated and southward as relative sea level fell. Braidplains were formed and incised, leaving terraces. High initial discharges eroded the eastern flanks of the esker and deltas, redepositing silt, sand, and gravel all the way to the present head of Penobscot Bay. By ~10 ka the discharge had decreased, the river was adjusting to on-going differential isostatic rebound, and finer sediment was accumulating, forming the present floodplain.
RÉSUMÉ
Entre environ 20 et 15 ka, l’Inlandsis laurentidien s’est éloigné du bord du plateau continental, se dirigeant d’abord vers la côte du Maine et traversant ensuite le Maine vers la partie nord des plaines basses de Penobscot. Soumises à une dépression isostatique, les plaines basses ont été inondées par la mer. Lorsque les glaces se sont ensuite retirées dans les montagnes occidentales du Maine, les vallées des montagnes sont devenues des estuaires. Dans l’estuaire maintenant occupé par le bras est de la rivière Penobscot, dix deltas proglaciaires se sont formés durant les pauses dans cette partie du retrait. En 14 ka, les glaces s’étaient retirées suffisamment loin pour exposer les terres au fond de la vallée entre le front glaciaire et la mer, et la rivière Penobscot est (re)née. Cela s’est produit près de l’actuel confluent de la rivière Seboeis avec le bras est. La rivière s’est progressivement étendue vers le nord à mesure que les glaces se retiraient et vers le sud à mesure que le niveau relatif de la mer baissait. Des plaines en tresses ont été formées et encaissées, laissant des terrasses. Les débits élevés initiaux ont érodé les flancs orientaux de l’esker et des deltas, redéposant la siltite, le sable et le gravier jusqu’à l’actuel fond de la baie de Penobscot. Vers environ 10 ka, le débit avait diminué, la rivière s’adaptait au relèvement isostatique différentiel et des sédiments plus fins s’accumulaient, formant la présente plaine d’inondation.
[Traduit par la redaction]
INTRODUCTION: SETTING
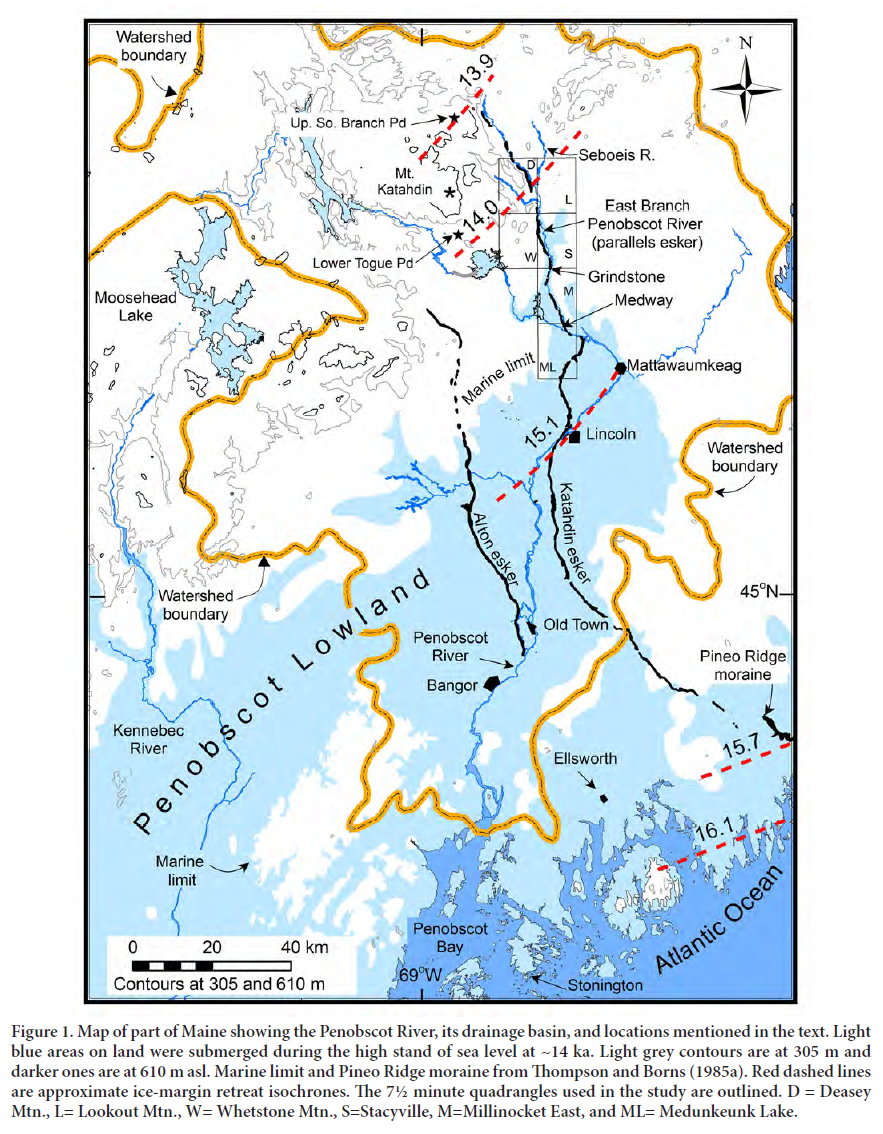
On a map of Maine there is a big indentation midway along the coast – Penobscot Bay – the sink for the 175 km-long Penobscot River (Fig. 1). The Penobscot River heads in a series of glacially scoured lakes on an intermontane plateau, ~350 m asl (above present sea level) in Maine’s western mountains. Thence it flows through some low foothills and, near the town of Mattawaumkeag, into the Penobscot Lowland. The Penobscot River presently drains somewhat over 20 000 km2 with a mean annual discharge of 400 m3/s (United States Geological Survey 2017). It is one of three large rivers reaching the Maine coast. The river’s post-glacial history in the Lowland is described in a companion paper (Hooke et al. 2016).
 Display large image of Figure 1
The last ice advance across Maine culminated ~22–20 ka (Lambeck et al. 2014). Ice then extended across the Gulf of Maine to the edge of the continental shelf. By ~16 ka, the ice margin had retreated to roughly the present coastline and, although substantial rebound had occurred, shoreline features now ~70 m asl near the present coast show that the land was still significantly depressed. Thus, with further ice retreat the sea advanced inland, inundating the Lowland, and eventually forming estuaries extending some distance into Maine’s western mountains (see marine limit in Fig. 1).
The East Branch of the Penobscot River flows in a valley which, during late glacial times, was one such estuary. The northern ~30 km of the ~150 km-long Katahdin esker (Fig. 1) runs along the western side of this valley and is rarely more than a couple of hundred metres from the river. This part of the esker was first described, albeit briefly, by Stone (1899, p. 105), who also noted “a few” expansions of the esker into “elongate plains, not very broad, but rather flat on top, sometimes enclosing kettle holes.” We have identified ten such expansions which we interpret to be deltas (Fig. 2a–d), an interpretation previously advanced by Clinch and Weddle (1989). These deltas were formed where the retreating ice paused and the subglacial esker stream delivered enough sand and gravel to the margin to form a deposit reaching sea level.
 Display large image of Figure 2a
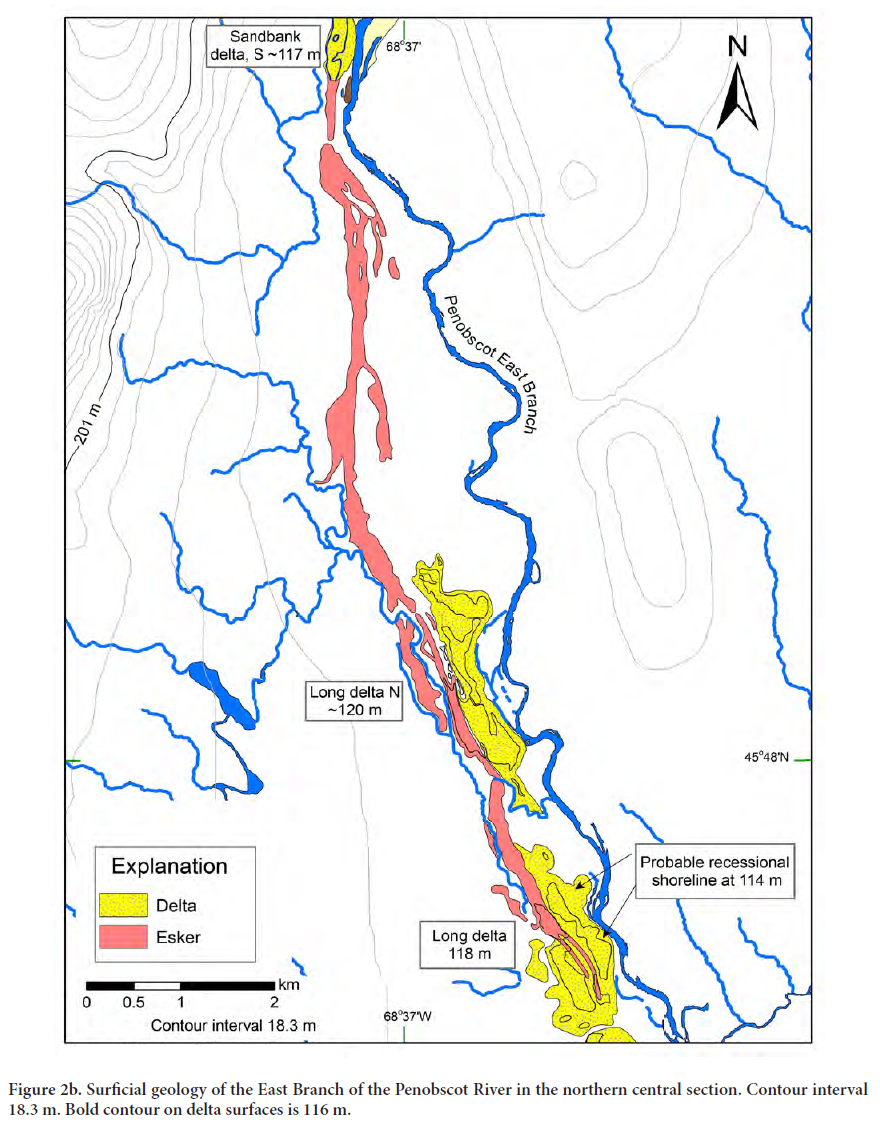 Display large image of Figure 2b
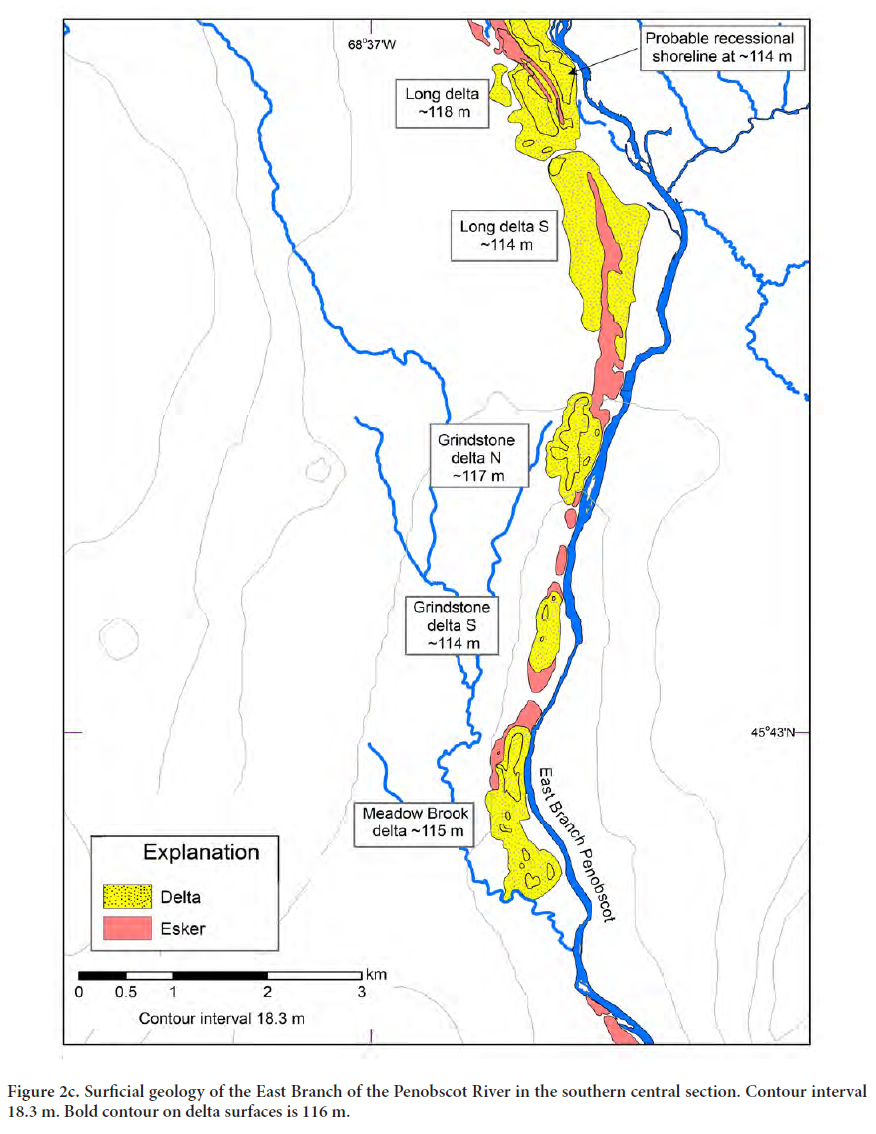 Display large image of Figure 2c
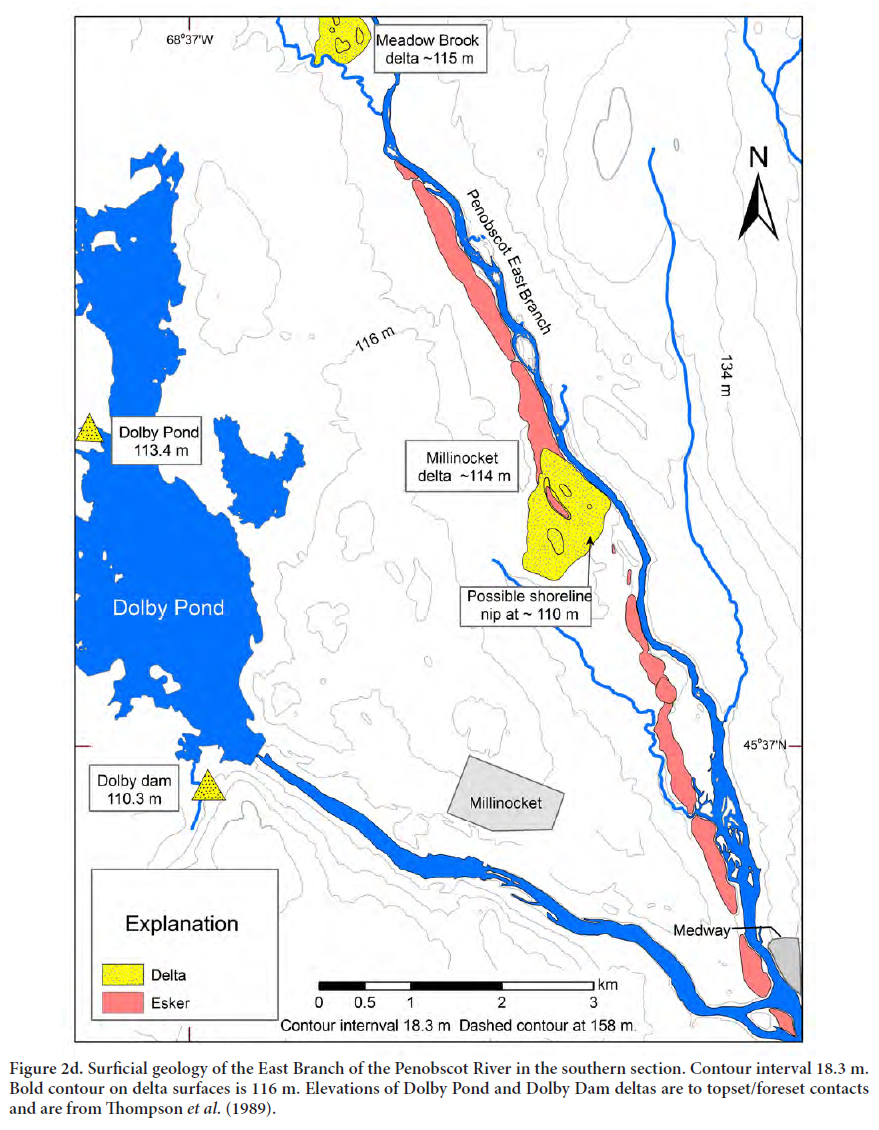 Display large image of Figure 2d
Our objectives in this paper are to describe the esker and the associated deltas in greater detail, to elucidate the rebirth of the Penobscot River as the ice retreated, and to consider the fluvial adjustments once the land emerged above the sea.
METHODOLOGY
Our identifications of map units are based on topography and sedimentology. Vertical exposures being rare, the sedimentologvbnvbnvbny was commonly determined by digging shallow holes in the surface or by sampling with an 18 mm soil probe thrust to a depth of 0.1 to 0.9 m, the depth depending on the caliber and stiffness of the sediment. Sand sizes were evaluated by comparison with images on an AMSTRAT transparent sediment-size card viewed with a 10× hand lens. Gravel sizes were estimated by eye.
The primary topographic landforms are gravel ridges (the eskers) commonly exceeding 10 m in height, the deltas, and relatively planar surfaces (other than delta plains) identified either as parts of the present floodplain or as river terraces. Elevations of deltas and some terraces are central to our analysis. These were estimated from contours on 7½ minute topographic maps (see Fig. 1 for quadrangles used). Contour intervals were 3.06 m or, in the case of two northerly deltas, 6.1 m. Delta surfaces had at least 3 m of relief, and the forest cover is conducive to cartographic errors. Thus, ± 3 m is perhaps a minimum estimate of the uncertainty in these elevations.
The elevations of many terraces were also expressed in terms of their height above the level of the mean annual flood (approximately the modern floodplain). The gage height of this flood, which has a recurrence interval of ~2.33 years (Pizzuto 1986), was determined from a gaging station with a 60-year record (United States Geological Survey 2002) at Grindstone (Fig. 1; see Leopold et al. 1964, p. 63, for technique). The height of a terrace surface relative to this gage height was estimated by measuring its height above the river with a hand level and obtaining the river level on that day from the gaging station record.
In one case, heights of points on three terraces were obtained by surveying from a United States Geological Survey recoverable mark, in this case a bridge deck, with a Nikon AE-5 automatic level (Fig. 2a, AE-5 transect). The elevations of recoverable marks are given to the nearest 0.3 m, and in this case, as the bridge had been washed out, there is a further uncertainty of ~0.4 m in our estimate of where the bridge deck intersected the surface of the logging road. This results in an uncertainty of ± ~0.5 m in these elevations.
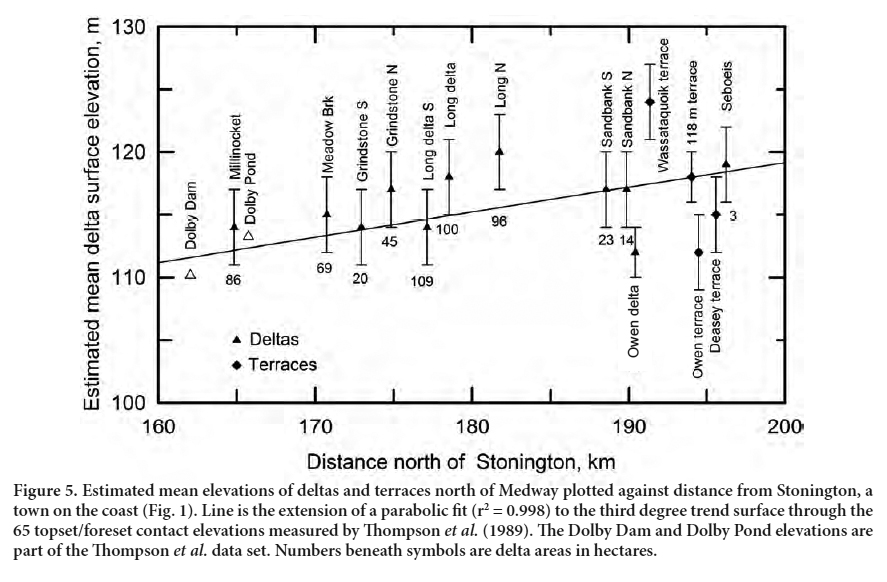
Between Medway (Fig. 1) and the coast, and extending from New Hampshire on the southwest to New Brunswick on the northeast, there are many ice-marginal deltas similar to those we mapped. Thompson et al. (1989) measured elevations of topset/foreset contacts (or in 4 cases, meltwater channels) on 69 of these. They then fit a third-degree trend surface through the elevations, obtaining a close fit to their measurements (r2 = 0.98). This trend surface is an estimate of the local marine limit as a function of distance from the coast and time. While the deltas were being built ice was retreating, the crust was rebounding, and global mean sea level was rising, the latter two at rates of a metre or two per hundred years. Thus, the trend surface does not represent sea level at any specific time in the past. In order to extrapolate this trend surface north of Medway, we fit a parabola to it along a generally south-north line roughly coincident with the Penobscot River.
Samples of sand for optically stimulated luminescence (OSL) dating were collected from the sides of small gravel pits in two terraces along the AE-5 transect (Fig. 2a). We first dug back several decimetres to expose undisturbed stratigraphy and then hammered 2” × 7” PVC tubes into the resulting face. To avoid recent soil disturbance, samples were collected from depths >1.5 m. After removing a tube from the face, excess sand was trimmed leaving a sand surface flush with the tube ends to minimize disturbance during shipping. The ends were then covered with multiple layers of duct tape. The samples were processed at the Luminescence Geochronology Laboratory at the University of Nebraska-Lincoln. Equivalent dose (De) values were obtained using the single aliquot regenerative (SAR) method (Murray and Wintle 2000) on 90–150 μm quartz grains. OSL measurements were conducted on a Risø model DA-20 luminescence reader, and a preheat plateau test (Wintle and Murray 2006) was used to determine the optimum preheat temperature. Aliquots were rejected if their recycling ratios were >10% or if they had measurable signals during stimulation with IR diodes. A minimum of 30 accepted aliquots were generated for each sample, and final age estimates were calculated using the Central Age Model of Galbraith et al. (1999). Environmental dose rate estimates were based on elemental concentrations of bulk sediment taken from within ~30 cm of the OSL sample. These bulk sediment samples were analyzed for concentrations of K, U, and Th using a high-resolution gamma spectrometer. The cosmogenic component of the dose rate values was calculated using equations from Prescott and Hutton (1994). The long-term moisture content was estimated to be 8%. The final dose rates were calculated following equations froM Aitken (1998). Age estimates, dose rate values, and equivalent dose values are shown in Table 1.
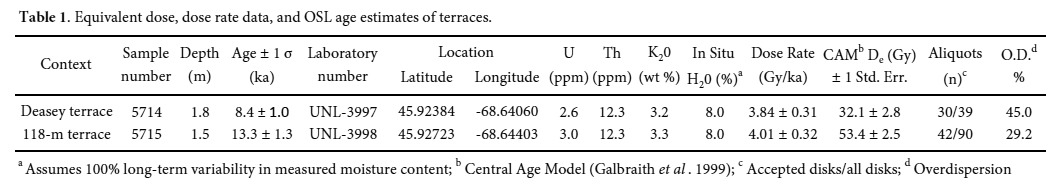 Display large image of Table 1a Assumes 100% long-term variability in measured moisture content; b Central Age Model (Galbraith et al. 1999); c Accepted disks/all disks; d Overdispersion
 IDENTIFICATION AND COMPOSITION OF LANDFORMS
Katahdin esker
The Katahdin esker, a well-known geomorphic feature of Maine (Thompson and Borns 1985a; Shreve 1985), was identified by its ridge shape, generally N-S orientation, and composition of coarse gravel. The dominant facies in the esker is matrix-supported gravel consisting of subrounded pebbles and small cobbles. The matrix is coarse sand. Large cobbles and small boulders make up a minority of the clast sizes.
Deltas
The geometry of the features we identified as deltas could not be observed readily in the field owing to a thick forest cover that generally limited visibility to <100 m. However, our interpretation is supported by the following characteristics: (1) broad planar surfaces with generally <~4 m relief; (2) Steep distal slopes; (3) compositions consisting of pebble and small cobble gravel, commonly seeming to fine distally; (4) gravel sizes appearing, visually, to be somewhat finer than those in the esker but coarser than in most terraces; and (5) elevations above sea level that are consistent with our extrapolation of the trend surface of Thompson et al. (1989). Owing to a lack of either natural or anthropogenic cuts, only one exposure of foreset bedding was found.
Terraces
Terraces are identified by their planar, gently-sloping surfaces, roughly paralleling the slope of the river, and their composition, generally consisting of small-pebble gravel interbedded with weakly-stratified fine to coarse sand, typically coarsening upward. Contacts between beds were commonly irregular and generally gradational, although occasionally sharp.
DATING THE GLACIAL RETREAT
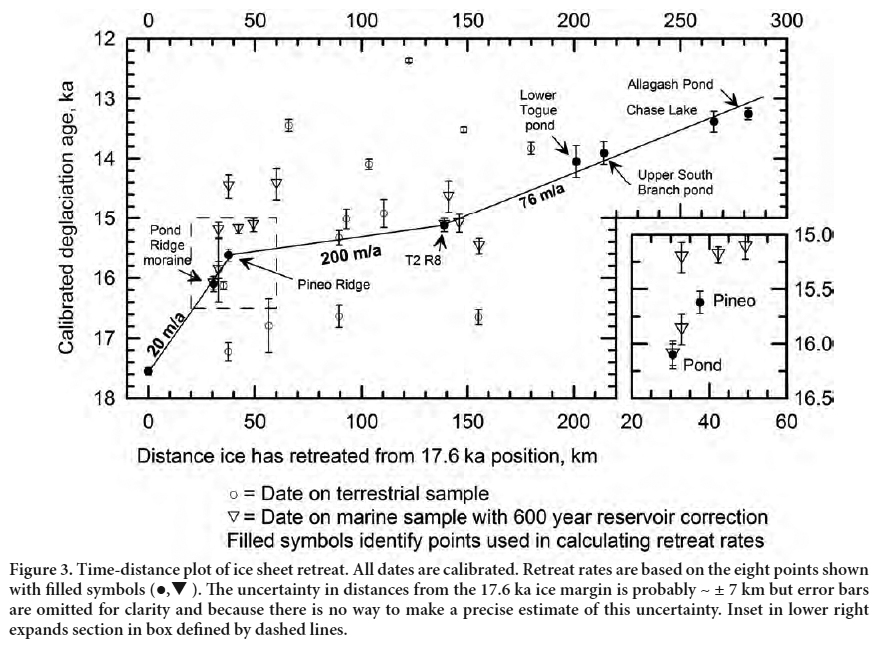
We constructed a time-distance plot of ice sheet retreat (Fig. 3) along a transect running from the coast, through Ellsworth, and ~10 km west of Lower Togue Pond (Fig. 1). The transect is roughly normal to contours of deglaciation age drawn by Borns et al. (2004). All but two of the dates shown in Figure 3 are 14C dates reported by Borns et al. (2004) and calibrated using CAILB 7.0 (Stuiver et al. 2014). The other two are from this study. Most of the dates are from sites lying within ~50 km of the transect and projected onto the line of transect along lines parallel to the contours of deglaciation age. Much of the scatter is likely due to errors in interpreting the context of the dates and in projecting the sites onto the transect. Retreat rates are based on the eight points shown with filled symbols and listed in Table 2.
 Display large image of Figure 3
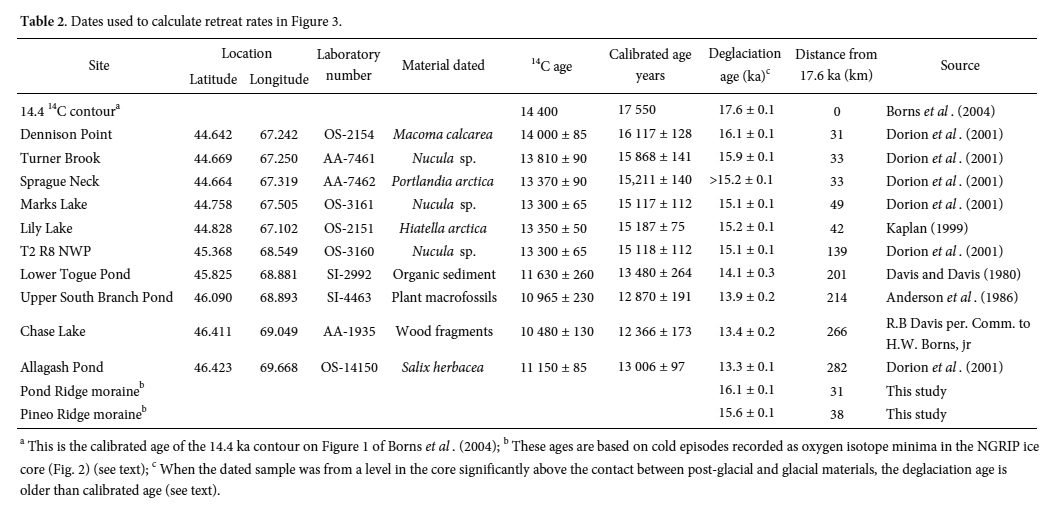 Display large image of Table 2a This is the calibrated age of the 14.4 ka contour on Figure 1 of Borns et al. (2004); b These ages are based on cold episodes recorded as oxygen isotope minima in the NGRIP ice core (Fig. 2) (see text); c When the dated sample was from a level in the core significantly above the contact between post-glacial and glacial materials, the deglaciation age is older than calibrated age (see text).
 Several of the dates were on marine organisms and required a marine reservoir correction. Reservoir corrections vary both spatially and temporally. Along the Atlantic coast from New Jersey to Newfoundland, McNeely et al. (2006) report values ranging from 430 to 730 years. By comparing dates on shells and on associated logs in the Presumpscot Formation near Portland, Maine, Thompson et al. (2011) and found a reservoir age of 1000 years. Following Borns et al. (2004) and consistent with a rough estimate of the median value obtained by McNeely et al. (2006) for the Atlantic coast between New Jersey and Newfoundland, we used 600 years.
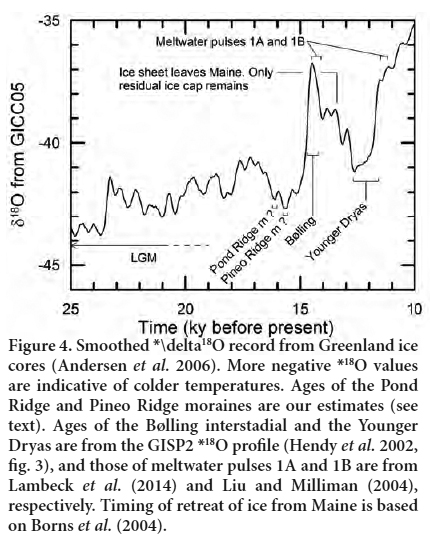
Hooke et al. (2016) suggested that two prominent moraines near the coast, the Pineo Ridge (Fig. 1) and nearby Pond Ridge moraines, were likely formed during minor cold events at 15.6 and 16.1 ka, respectively. These events were recorded as oxygen isotope minima in the NGRIP (North Greenland Ice Core Project) ice core (Fig. 4) (GICC05 chronology from Andersen et al. 2006). Such cold events would likely have resulted in pauses in ice retreat, or possibly slight readvances. We thus infer that they were responsible for these moraines.
 Display large image of Figure 4
The dates of the cold events are generally consistent with available14C dates constraining the ages of these moraines (Table 2). At Dennison Point, 3 km outside the Pond Ridge moraine, a Macoma calcarea shell closely associated with ice-proximal grounding-line deposits was dated to 16.1 ± 0.1 ka, the same as our estimate of the age of the Pond Ridge moraine. On the distal side of the Pond Ridge moraine at Turner Brook a Nucula sp. shell from glaciomarine sediments interbedded with coarse ice-proximal units was dated to 15.9 ± 0.1 ka. Finally, on the proximal side of the Pond Ridge moraine at Sprague Neck a Portlandia arctica shell in glaciomarine facies was dated to 15.2 ± 0.1 ka, yielding a minimum age for the moraine. Similarly, our age for the Pineo Ridge moraine (15.6 ka) is consistent with basal14C dates from Marks and Lily lakes, a few kilometres inside the moraine, that yield minimum ages for the moraine of 15.1 ± 0.1 and 15.2 ± 0.1 ka, respectively.
Further north, near Lincoln (Fig. 1) a Nucula sp. shell from near the base of some glaciomarine mud yielded an age of 15.1 ka (T2 R8 in Fig. 3 and Table 2) which Dorion et al. (2001, p. 235) interpreted to be a “close minimum” age for deglaciation. This suggests a retreat from the Pineo Ridge moraine to this point, a distance of ~100 ± 10 km, in ~500 ± 140 years, or 200 ± 60 m/yr. This is somewhat faster than, but not inconsistent with a mean rate (~150 m/yr) deduced by Eusden (2014) based on a study of the spacing of a plethora of likely roughly annual minor moraines in the southern Penobscot Lowland.
Still further north, Davis and Davis (1980) obtained a date of 13.5 ka on terrestrial materials 0.5 m above the base of a core from Lower Togue Pond (Figs. 1, 3). Extrapolating to the base of the core, assuming a uniform sedimentation rate over the 13 m length of the core, suggests deglaciation at 14.1 ka. Two other nearly identical dates (Anderson et al. 1986) on plant macrofossils from 3.3 and 4.3 m above the base of a core from Upper South Branch Pond (Figs. 1, 3) yield a mean age of 12.9 ± 0.2 ka and a deglaciation age, based on crude curve fitting to scattered dates, of 13.9 ka. Thus, the Seboeis delta was likely formed at ~14 ka. The retreat rate from Lincoln to the Seboeis delta, a distance of 65 km, was then ~76 m/yr (Fig. 3).
LANDFORMS ALONG THE EAST BRANCH
The Katahdin esker
Heat dissipated by vigorous subglacial streams melts ice, forming sharply-arched tunnels and releasing sediment entrained in the basal ice (Shreve 1972). Streams quickly become overloaded and deposit sediment in the tunnels (Hooke 2005, p. 237–238), forming eskers. Because the pressure of the overlying ice is commonly slightly greater than that in these subglacial conduits, they are disposed to close. Under sufficiently thick ice, negative feedbacks lead to a tendency for the closure rate to equal the melt rate (Röthlisberger 1972). Near an ice-sheet margin, however, ice is too thin to close a tunnel as rapidly as melting enlarges it. This, coupled with the fact that the ice margin in our case is submerged in the sea, decreases the water velocity in the tunnel, leading to more rapid deposition. During periods of still stand or slow retreat, large deposits may accumulate at the glacier margin, forming esker heads (Hooke 2005, p. 240-1; Hooke and Fastook 2007). If such deposition continues long enough at the margin of a marine-terminating ice sheet, a delta will form.
Deltas
The most southerly of the features which we interpret to be deltas, and henceforth will refer to as such, is the Millinocket delta (Fig. 2d) (all delta and terrace names herein are informal). It is composed of a pebble and small-cobble gravel that appears to coarsen slightly northward. A test boring near its northern boundary went through 37 m of sand and gravel without reaching bedrock (Weddle 2001a). It has a surface area of ~86 ha (including flanks). Its mean elevation is ~114 ± 3 m. Four low hills on the otherwise remarkably flat surface rise 3 to perhaps 6 m above this elevation. The inclination of the southeast-facing slope is ~12° in the southwest, increasing to ~26° in the northeast, consistent with it being a degraded delta foreset slope. We interpret three closed depressions in its surface to be kettles.
The ~114 m elevation of the feature is in accord with our estimate of the elevation of the local marine limit based on the study by Thompson et al. (1989). Of the deltas they surveyed, the two nearest the East Branch are those at Dolby Dam and Dolby Pond, roughly 4 km WNW and 5 km NW of Medway (Fig. 2d). Their topset/foreset contacts are at 110.3 and 113.4 m asl, respectively. At the northing of the Millinocket delta, our parabolic extrapolation places the topset/foreset contact at 112 m (Fig. 5), consistent with our estimated 114 ± 3 m mean elevation of the surface of the feature, which is expected to be a metre or so above the topset/foreset contact.
 Display large image of Figure 5
Nine similar features lie farther north along the valley of the East Branch (Figs. 2a–d). When extrapolated north of the Millinocket delta, our parabolic fit closely matches the surface elevations of these other nine deltas (Fig. 5). A remnant of an eleventh delta, the one in which foreset beds are exposed, lies ~1 km ENE of Sandbank delta N (Fig. 2a). We call this the Owen delta. Its surface is at ~112 m, ~5 m below our trend line (Fig. 5).
As noted, the delta surfaces are expected to be a couple of metres above our extrapolation of Thompson et al.’s trend surface on topset/foreset contacts. Five of the nine surfaces (Millinocket, Meadow Brook, Grindstone N, Long, and Long N) are 2 to 3 m above the trend line, while 5 fall essentially on it (Fig. 5).
Merging, from the north, into nine of the ten higher deltas are one or more distinct esker segments (Figs. 2a–d). Eskers interrupted by deltas in this manner are common; they are called beaded eskers (De Geer 1897; Donner 1965; Banerjee and McDonald, 1975). In several cases, ridges aligned with these esker segments rise above the delta surface.
Interpretation
The reasons for identifying these landforms as deltas have already been stated. The esker segments merging into them are interpreted to be traces of the subglacial streams that fed sediment to the deltas. The ridges aligned with these esker segments and rising above the delta surfaces (e.g., Long delta, Fig. 2c) are inferred to be parts of the esker that were built up a few metres above local sea level while the ice was still present, and then partially buried by deltaic deposition as the ice retreated. The elongate shapes of the deltas and kettles in the surfaces of several of them suggest that they were confined laterally between ice walls.
The duality of delta-surface elevations may not be significant, given the uncertainty in the elevations. However, four of the five deltas that fall on our trend line are small (Fig. 5). Thus, one might speculate that during delta building there is a threshold size or sedimentation rate that must be exceeded before sedimentation is rapid enough to overcome redistribution of sediment by wave action, thus allowing the delta to build up above sea level. Alternatively, m perhaps wave action planed off the small deltas after the ice retreated and they were no longer receiving sediment, or perhaps retreat of the ice front resumed before the delta, although more massive than a typical subaqueous fan, had fully emerged above sea level.
The lower elevation of Owen delta is likely attributable to postglacial erosion. The foreset beds, exposed over a cross-sectional area of <10 m2, appear to be truncated by the overlying subhorizontal beds. If the latter were topset beds, one would expect that at least some of them would roll over into foresets.
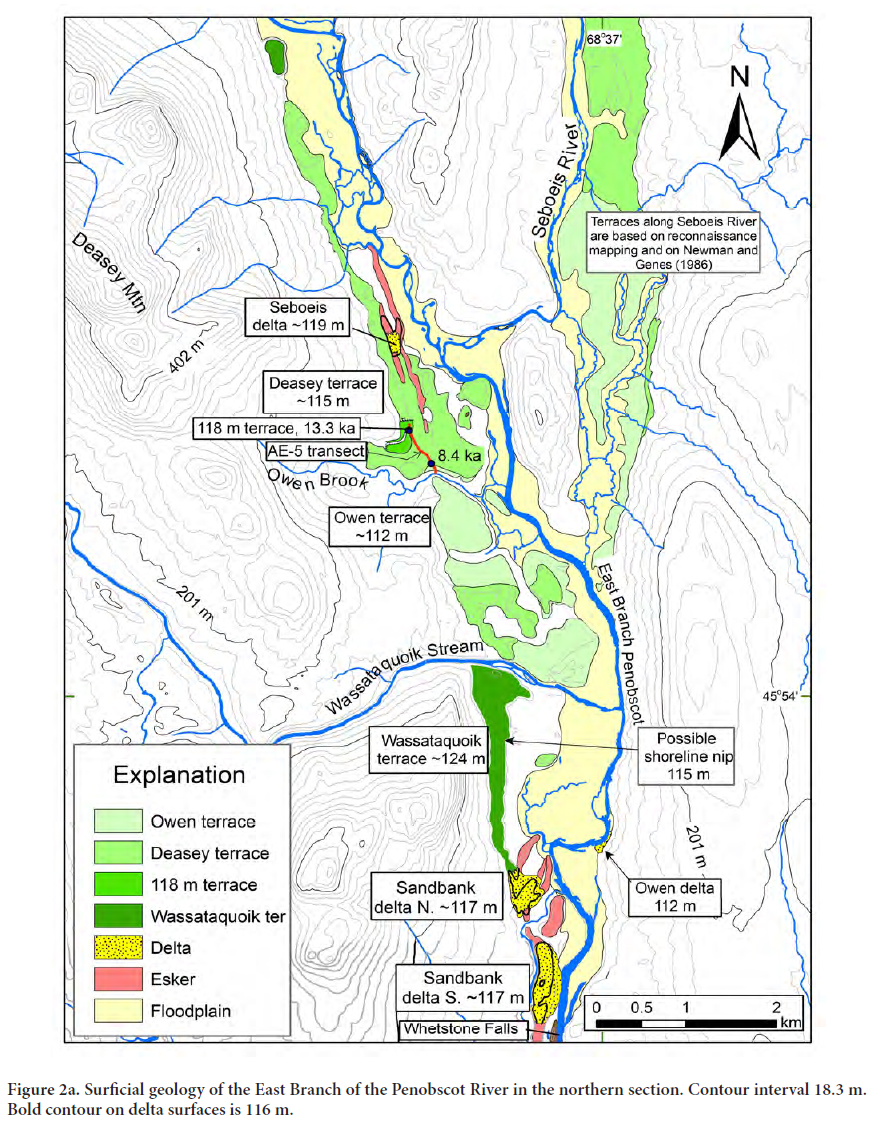
Upper East Branch terraces
Near the confluence of Wassataquoik stream and the East Branch there are three terraces and a remnant of a fourth (Fig. 2a). The highest one, the Wassataquoik (Wa·sa’·ta·cook) terrace, is composed of pebble and cobble gravel that extends into the valley of Wassataquoik stream. There are a few shallow depressions in the terrace surface. The surface slopes southward (~3 m/km) from ~125 m at Wassataquoik stream to ~117 m where it merges with, and appears to be graded to, the northerly of the Sandbank deltas (Fig. 2a).
The three lower terraces are the 118-m, the Deasey, and the Owen. The elevations of these terraces in the vicinity of Owen Brook (Fig. 2a) were determined by the AE-5 survey mentioned earlier. The survey started at the site of a former bridge over Owen Brook (Fig. 2a) and extended ~460 m NNW. Along this transect the terraces are at 118 ± 0.5, 115 ± 0.5, and 111 ± 0.5 m asl, respectively.
Only one remnant of the 118-m surface has been found to date. This remnant is >6 ha in area, but otherwise of unknown extent. It rises above the Deasey terrace slightly north of Owen Brook (Fig. 2a). Although we have found only this remnant, Stone (1899, p. 104) noted “[f]rom one to three terraces of erosion border[ing] the [Seboeis] river” north of its confluence with the East Branch (emphasis added). The 118-m surface is underlain by 1.6 m of pebble and small cobble gravel overlying >0.4 m of fine sand. The sand yielded an OSL age of 13.3 ± 1.3 ka.
Fragments of the Deasey and Owen terraces are fairly extensive (Fig. 2a), but correlation among them is uncertain as: (1) most elevations are based on hand leveling using the river as a datum; (2) extrapolation of the point measurements of elevation by hand level to the broader terrace surfaces is uncertain, as the 3-m difference in elevation of the surfaces is poorly resolved on maps that here have a 6.1 m contour interval; (3) the terrace surfaces are irregular owing to primary irregularities and Holocene erosion; and (4) washed-out logging roads have impeded access in recent years when the need for more detailed data has become apparent. (The initial reconnaissance work was done in 2002.) However, the hand-leveled elevations (Deasey: 115 m; Owen: 112 m) agree rather well with those on the surveyed transect.
The Deasey and Owen terraces are composed of sub-rounded pebble gravel with a few exposures of cobble gravel. Seismic surveys suggest a valley fill 15–25 m thick (Weddle 2001b), part of which is likely till (e.g., Weddle 2001c). Terrace surfaces are etched by abandoned channels. The paleochannels and the pattern of the terrace remnants suggest braiding. Along the AE-5 transect, coarse sand beneath ~1.5 m of braidplain gravel in a borrow pit in the Deasey terrace yielded an OSL age of 8.4 ± 1.0 ka (Fig. 2a).
Interpretation
The Wassataquoik terrace does not appear to be extensive enough to suggest that gravels once filled the entire valley to this level. Its extension upstream into the valley of Wassataquoik stream suggests that this stream was the source of the gravel. The depressions in the surface are interpreted to be kettles, implying the proximity of ice during formation. Thus, we think this terrace is an ice-marginal kame graded to the marine limit at Sandbank delta N, and we infer that ice occupied the center of the valley while it was being formed. The Wassataquoik kame was left as a terrace when the ice margin retreated from Sandbank delta N.
Upon withdrawing from Sandbank Delta N, the ice margin next stabilized, albeit probably only briefly, near the present confluence of the Seboeis River and the East Branch. There the small Seboeis delta (~119 m asl) was formed. Isostatic rebound then led to a gradual decline in relative sea level, land became exposed in the valley bottom in front of the retreating ice margin, and the modern Penobscot River was born. The river built a braidplain between the ice margin and the retreating sea. The 118-m terrace is interpreted to be a remnant of this first braidplain; it is the only remnant identified to date. That the Seboeis is a delta and not part of the braidplain is suggested by its relation to the eskers (Fig. 2a). Given the uncertainties in the elevation estimates, however, it is not clear whether or not the 118-m elevation represents an initial small decrease in relative sea level from the level of the delta. The braidplain was likely of limited areal extent, and active for a relatively short time span.
The Deasey surface (115 m) is ~4 m below the extrapolated marine limit (Fig. 5); we think it formed by regrading of the 118-m braidplain during a period of stability in the otherwise generally declining relative sea level. When the decline resumed, Owen Brook cut down, regrading part of the Deasey terrace and forming another braidplain that, after still more downcutting, became the Owen terrace (~112 m based on our hand-leveled elevations).
Our elevation estimates suggest that the gravels at the surface of Owen delta (~112 m) are likely correlative with the Owen terrace. However, the truncation of foreset beds by these gravels suggests that the delta has been eroded. Gravels ~200 m south of Owen delta and at an elevation of ~118 ± 2 m, and therefore consistent with delta elevations in Figure 5, may reflect the original elevation of the delta surface.
Initially, falling relative sea level interspersed with periods of stability likely controlled the downcutting. However, Whetstone Falls, a bedrock sill at ~102 m and ~0.2 km south of Sandbank delta S (Fig. 2a), would have acted as a local baselevel once it became exposed. Thus later phases of downcutting from the Owen level were likely driven partly by an increase in gradient due to Holocene differential isostatic rebound (Hooke et al. 2016) and partly by a decreasing sediment supply as ice vanished from the drainage.
Shoreline(?) nips
Roughly horizontal benches a few metres below the surfaces of terraces and deltas are found in at least six places. One is cut into the Wassataquoik terrace ~0.9 km south of Wassataquoik stream, where the terrace surface is at ~121 m and the bench is roughly 6 m below that surface. Two are in the flank of Long delta, and another is in the foreset slope of Millinocket delta (Figs. 2b, 2d). These three are all ~4 m below the respective delta surfaces and 1–3 m below the projected marine limit. Another bench, ~12 m wide and ~8 m below the estimated marine limit, occurs ~5 m below the crest of the Alton esker ~16 km northwest of Old Town (Fig. 1). Other similar benches are located near the coast. One is in the flank of a delta in Ellsworth (Fig. 1) and another in the foreset slope of a delta fronting the Pineo Ridge moraine. In the latter two cases, the drop from the delta surface to the inner edge of the bench is ~7 m. Others occur in foreset slopes of deltas east of Pineo Ridge (Thompson and Borns 1985b, fig. 8).
Interpretation
The latter benches have been interpreted to be strand-lines (Thompson and Borns 1985b) cut, presumably, during one of several brief pauses in an otherwise generally monotonic decline in relative sea level. We suspect the other nips are also wave-cut and hence reflect local relative sea level. If this is the case, and if they are contemporaneous, they reflect a time when the ice margin was not far north of Wassataquoik Stream, sea level was roughly at the level of the Deasey terrace, global sea level rise and isostatic rebound were occurring at nearly the same rate, and isostatic rebound was still uniform (differential rebound had not yet begun). The latter is reasonable; in the Connecticut River valley in central New England, rebound appears to have occurred uniformly (without tilting) between 18 and 14 ka (Hooke and Ridge 2016).
EFFECT OF MELTWATER PULSES 1A AND 1B
The rate of change of relative sea level at any given location on the globe is a function of three processes: (1) Glacioisostatic rebound, (2) changes in the gravitational attraction exerted by the ice sheet on the sea, and (3) ice-sheet decay. Rebound is expected to be essentially continuous with only minor fluctuations; the rate decreases through time, asymptotically approaching zero. The gravitational attraction exerted on the sea by the ice sheet changes with changes in the mass of the ice sheet and its distance from the sea (Clark 1976). Ice sheet decay is driven by climate and is irregular. Relative sea level decreases when rebound plus the gravitational effect exceed meltwater addition to the ocean. Pauses in such decreases reflect times when meltwater addition accelerates to the point where it equals the other two.
At about the time of the rebirth of the Penobscot River, sea level was rising unusually rapidly in what Fairbanks (1989) has termed meltwater Pulse 1A (MWP-1A). Lam-beck et al. (2014 fig. S4B) date this to 14.5–14.1 ka (Fig. 4) but other sources suggest that the peak may have been later—at ~13.8 ka (Gornitz 2009). About 3 k.y. later there seems to have been a second pulse—MWP-1B (Fairbanks 1989). The rate of rise during these pulses varied spatially, but was typically a few tens of millimetres per year.
If MWP-1A occurred during retreat of the ice margin up the East Branch, as our dating suggests, the consequent rise in sea level would result in delta elevations above our extrapolation of Thompson et al.’s (1989) data (Fig. 5). However, if the rebirth of the Penobscot River occurred a few centuries earlier than 14 ka, or MWP-1A was somewhat later, the pauses in the fall of relative sea level represented by the Deasey terrace, and perhaps by the various shoreline nips, could be attributable to it. Then the Owen terrace could be related to MWP-1B. As the accuracy of dating techniques improves in the future, it may become possible to more definitively associate such geomorphic features with sea level history.
EARLY POST-GLACIAL HISTORY
The reborn Penobscot River must have extended itself rapidly, both headward and seaward. Although the Bølling warm peak had passed by 14 ka (Fig. 4) and the climate was descending into the Younger Dryas, it is safe to assume that the ice sheet had not fully adjusted to the rapid warming of the previous millennium and was still retreating. Concurrently, the river was being extended southwards as isostatic rebound and relaxation of the gravitational pull of the ice sheet on the sea generally outpaced global sea level rise from melting ice sheets, and relative sea level was falling (Kelley et al. 2013).
Further south along the East Branch, there are several terraces and discontinuous subhorizontal gravel-mantled surfaces that may be parts of terraces. Some of these are shown on earlier reconnaissance maps (Newman 1986; Newman and Genes 1986). The surfaces were not mapped in detail and are not shown on maps herein. They lie, 1 to as much as 12 m above the modern floodplain, and are underlain by gravel consisting of rounded pebbles and small cobbles. In some cases, the gravel is overlain by 1.5–2 m of fining-upward silty fine to medium sand.
The highest such surface that we found is ~4 km north of Medway on the east side of the river. Exposures in the track of a woods road suggest that it is composed of gravelly fine sand. It is ~20 m below the marine limit. Its origin, and that of two other gravel-mantled surfaces at similar heights shown on Newman’s (1986) map, are problematic. They do not appear to be extensive enough to represent a valley fill associated with the rebirth of the river, but they are well below the marine limit, and thus unlikely to be ice-marginal subaerial kames. Lower terraces, those 1 to 2 m above the present floodplain, are likely straths cut during Holocene downcutting.
The modern floodplain is inset into these lower terraces. It, too, is discontinuous and is underlain by alternating beds of pebble gravel, fine to medium sand, and poorly sorted silt and very fine sand, commonly fining upward. At a depth of ~2 m there is an abrupt change to pebble-small cobble braidplain gravel. This gravel bed appears to extend all the way to the present coast (Hooke et al. 2016). The gravel was likely eroded from the eastern slopes of the esker and the deltas in early post-glacial time when discharges were higher and while the Penobscot River was extending itself southward.
Transition to fine-grained sedimentation
The transition from the gravel unit to fine-grained sedimentation in the lower terraces likely occurred at ~10 ka (Hooke et al. 2016). We suspect the transition represents, primarily, the demise of significant quantities of Laurentide ice in the Penobscot River drainage, which probably occurred ~11 ka as there was still a significant amount of residual ice in this area at 12.5 ka (Borns et al. 2004). In addition, Moosehead Lake stopped draining into the Penobscot River at about this time as isostatic rebound tilted the lake southward, switching its drainage to the Kennebec River (Kelley et al. 2011). Finally, where transverse bedrock sills had become exposed in the river bed, the lowered stream gradient upriver from them reduced the competence of the river (Kelley and Sanger 2003, p. 125). Accordingly, the gravel beneath the sand in these lower terraces is inferred to rest on strath surfaces created during downcutting.
SUMMARY AND CONCLUSIONS
As the Laurentide ice sheet retreated across the Penobscot Lowland between 15.7 and 15.1 ka and up the East Branch between 15.1 and 14 ka, the area was isostatically depressed and inundated by the sea. Retreat across the Lowland was rapid, averaging ~200 m/a; retreat up the East Branch slowed to ~76 m/a. During pauses in the retreat up the East Branch ten deltas were formed. As the deltas occupy a 32-km stretch of the valley, they were likely deposited over a time span of ~420 years (32 km/76 m·a-1).
At the northing of the low Seboeis delta, land became exposed in the bottom of the valley of the East Branch at ~14 ka: the Penobscot River was reborn. Between ~14 and ~12 ka, the Penobscot extended itself, both to the north as the ice retreated, and to the south as relative sea level fell, building a braidplain in the process—the 118-m braidplain. Once relative sea level had fallen ~4 m, it appears to have stabilized briefly, resulting in regrading of the 118-m surface to form the Deasey surface and possibly in erosion of the shoreline nips in several deltas.
Discharges were likely larger than at present during this time span as ice was still melting in the headwaters and the diversion of flow from the Penobscot basin into the Kennebec River at Moosehead Lake had not yet occurred. Differential rebound was incomplete so the river gradient was lower. Despite this lower gradient, the high discharges transported gravel eroded from the eastern slopes of the esker and deltas and deposited it on strath surfaces all the way to the coast.
After a further drop of ~3 m in relative sea level, another brief period of stability led to regrading that formed the Owen surface at ~112 m, leaving the Deasey surface as a terrace.
Although the periods of stable relative sea-level that resulted in the remarkably uniform heights of the deltas of the East Branch and in the Deasey and Owen terraces apparently occurred close to the time of MWP-1A and 1B, it is presently impossible to relate these periods of stability to specific events in the global sea level curve.
Initial downcutting from the Owen surface was likely driven by falling sea level, but more recently a decline in sediment load and an increase in the river gradient due to isostatic tilting have probably played a role. Lowered discharge at ~10 ka resulted in a transition to fine-grained over-bank sedimentation.
Support for this study was provided primarily by the University of Maine Geomorphology Research Fund with additional support from the School of Earth and Climate Sciences at the University of Maine and the Luminescence Geochronology Laboratory at the University of Nebraska. Sarah Wheatley provided first-class assistance in the field in 2014. Xavier Allègre and Susan and Mark Adams assisted with the level survey. Walter Anderson and Woodrow Thompson provided constructive reviews that resulted in significant improvements in the manuscript.