Articles
Fixation and redistribution of arsenic during early and late diagenesis in the organic matter-rich members of the Lockatong Formation, Newark basin, USA:
implications for the quality of groundwater
ABSTRACT
The Byram and Walls Island members in the lower and upper sections, respectively, of the Lockatong Formation in the Newark basin near the border between Pennsylvania and New Jersey were chosen to assess (i) the role of euxinic/anoxic conditions in sequestering arsenic (As) and other trace elements and (ii) the redistribution of these elements during catagenetic transformations. These members are rich in organic matter and host pyrite which occurs as disseminations, small patches, and subparallel veins. The sulfur isotope values of pyrite samples range between -7.5 and 0.5 ‰CDT (average = -3.5 ‰CDT). The negative δ34S values are indicative of Bacterial Sulfate Reduction (BSR) under low temperature and euxinic/anoxic conditions. The total organic carbon (TOC) values in this member fluctuate between 0.5 and 2.1%. These euxinic/anoxic conditions enhanced the incorporation of As and other trace elements in both organic matter and pyrite. The As concentrations range from 13 to 800 mg/kg and from 1.4 to 34 mg/kg in pyrite and black shale samples, respectively. Rock Eval analyses reveal that organic matter is over-mature which altered the correlation between TOC and As. The thermal cracking of organic matter resulted in the removal of these elements from organic matter and their subsequent incorporation in pyrite and bitumen. Organic matter- and pyrite-rich anoxic black shale layers and bitumen veins are potential sources of arsenic in groundwater in the Newark basin, with arsenic values that reach up to 215 μg/L.
RÉSUMÉ
Les membres des îles Byram et Walls dans les sections inférieures et supérieures, respectivement, de la formation Lockatong dans le bassin Newark près de la frontière de la Pennsylvanie et du New Jersey ont été choisis pour évaluer: (i) le rôle des conditions euxiniques et anoxiques dans la séquestration de l’arsenic (As) et d’autres éléments traces; (ii) la redistribution de ces éléments durant les transformations catagénétiques. Ces membres sont riches en matière organique et contiennent de la pyrite qui se présente sous forme de disséminations, de petites plaques et de veines subparallèles. Les valeurs isotopiques du soufre des échantillons de pyrite varient de -7,5 à 0,5 ‰ CDT (moyenne = -3,5 ‰ CDT). Les valeurs négatives δ34S indiquent la présence de bactéries sulfato-réductrices qui ont réduit les sulfates à basse température et dans des conditions euxiniques et anoxiques. Les valeurs du carbone organique total (COT) dans ces membres varient entre 0,5 et 2,1 %. Ces conditions euxiniques et anoxiques ont renforcé l’incorporation de l’As et d’autres éléments en traces, tant dans la matière organique que dans la pyrite. Les concentrations d’As varient entre 13 et 800 mg/kg et de 1,4 à 34 mg/kg dans les échantillons de pyrite et de schiste noir, respectivement. Les analyses Rock-Eval révèlent que lamatière organique présente une maturité avancée, altérant la corrélation entre le COT et l’As. Le craquage thermique de la matière organique a causé l’expulsion de ces éléments de la matière organique et leur incorp-oration subséquente dans la pyrite et le bitume. Les couches anoxique de schiste noire riche matière organique et en pyrite ainsi que les niveaux riche en veines de bitume sont des sources potentielles d’arsenic dans l’eau souterraine du bassin Newark, avec des valeurs d’arsenic atteignant jusqu’à 215 μg/l.
[Traduit par la redaction]
INTRODUCTION
1 Arsenic is a poisonous element that poses a health hazard in drinking water worldwide. It has an average crustal concentration of 1.8 mg/kg (Smedley and Kinniburgh 2002). Occurrences of geogenic arsenic have been found in the bedrock aquifers in the northeastern United States, leading many researchers to investigate different possible controls on the amount of As in these aquifers (Ayotte et al. 2003; Serfes et al. 2005; Lipfert et al. 2006; Peters and Burkert 2007; Peters 2008; Serfes et al. 2010; Ryan et al. 2013; Ryan et al. 2015; Blake and Peters 2015; O’Shea et al. 2015). These authors related the high As concentration either to the nature of the bedrock aquifers and/or to the geological processes affecting the bedrock (e.g., crustal recycling of As in the northern Appalachian mountain belt, Peters (2008); degree of metamorphism in western New England, Ryan et al. (2015)).
2 Newark basin groundwater has arsenic concentrations that exceed the standard limit (<10 μg/L) set by the USA Environmental Protection Agency (EPA) in public-water supplies. Fifteen percent of the 94 sampled New Jersey public-supply wells that tap the Lockatong and Passaic formations had As concentrations greater than 10 μg/L (Serfes et al. 2005). Two major sources of arsenic have been identified in the Newark basin: pyrite and hematite. Pyrite has been identified as the main source of As in black shale of the Lockatong Formation (Serfes et al. 2005; Serfes et al. 2010; Blake and Peters 2015; Rddad 2016). Hematite has been identified as another source of As in red mudstone of the Passaic Formation (Serfes et al. 2005). An increase in the amount of As has been also linked to the amount of organic matter in the Lockatong Formation aquifer (Serfes et al. 2005; Serfes et al. 2010; Blake and Peters 2015). Red mudstone, grey shale, and black shale of the Passaic and Lockatong formations in the Newark basin contain As concentrations of as much as 14.8, 50, and 240 mg/kg, respectively (Serfes et al. 2005). Although the As content is higher in black shale layers compared to grey and red beds, no positive correlation occurs between total organic carbon (TOC) values and As concentration in the black shale (Rddad 2016). Besides the control by abundance of organic matter on the amount of As, the degree of organic matter (OM) maturity, which can alter the OM-As relationship, is another control that should be taken into consideration. The purpose of this paper is to (i) investigate the conditions under which As and other TE were incorporated into both organic and inorganic phases, (ii) determine, if possible, the organic matter contents (TOC, pyrolyzable carbon (PC), and residual carbon (RC)) to which As is mainly linked, and (iii) the impact of the degree of OM maturity in the redistribution of As in different available organic (bitumen) and inorganic phases (pyrite). Ultimately, this study aims at verifying if the bitumen veins are potential sources of As in groundwater. It should be noted that the processes of mobilization of As from the bedrock to the groundwater are beyond the scope of this paper; readers are referred to Serfes et al. (2005, 2010) and Blake and Peters (2015) who investigated the processes that remobilize As from pyrite and released it into the groundwater.
3 The Walls Island and Byram members in the Nursery core and the Walls Island Member in the Titusville core were sampled because they represent the organic matter-rich members of the Lockatong Formation. To complete this project, sulfur isotope analysis of pyrite, As and other trace element analyses of black shale, pyrite, and bitumen, and Rock-Eval analyses of black shale were performed.
GEOLOGY
Geological setting
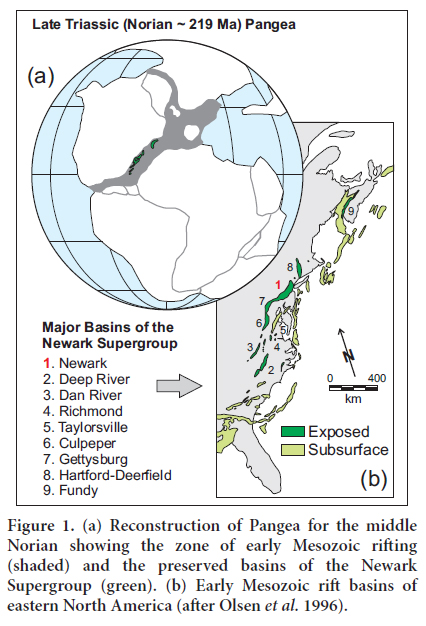
4 The early Mesozoic Newark basin is one of the most studied Newark supergroup rift basins in the northeastern United States (Fig. 1). The Newark basin is an elongate half-graben that is 190 km long and up to 50 km across (Olsen 1986). The Precambrian and early Paleozoic rocks representing the southwestern Appalachian part of the New England upland border the Newark basin to the northeast. To the southeast, the basin is bordered by the Paleozoic and Precambrian Appalachian highlands of the Blue Ridge and Piedmont provinces (Olsen 1980). The Appalachian highlands are the result of collisions between the North American continent and various Gondwanan fragments, including Africa, during the Paleozoic, leading to the formation of the supercontinent Pangea (e.g., Nance and Linneman 2008).
 Display large image of Figure 1
The Newark basin underwent rifting during the breakup of Pangea and the opening of the Atlantic Ocean (Manspeizer 1988). During this continental rifting, the Triassic extensional tectonic activity led to the reactivation of Paleozoic NE-SW-trending major faults, and subsequently the formation of a half-graben (Ratcliffe et al. 1986; Schlische et al. 2003). The resulting basin was filled by 6 to 8 km of non-marine, lacustrine sediments intercalated with a few basaltic flows (Olsen et al. 1996). The sediments were derived from weathering and erosion of the surrounding Precambrian and Paleozoic highlands (Schlische and Olsen 1990), which consist mainly of granitic gneiss, schist, and minor mafic rocks (Serfes et al. 2010). The main sources of arsenic were the mafic and sulfide minerals (Van Houten 1964; El Tabakh and Schreiber 1998; Serfes et al. 2010). Overlying the Precambrian–Paleozoic basement are Triassic–Jurassic fluvio-lacustrine formations (Olsen 1986), which are listed and briefly described below from oldest to youngest:
- Stockton Formation (1800 m) – alluvial/fluvial arkosic and sandstone facies.
- Lockatong Formation (1000 – 2000 m) – mainly cyclic organic matter-rich black shale and grey to red mudstone, siltstone, and sandstone facies with intercalations of argillaceous carbonate (e.g., Van Houten 1964; Olsen 1986).
- Passaic Formation (2800 m) – mainly red mudstone and sandstone containing evaporites with minor lacustrine black shale beds.
- Jurassic rocks (300 – 400 m) – clastic sedimentary rocks intercalated with basaltic flows and intruded by fine-grained gabbro.
Lithostratigraphic description of the sampled core
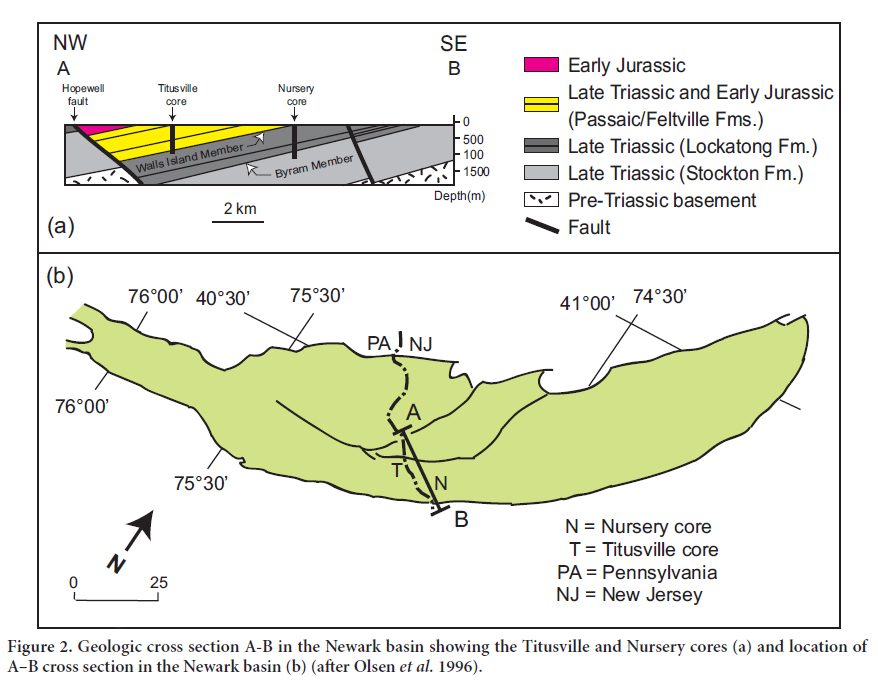
5 The samples for this study were collected from the Walls Islands Member and the Byram Member which, respectively, represent the upper and lower organic matter-rich sections of the Lockatong Formation (Fig. 2). Two cores were chosen for this project: the Titusville and Nursery cores (Fig. 2). These cores represent part of 6770 m of core obtained from the Newark Basin Continental Drilling Project (NBCDP).
 Display large image of Figure 2
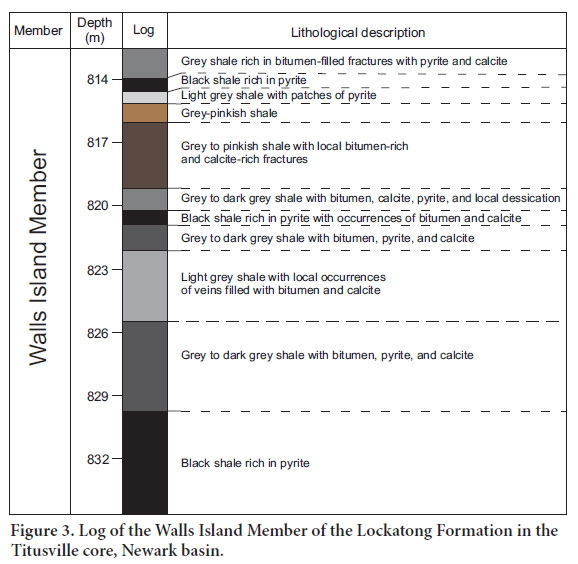
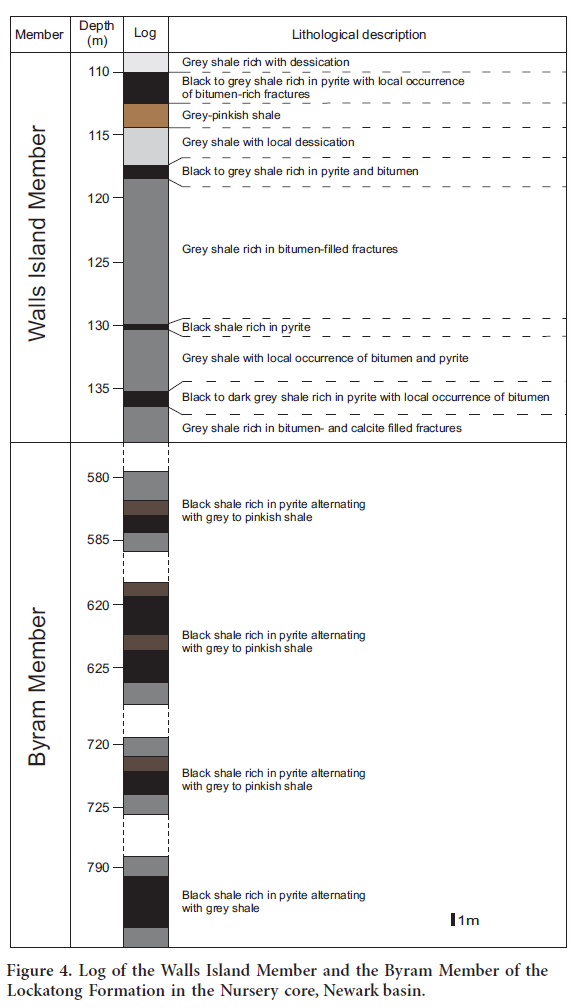
6 The Walls Island and Byram members, described in Figures 3 and 4, consist mainly of black shale intercalated with grey to light grey shale and pinkish-grey shale. This succession reflects the development of small-scale anoxic events (black shale) separated by oxic to suboxic events (light grey to pinkish-grey shale). The black shale, typically rich in organic matter, contain pyrite as disseminated, euhedral to subhedral, millimetre- to centimetre-size crystals, and as small horizontal veins. The light grey to pinkish-grey shales commonly host numerous bitumen–filled fractures typically associated with calcite.
 Display large image of Figure 3
 Display large image of Figure 4
SAMPLING AND METHODS
7 Seven samples of black shale and six samples of pyrite were collected from the Walls Island and Byram members of the Lockatong Formation in the Nursery and Titusville cores of the Newark basin. Six shale samples were collected at different depths from dark layers and one from a light grey layer. Pyrite samples were exclusively collected from dark layers. Two bitumen samples were collected from the bitumen-rich veins hosted in the grey shale in the Nursery and Titusville cores.
8 Pyrite samples were carefully crushed and handpicked under a binocular microscope. Isotopic analyses were carried out on five samples at the spectrometry facility at the Department of Engineering, University of Nevada. Sulfur isotope analyses were performed using a Eurovector elemental analyzer connected to a Micromass isoprime stable isotope ratio mass spectrometer, after the methods of Giesemann et al. (1994) and Grassineau et al. (2001). Sulfur isotopic compositions in pyrite samples are expressed as δ 34 S values relative to the Vienna Canyon Diablo Troilite (VCDT) standard. Reproducibility was ±0.2‰ for sulfur.
9 Analyses of arsenic and other trace elements in black shale and bitumen samples were performed at Activation Laboratories Ltd (Actlabs) using INAA (Instrumental Neutron Activation Analysis). INAA is an analytical technique dependent on measuring gamma radiation induced in the sample by irradiation with neutrons. The primary source of neutrons for irradiation is usually a nuclear reactor. Each activated element emits a “fingerprint” of gamma radiation which can be measured and quantified. Routine multi-element analyses by INAA are performed on practically any material from the smallest sample which can be weighed accurately to very large samples. A 30 g aliquot of sample is encapsulated in a polyethylene vial and irradiated with flux wires, standards, and blanks at a thermal neutron flux of 7 × 10¹² n.cm-2s-1. The samples are measured the next day for the induced Au-198 photopeak at 411.8 KeV. Samples are compared to a calibration developed from multiple international reference materials. After a 7-day period to allow Na-24 to decay the samples are counted on a high purity Ge detector with resolution of better than 1.7 KeV for the 1332 KeV Co-60 photopeak. Using the flux wires, the decay-corrected activities are compared to a calibration developed from multiple certified international reference materials. The standard provides a check on accuracy and is not used for calibration purposes. From 10–30% of the samples are rechecked by re-measurement. For values exceeding the upper limits, assays are recommended. One standard is run for every 11 samples. One blank is analyzed per work order. Duplicates are analyzed when samples are provided.
10 The analysis of bitumen for As and other TE using laser ablation-inductively coupled plasma-mass spectrometry (LA-ICP-MS) was attempted. The bitumen samples did not ablate very well and intensities on almost all masses were very low and signals were unstable. Moreover, carbon-derived standards were not used. Therefore, the results from the LA-ICP-MS of the bitumen are not considered here.
11 The total organic carbon (TOC) analyses of the black shale samples were also performed at Actlabs. The C-Organic is calculated according to the following equation: C-Organic = Total C – CCO2 – C Graphitic . Carbon analysis is performed by the absorption of IR energy which can be attributed only to carbon dioxide (CO2) which absorbs IR energy at a precise wavelength within the IR spectrum. The concentration of CO2 is detected as a reduction in the level of energy at the detector. It can be measured in either an inert atmosphere or an oxygen atmosphere (binding carbon species with the oxygen to form CO (converted to CO2 prior to detection) and CO2, the majority being CO2, and is measured as carbon dioxide in the IR cell as gases flow through the IR cells. Energy from the IR source is absorbed as the gas passes through the cell, preventing it from reaching the IR detector. All other IR energy is prevented from reaching the IR detector by a narrow bandpass filter. Because of the filter, the absorption of IR energy can be attributed only to carbon dioxide (CO2). The concentration of CO2 is detected as a reduction in the level of energy at the detector.
12 Programmed pyrolysis was performed on 12 black shale samples using Rock-Eval 6 in the commercial laboratories of Weatherfordlab (www.weatherfordlabs.com). The Rock-Eval technique is used to identify the type of organic matter, assess the source rock potential, and the thermal maturity of organic matter (Tissot and Welte 1978). Approximately 100 mg of sample was powdered and placed in an inert atmosphere (helium) and combusted at a programmable temperature from 250°C to 550°C, and a speed of 25°C/min. A detailed description of the procedure is given by Espitalié et al. (1985). Pyrolyzed hydrocarbons and carbon dioxide are measured as a function of temperature, where S1 represents free hydrocarbons in the kerogen and S2 represents pyrolyzable hydrocarbons generated by pyrolysis related to the petroleum-generating potential of the sediment. S2 is normalized to TOC to calculate the hydrogen index (HI), which is proportional to the kerogen elemental H/C ratio. In a similar way, the pyrolyzable CO2 is measured and normalized to TOC to determine the oxygen index (OI), which is in some cases proportional to the kerogen elemental O/C ratio. Tmax is the temperature at which the S2 peak reaches its maximum evolution.
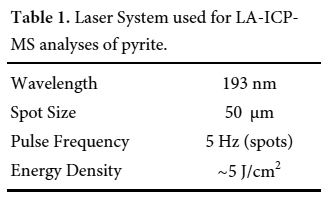
13 Trace elements were analyzed in six pyrite samples using laser ablation-inductively coupled plasma-mass spectrometry (LA-ICP-MS) at the U.S Geological Survey in Denver. Images of grains of interest were used to guide LA-ICP-MS analyses. A Photon Machines Analyte G2 LA system (193 nm, 4 ns excimer) was coupled to a PerkinElmer DRC-e ICP-MS. Spot analyses were used for individual analyses of known location. Typical operating conditions for these analyses are listed in Table 1. Ablation was carried out using a 50-micrometre spot size at 5 J/cm2. Single spot analyses were ablated using 5 pulses/sec (5 Hz). Ablated material was transported via a He carrier gas to a modified glass mixing bulb where the He + sample was mixed coaxially with Ar prior to the ICP torch. Concentration and detection limit calculations were conducted using the protocol of Longerich et al. (1996). Signals were calibrated using USGS MASS-1 sulfide reference material (Wilson et al. 2002). The reference material (MASS-1) was analyzed 5-10 times at the beginning of the analytical session and monitored throughout the session for drift. Iron (57Fe) was used as the internal standard for concentration calculations. Signals were screened visually for heterogeneities such as micro-inclusions or zoning.
RESULTS AND DISCUSSION
14 The sulfur isotopes in pyrite, arsenic concentrations in pyrite, black shale, and bitumen samples, total organic carbon (TOC), and Rock-Eval data are reported in Tables 2–5.
Sulfur isotopes
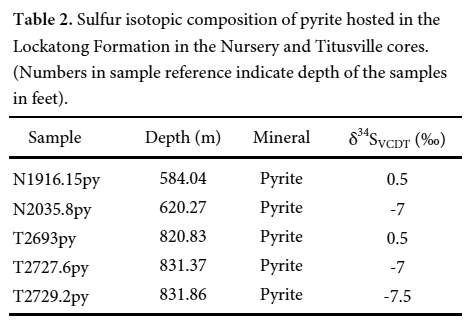
15 The δ34S values for pyrite range between -7.5 and +0.5 ‰CDT (average = -3.5 ‰CDT, n = 5) (Table 2). These values are lower than those of Triassic seawater (δ34S = +11 to 20 ‰) and Jurassic seawater (δ34S = +14 to 18‰) (Fig. 5) (Claypool et al. 1980). This indicates that the Newark basin was isolated from the open ocean. On the basis of Sr isotopic composition of sulphates in the Passaic Formation, El Tabakh et al. (1997) reached the same conclusion. Triassic–Jurassic seawaters are, therefore, excluded as a source of sulfur. This leads to the conclusion that the source of sulfur may be the dissolved sulfates carried by streams to the lake.
 Display large image of Table 2
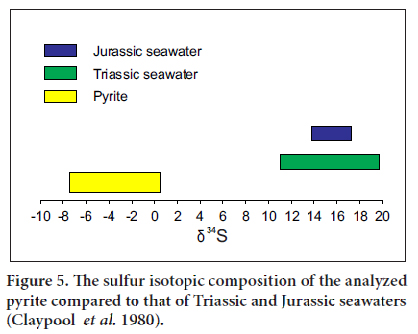 Display large image of Figure 5
16 Two pathways are possible for reducing sulfates via bacterial sulfate reduction (BSR): open and closed systems, depending on the availability of dissolved sulfates (Machel 2001; Gomes and Hurtgen 2013, 2015).
17 Under open conditions (i.e., oxidizing to slightly reducing) where dissolved sulfate is continuously replenished, the dissolved SO4-2 will be reduced to light 32S which will be incorporated in pyrite. Conversely, under closed conditions (i.e., euxinic), where dissolved SO42 is limited, all available dissolved sulfates will be reduced to sulfur. As the sulfate reduction continues, the light isotope is incorporated in pyrite while the remaining/residual sulfate reservoir becomes enriched in heavy 34S (e.g., Jørgensen 1979; Gautier 1986; Lyons 1997). Therefore, the δ34S in pyrite becomes heavier with time.
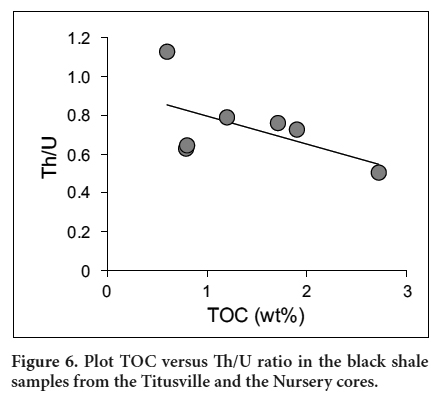
18 The low negative δ34S values recorded in pyrite samples are indicative of BSR under slightly reducing conditions. It is also possible that BSR took place under closed conditions where most of the pyrite formation occurred before enrichment of 34S in the remaining sulfate reservoir (Sælen et al. 1993). Pyrite is known to form under the reducing conditions found in black shales (Berner 1984). Low Co/ Ni ratio (<1) and the high concentration of Ni in the pyrite samples suggest syngenetic/diagenetic origin of these pyrite grains (Loftus-Hills and Solomon 1967; Bajwah et al. 1987) in an organic-rich environment (Dill and Kemper 1990; Guy et al. 2010). The Th/U ratios in black shales can be used to estimate the paleo-redox conditions because of the contrasting behavior of Th and U (Tribovillard et al. 2005; Pattan and Pearce 2009). Lower Th/U values indicate anoxic conditions whereas higher values point to dysoxic and oxic conditions (Jones and Manning 1994; Pattan and Pearce 2009). The very low Th/U values for the analyzed black shale samples (Th/U = 0.50–1.13) indicate strong anoxic conditions in which organic matter was accumulated and the analyzed pyrite grains were formed. This conclusion is supported by the inverse correlation between Th/U ratio and TOC values (Fig. 6) and the abundance of pyrite in organic matter-rich black shales in the sampled members.
 Display large image of Figure 6
19 In conclusion, the reduced sulfur is derived from the BSR of dissolved sulfate in euxinic/ anoxic conditions. This sulfur combined with the reactive available iron to form diagenetic pyrite. The latter are more abundant in the OM-rich black shales.
Arsenic in pyrite
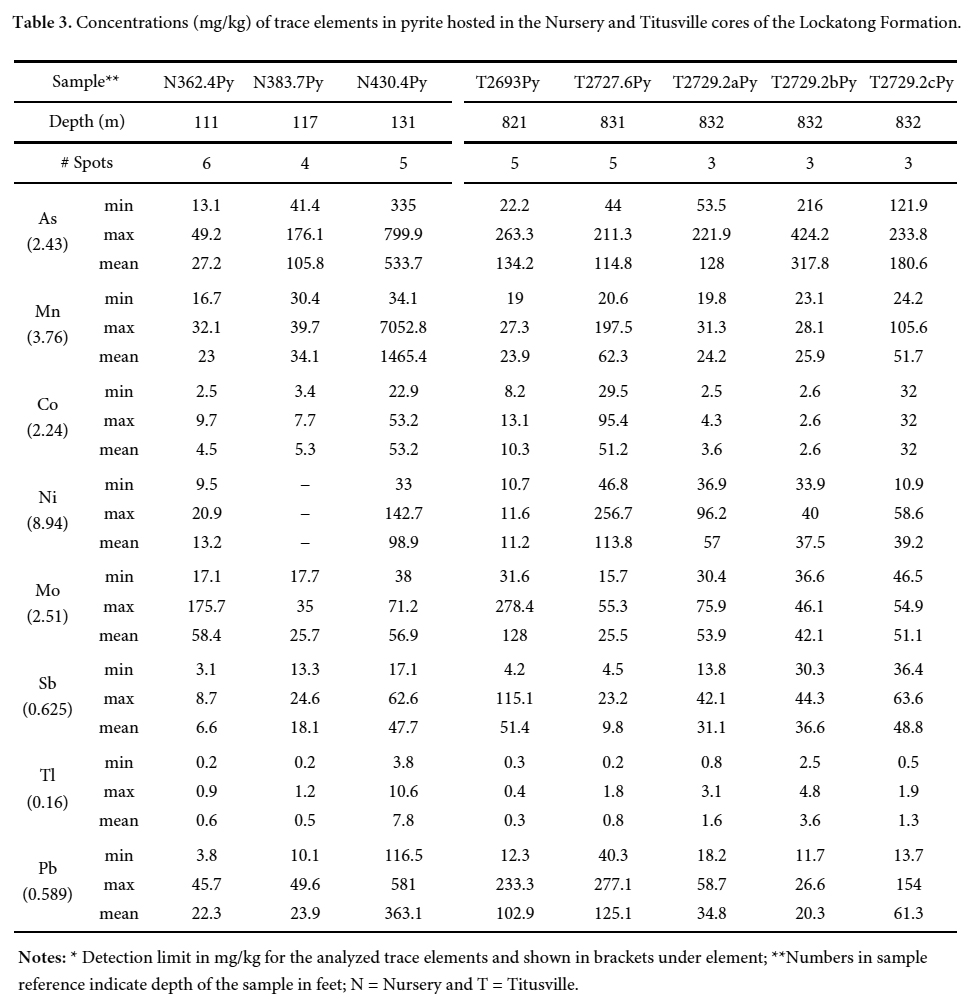
20 Arsenic values in the pyrite samples range from 13 to 800 mg/kg (mean = 217 mg/kg) and from 22 to 425 mg/kg (mean = 165 mg/kg), respectively, in the Nursery and Titusville cores (Table 3). The concentration of arsenic in pyrite of the Newark basin can reach a maximum range of 3,000 to 40,000 mg/kg (Serfes et al. 2005). Pyrite is considered as a potential sink for arsenic in the Newark basin (Serfes et al. 2005) and also for other TE, particularly Pb, Ni, Mo, and Co. The other trace element concentrations in pyrite show the following trend As>Pb>Ni>Mo>Mn>Co>Sb>Tl for the Nursery core samples and As>Pb>Mo>Ni>Mn>Sb>Co>Tl for the Titusville core samples. The incorporation of As in pyrite may have facilitated that of other TE due mainly to the significant distortion/defects of the pyrite structure (Deditius et al. 2008). At the sample scale, the core of centimetre-sized pyrite crystals is enriched relative to the rims (Fig. 7). This enrichment is explained by the removal of arsenic by early pyrite crystals, which caused depletion in the remaining residual fluid. Serfes et al. (2005) reached the same conclusion.
 Display large image of Table 3Notes: * Detection limit in mg/kg for the analyzed trace elements and shown in brackets under element; **Numbers in sample reference indicate depth of the sample in feet; N = Nursery and T = Titusville.
 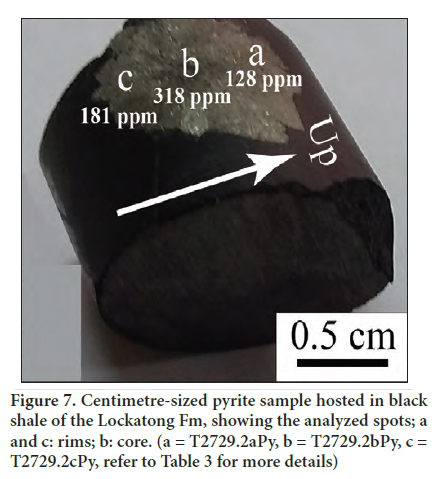 Display large image of Figure 7
Quantity and maturity of organic matter
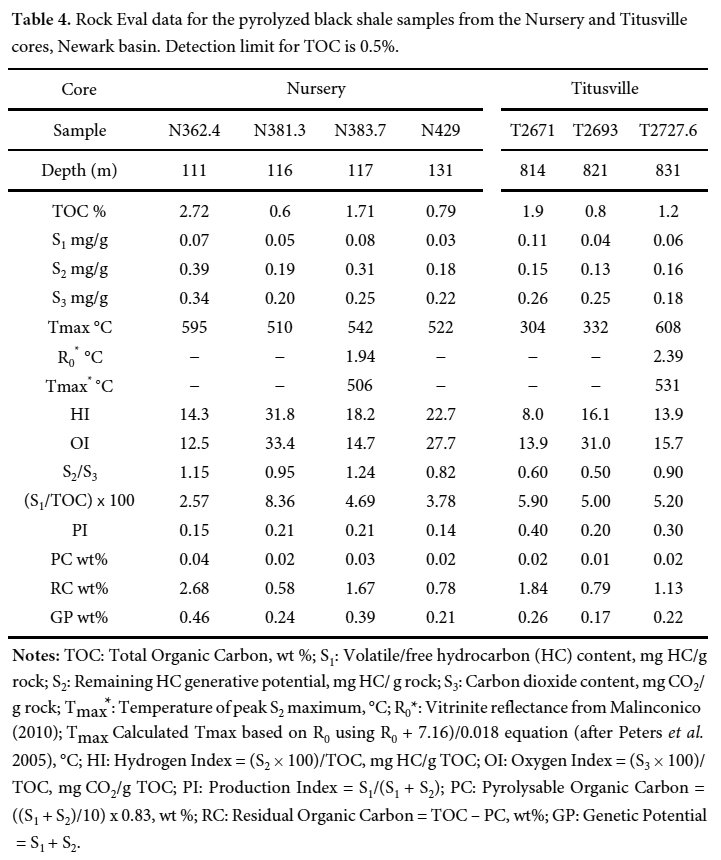
21 The TOC values vary between 0.6 and 2.72% and between 0.8 and 1.9%, respectively, in the Nursery and Titusville cores (Table 4). These values indicate that the black shales are relatively rich in organic matter and are considered as fair to good source rocks for hydrocarbons (petroleum and gas).
 Display large image of Table 4Notes: TOC: Total Organic Carbon, wt %; S1: Volatile/free hydrocarbon (HC) content, mg HC/g rock; S2: Remaining HC generative potential, mg HC/ g rock; S3: Carbon dioxide content, mg CO2/g rock; Tmax : Temperature of peak S2 maximum, °C; R0*: Vitrinite reflectance from Malinconico (2010); Tmax Calculated Tmax based on R0 using R0 + 7.16)/0.018 equation (after Peters et al. 2005), °C; HI: Hydrogen Index = (S2 × 100)/TOC, mg HC/g TOC; OI: Oxygen Index = (S3 × 100)/TOC, mg CO2/g TOC; PI: Production Index = S1/(S1 + S2); PC: Pyrolysable Organic Carbon = ((S1 + S2)/10) x 0.83, wt %; RC: Residual Organic Carbon = TOC – PC, wt%; GP: Genetic Potential = S1 + S2
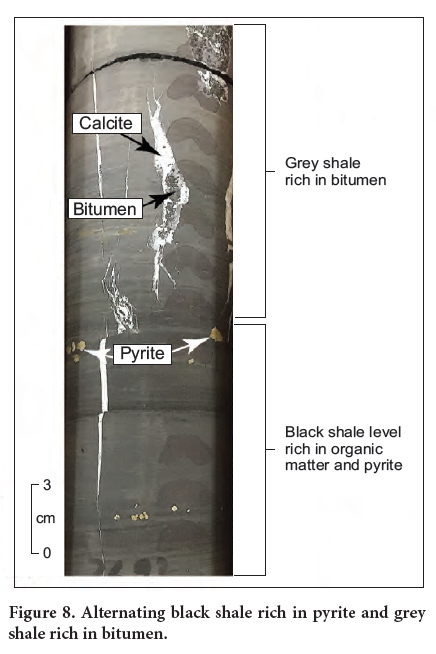
22 The hydrogen index (HI) of the analyzed samples is less than 100 mg HC/g TOC, indicating that the organic matter in the analyzed samples seems to be is kerogen of type III. The HI values were not originally low, but rather reveal loss in hydrogen content due to organic matter maturity. The Tmax values are widespread (304–608°C) and are unreliable due to the very low S2 values. Using the equation Tmax = (R0 + 7.16)/0.018 (Peters et al. 2005) and the available R0 data (1.94 to 2.69% (Malinconico 2010), the calculated Tmax range from 506 to 531°C (Table 4). These Tmax values indicate that organic matter of the analyzed samples is over mature and had already generated hydrocarbons (oil and gas). In fact, the presence of bitumen in the cores (Fig. 8) indicates that the organic matter in these rocks had already generated hydrocarbons.
 Display large image of Figure 8
Arsenic in black shale and bitumen
23 The arsenic values for black shale samples from the Nursery core range from 15.4 to 33.6 mg/kg (mean = 21.9 mg/kg) with one value (1.4 mg/kg) recorded in a light grey sample (Table 5). The arsenic values vary between 17.1 and 22.9 mg/kg (mean = 20.3 mg/kg) for black shale samples from the Titusville core (Table 5). These values generally fall within the range of those determined by Serfes et al. (2010) (10–110 mg/kg; mean = 60 mg/kg) for the Newark basin, and by Blake and Peters (2015) (10–35 mg/kg; mean = 23 mg/kg) for the Newark and Gettysburg basins. Other analyzed TE, in particular Mo, Cr, Th, and U, show high concentrations reaching a maximum of 230, 90, 15.9, 14.6 mg/kg, respectively. Ni shows concentrations below detection limit (<20 mg/kg). Some of these elements (Mo, Cr, U, As) are redox-sensitive trace elements that indicate anoxic to euxinic conditions under which organic matter is deposited (Tribovillard et al. 2006).
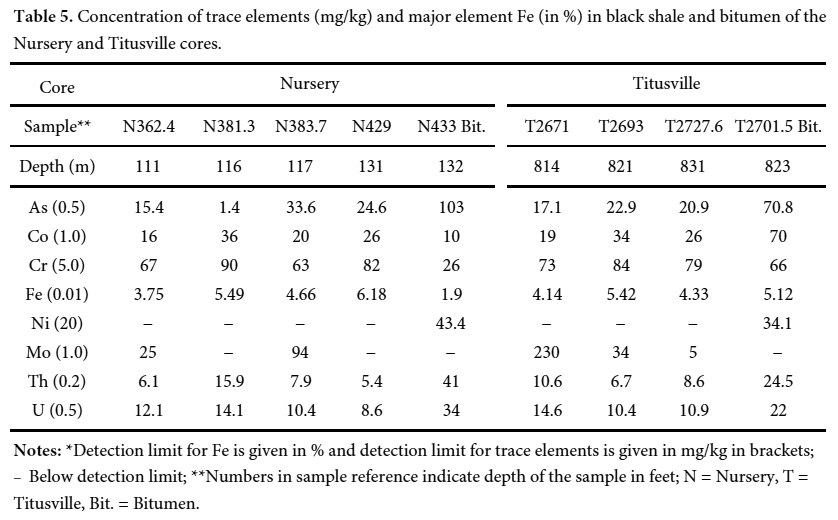 Display large image of Table 5Notes: *Detection limit for Fe is given in % and detection limit for trace elements is given in mg/kg in brackets; − Below detection limit; **Numbers in sample reference indicate depth of the sample in feet; N = Nursery, T = Titusville, Bit. = Bitumen.
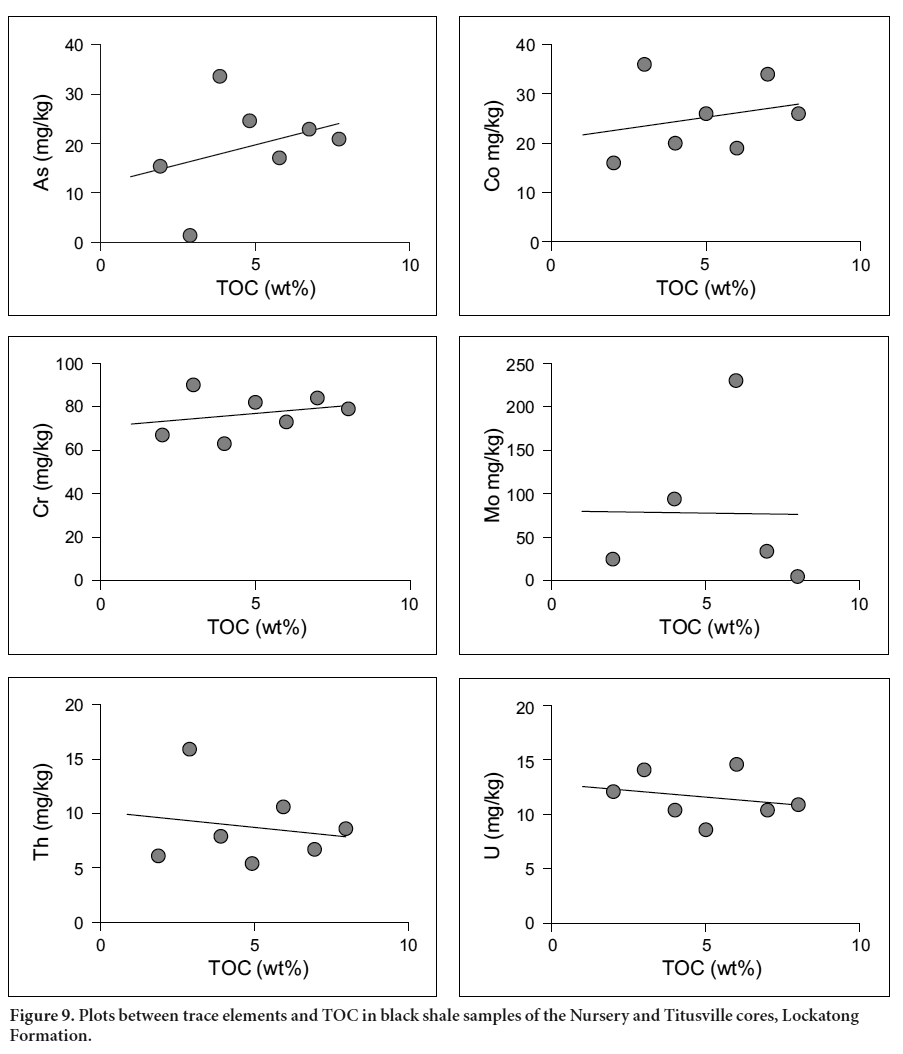
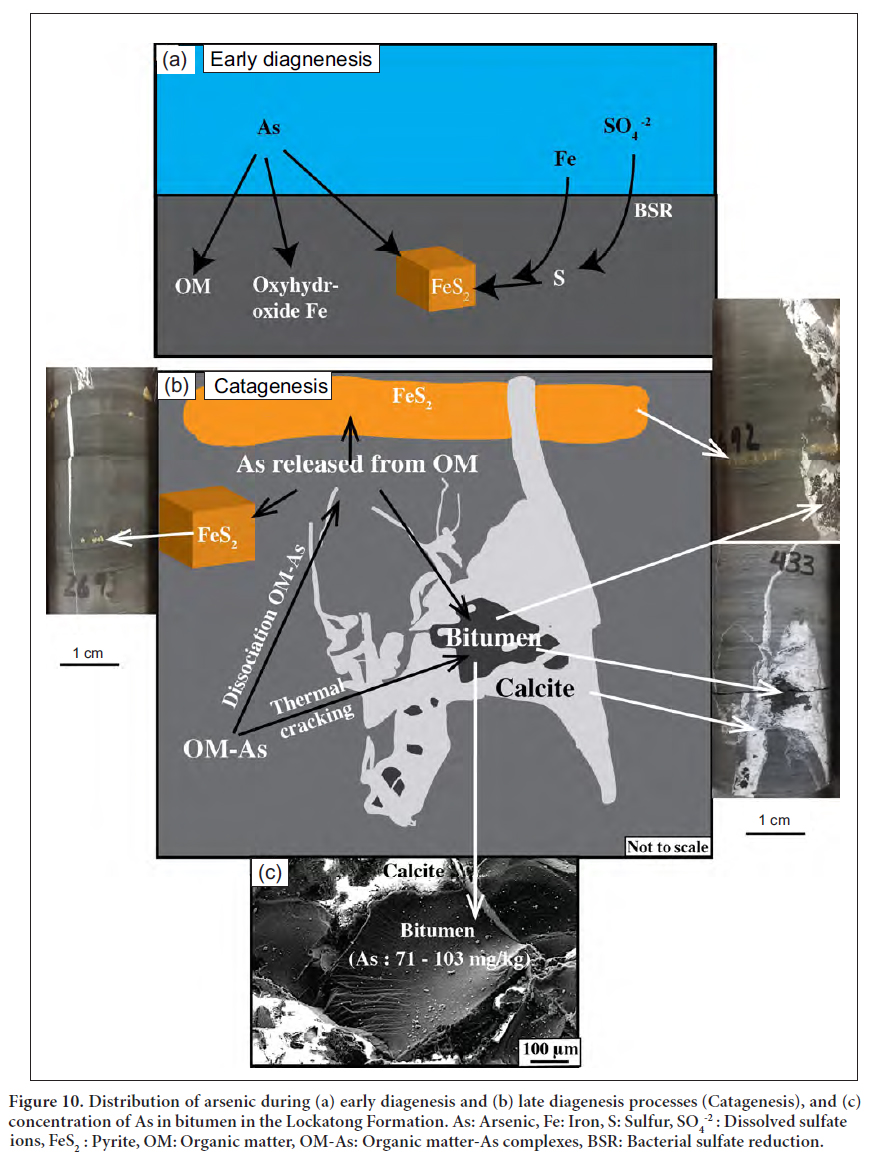
 24 It is known that arsenic and other TE are commonly absorbed onto organic matter through bio-concentration of elements by organisms during sedimentation (Arthur et al. 1988) and the chelation of elements during early diagenesis (Disnar 1982, 1996; Trichet at al. 1987). Through the plots of As versus organic matter phases/contents (TOC, PC, RC), it is possible to find out the organic matter phase to which As is mainly linked. Due to the over-maturity of the OM, PC is tremendously reduced (PC = 0.01–0.02 wt%). Therefore, correlation between As and PC is not possible. Given that TOC≈RC, only correlation between TOC and As is attempted. A plot of As versus TOC in the black shale samples reveals weak correlation between organic matter and trace elements, including As (Fig. 9). This suggests a priori the absence of geochemical affinity between OM and As. Two explanations are proposed to account for the absence of the OM-As affinity. First, the arsenic is likely partitioned into OM, diagenetic pyrite, and oxyhydroxide phases (Fig. 10a). The competition of these three phases (OM, pyrite, oxyhydroxide) in sequestering arsenic resulted in the lack of positive correlation between As and OM. Second, the over- maturity of organic matter altered the expected positive covariance between As and TOC (Fig. 9).
 Display large image of Figure 9
 Display large image of Figure 10
25 Diagenetic processes are known to induce the transfer of some arsenic from organic matter to pyrites (Tribovillard et al. 2006). This arsenic expulsion from organic matter and its incorporation into pyrite led to the further enrichment of pyrite relative to black shales (Fig. 10b).
26 During early diagenesis, the decomposition of organic matter resulted in the release of arsenic from organic matter and its incorporation in pyrite. Due to the intense maturity of the OM, it is likely that most of the arsenic was transferred from organic matter to pyrite during catagenetic processes. The latter took place during active subsidence where organic matter of the Lockatong Formation including the Walls Island and Byram members in both the Titusville and Nursery cores underwent catagenetic transformation. This catagenesis reduced the amount of the original TOC initially preserved in the black shale. Consequently, a fraction of the metal endowment, initially concentrated in organic matter during sedimentation and early diagenesis, was released and migrated along with the hydrocarbons (bitumen) (Fig. 10c). Dissociation of the organo-elements complexes resulted in the lack of a positive correlation between these elements and organic matter. A fraction of the expelled elements was subsequently incorporated into pyrite whereas the other fraction was partitioned into the bitumen phase, which contains high arsenic concentration (71–103 mg/kg) (Table 5). The overpressure caused by the accumulation and saturation of hydrocarbons within the pores may have cracked the rocks (hydraulic fracturing) liberating the arsenic, other TE, and hydrocarbons. The As-rich bitumen migrated from the adjacent organic matter-rich black shale and subsequently filled the available fractures typically hosted in grey shale (Fig. 8). The As-rich bitumen fractures can be considered as a potential source of arsenic in groundwater.
Model for arsenic fixation and redistribution during diagenetic processes
27 The proposed model for the fixation and redistribution of arsenic is illustrated in Figure 10. The development of euxinic/anoxic conditions was crucial in the fixation of arsenic and other trace elements in pyrite and organic matter. These conditions enhanced the preservation of organic matter, the production of sulfur via BSR, and ultimately the formation of pyrite in the presence of reactive iron (Fig. 10). These reducing conditions promoted the incorporation of arsenic and other trace elements in organic matter during sedimentation and early diagenesis. These elements were also incorporated in the diagenetic pyrite. The latter has been considered as a potential sink for arsenic in organic matter-rich shale in the Newark basin (Serfes et al. 2005; Blake and Peters 2015; Rddad 2016) and in other locations worldwide (Huerta-Diaz and Morse 1992; Tribovillard et al. 2006). During the catagenetic transformation of OM, a fraction of arsenic and other trace elements would have been expelled from OM-rich black shale and incorporated in pyrite and bitumen (Fig. 10). The latter migrated and filled small fractures in the adjacent grey shale (Fig. 8).
28 This model clearly shows that the organic matter richness, dependent on anoxic conditions during sedimentation and early diagenesis, and the degree of organic matter maturity, dependent on later diagenetic/ catagenetic processes, are the important controls on the amount of As in black shale and groundwater. The anoxic events developed in the Newark basin correspond to OM- and pyrite-rich black shale facies of the Lockatong Formation. These facies extend laterally over large distances. Given the fact that the Lockatong Formation is over-mature, the anoxic, dark layers with high TOC values and the associated abundant bitumen rich-veins help to predict the regions of high arsenic concentration in groundwater. The remobilization of arsenic from pyritic black shale is achieved through the oxidation of pyrite releasing arsenic which is subsequently adsorbed onto hydrous ferrous oxide (Serfes et al. 2010). While Arsenic can be derived from the oxidation of pyrite, it can be also sourced from bitumen-rich fractures. In fact, given the fact that the black shale in the Lockatong Formation has very low permeability, the groundwater flows mainly through available interconnected small fractures commonly filled with arsenic-rich bitumen. It follows that these bitumen-rich fractures can be also potential source of arsenic contaminating the groundwater in the Newark basin. Moreover, the interconnected small fractures offered suitable contact surfaces between flowing groundwater and As-rich pyritic black shale. The groundwater flowing through these veins removes arsenic from As-rich pyritic black shale causing As contamination of the groundwater.
CONCLUSIONS
29 Based on the geochemical data presented in this paper, the following conclusions can be drawn.
- Euxinic/anoxic conditions enhanced the preservation of OM, the generation of sulfide via BSR during early diagenesis, and subsequent formation of diagenetic pyrite. The latter is a potential sink for arsenic and other trace elements as has been proposed previously by Serfes et al. (2005). The development of these euxinic/anoxic conditions controls the original concentration of As in the pyritic black shale.
- The thermal cracking of organic matter has caused the dissociation of the organo/inorganometallic complexes resulting in the release of arsenic and other TE. These elements were subsequently incorporated into pyrite and bitumen.
- The bitumen-rich veins are enriched in arsenic, and are considered as source of As in groundwater.
- Considering the low permeability of the Lockatong Formation, the groundwater is forced to flow through the numerous interconnected veins and consequently leaches arsenic from black shale and oxidizes available pyrite minerals. This further contributes to the arsenic contamination of the groundwater.
The author would like to thank Dr. P. Olsen of Columbia University and Drs. D. Kent and J. Browning of Rutgers University for providing the samples for this project. I also thank Alan Koenig of the USGS, Denver, for analyzing pyrite samples with LA-ICP-MS. I am also grateful to two anonymous journal reviewers whose comments and suggestions greatly improved the quality of the paper. I am also grateful to Dr. MaryAnn Malinconico of the Lafayette College, PA for the fruitful comments on organic matter section. I also thank journal co-editor Dr. Chantel Nixon for handling the reviewing process, and co-editor Dr. Sandra Barr for handling and copy-editing the paper. I am also grateful to Kingsborough’s Associate Provost Dr. Reza Fakhari for his ongoing support. I also thank Robert Schenk, Scanning Electron Microscope operator at the Physical Science Department of Kingsborough Community College, for assisting me locate the bitumen for trace element analysis. This project has also benefited from a Geological Society of America grant for one of my undergraduate students and from CUNY Research Scholars Program (CRSP) that supported one of my scholar students.