Articles
Tracking rapid landscape change with repeated photography, Gros Morne National Park, Newfoundland, Canada
ABSTRACT
At various coastal and inland sites in and around Gros Morne National Park in western Newfoundland, photographs taken periodically over many decades illustrate the physical stability of landforms. These images provide a convenient, qualitative way to track the development of stone rings and patterned ground, the movement of rocks along intertidal platforms, changes to marine estuaries and to alluvial rivers and fans, temporal trends in late-lying snow beds along mountain tops, and slope failure by landslides and rock falls. This study has established a spatial and temporal photographic record of slope failures along the steep cliffs of Western Brook Pond, showing that nearly all of the sites identified in earlier studies as high risk of failure have remained stable. In contrast, thin-skinned landslides along Winter House Brook have remained active for at least 100 years. Little evidence of physical changes in patterned ground features in Trout River Gulch was found, other than frost-heaving in soils disturbed by road construction. Fluctuations from year to year in the level of gravel beaches along parts of the coast are common, and blow-outs continue to modify coastal sand dunes. Apart from certain engineered sites where change was obviously driven by direct human activities, the immediate cause or “driver” of change was natural (non-human), the result of gravitational instability, heavy precipitation, wave and storm action, frost heaving, and other background processes of the sort that long predate the coming of people to the region. Continuation of this kind of inexpensive, non-invasive monitoring can assist in assessing ecological integrity, managing public safety, and interpreting landscape processes for Park visitors.
RÉSUMÉ
Des photographies prises périodiquement pendant de nombreuses décennies à divers emplacements côtiers et intérieurs du parc national du Gros-Morne et à proximité de celui-ci, dans l’ouest de Terre-Neuve-et-Labrador, illustrent la stabilité physique des formes de relief. Ces images offrent un moyen commode et qualitatif d’observer le développement des cercles de pierre et des sols structurés, le déplacement des roches le long des plates-formes intertidales, les changements aux estuaires maritimes, ainsi que les rivières et cônes alluviaux, les tendances temporelles des combes à neige près de la cime des montagnes et les ruptures de versant attribuables aux glissements de terrain et aux éboulements. Cette étude a permis d’établir un dossier spatial et temporel photographique des ruptures de versant le long des parois escarpées de la gorge de l’étang Western Brook, ce qui montre que presque tous les emplacements qui ont été inventoriés plus tôt comme présentant des risques élevés de rupture sont demeurés stables. En revanche, les glissements de terrain pelliculaires le long du ruisseau Winter House sont demeurés actifs pendant au moins cent ans. Les éléments des sols structurés de Trout River montrent très peu de signes de changements physiques, autres que le soulèvement par le gel de sols perturbés par la construction de routes. Les fluctuations d’année en année du niveau des plages de gravier situées le long de sections de la côte sont fréquentes, et les creux de déflation continuent de modifier les dunes côtières. À part certains emplacements aménagés où les changements étaient de toute évidence causés par des activités humaines directes, la cause immédiate des changements était naturelle (non humaine), soit le résultat de l’instabilité gravitationnelle, de fortes précipitations, de l’action des vagues et des tempêtes, du soulèvement par le gel et d’autres contextes géologiques de fond qui ont précédé l’arrivée d’humains dans la région. La poursuite de ce genre de surveillance peu coûteuse et non invasive peut aider à évaluer l’intégrité écologique, assurer la sécurité publique et interpréter le processus de formation du paysage pour les visiteurs du parc national.
[Traduit par la redaction]
INTRODUCTION
1 About 25 years ago I began a personal effort to see if any local geological changes could be detected on sequential photographs of a site taken from the same vantage point under similar lighting conditions. Over the next two decades more than forty individual sites within and near Gros Morne National Park (GMNP) were photographed at various intervals and relevant earlier images were identified. In 2015, at the request of Park management, I assembled, catalogued, and described several thousand photographs that had been taken over the years (Berger 2015). Many useful older images were found in the Peabody Museum of Yale University, the Provincial Archives of Newfoundland and Labrador, the extensive assemblage of slides and photos at GMNP, the historical photo collection on the Town of Woody Point, and from various personal holdings. Successive air photos and Google Earth images were used for some locations, but any future work should make more extensive use of these resources.
2 The rationale for this project came from several initiatives dealing with rapid geological change. Beginning in the late 20th century, various government agencies in Canada began to produce State-of-the-Environment reports to inform the public on the condition of the environment. Much effort was spent on developing a range of indicators that could be measured and tracked from one report to the next, with emphasis on biological and ecological features. Generally missing were data on water, rocks, and soils, which provide the physical base for trees, plants, animals, and other ecosystem components. Accordingly, an effort to bring in geological components to environmental indicators was launched in 1992 by the International Union of Geological Sciences (IUGS), with the aim of developing tools that could be used to assess rapid abiotic landscape changes. Geoindicators were defined as “measures (magnitudes, frequencies, rates, trends) of geological processes and phenomena, occurring at or near the earth’s surface and subject to changes that are significant for understanding environmental change over periods of 100 years or less” (Berger and Iams 1996). For more than a decade, IUGS worked with national agencies and scientific groups in many countries to organize a series of workshops on geoindicators, and a number of scientific articles on the topic were published (see www.lgt.lt/geoin for details).
3 It was early recognized that parks and other protected areas where human activities are restricted can provide a kind of baseline for assessing regional environmental change. A summary of projects to track changes in Gros Morne’s ecosystems and landscapes (Anions and Berger 1998) emphasized the importance of tracking rapid geological change in this and other protected areas. Participants at a joint Canada-US workshop in 2001 recommended that a series of geological components be tracked for GMNP (Berger and Liverman 2002). This generated a proposal for applying geoindicators to other national parks in Canada (Welch 2002, 2003 with discussions between Welch and Berger). The current Parks Canada program of environmental reporting focuses more widely on “ecological integrity”, defined in the Canada National Parks Act as “a condition that is determined to be characteristic of its natural region and likely to persist, including abiotic components and the composition and abundance of native species and biological communities, rates of change and supporting processes” (Parks Canada 2013). Although the emphasis on biological parameters remains, a number of national parks are now monitoring permafrost, coastal erosion, water chemistry, and some other abiotic components (D. Whittaker, personal communication 2016).
4 With advice from IUGS, the Geologic Division of the US National Parks Service (NPS) began in the early 2000s to identify geological “resources” that should be inventoried and monitored in individual parks and national monuments (see Berger and Liverman 2002). The NPS now has a monitoring program, which incorporates certain aspects of geoindicators (Young and Norby 2009), but which centers more broadly around “vital signs”. These track “a subset of physical, chemical, and biological elements and processes of park ecosystems that are selected to represent the overall health or condition of park resources, known or hypothesized effects of stressors, or elements that have important human values” (National Park Service 2016). The majority of national parks in the USA have now been “scoped” for their geological and other natural processes.
5 Against this developing background, my own photographic project expanded, albeit rather unsystematically, to include the following geoindicators: sand dune formation and movement, frozen ground activity, slope failure, shoreline position, stream channel morphology, and stream sediment storage and load. Three other geoindicators of potential importance to Park management do not lend themselves to photographic monitoring. The structure, extent, and composition of the extensive wetlands of GMNP are of obvious importance to the plants, wildlife and visitor experience. The extent and salinity (chemistry) of the innumerable small bodies of water in peat bogs and coastal wetlands, as well as the larger lakes and ponds, though important factors for aquatic ecosystems, were also not tracked, and neither were subsurface temperatures, which reflect surface conditions with potentially significant effects on vegetation.
MONITORING SITES
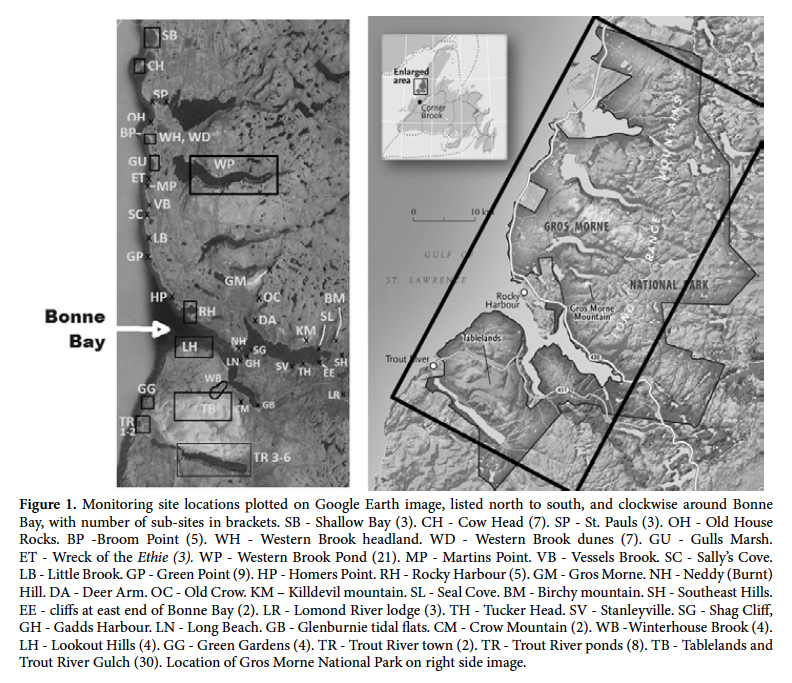
6 More than forty broad locations throughout GMNP were monitored in this project (Fig. 1, Table 1). Some of these locations are composites of up to twenty or more separate, smaller sites. Those outside Park boundaries, as at Cow Head for example, are sufficiently close to be relevant to landscape change within the park. The individual sites range in size from a square metre or less to several km in breadth, in the case of distant views. Most are readily accessible by road or boat, and can be identified from the location maps that accompanied the report to GMNP, or directly from the photos themselves. Those that are not easily reached, such as Killdevil and Crow mountains, were photographed from a distance. Of course, even small differences in the position of the camera or in the conditions of light and shade can make it difficult to compare sequential photographs taken close-up, but in more distant views this consideration is less important. The sites were chosen as the occasion arose for local visits, or after a major change such as a landslide had occurred. Some were selected for their well-known changes, as in the case of the sand dunes at Shallow Bay and the mouth of Western Brook, and the frequent slope failures along Western Brook Pond, Lookout Hills, and the inner Trout River Pond. Altogether, this study collected some 5000 colour and black and white images. They were catalogued and described in an Excel database. Each site was given a two-letter identifier (see Fig. 1), with some nearby sites grouped under one label, as along the Trout River Gulch, and Western Brook and Trout River ponds.
 Display large image of Figure 1
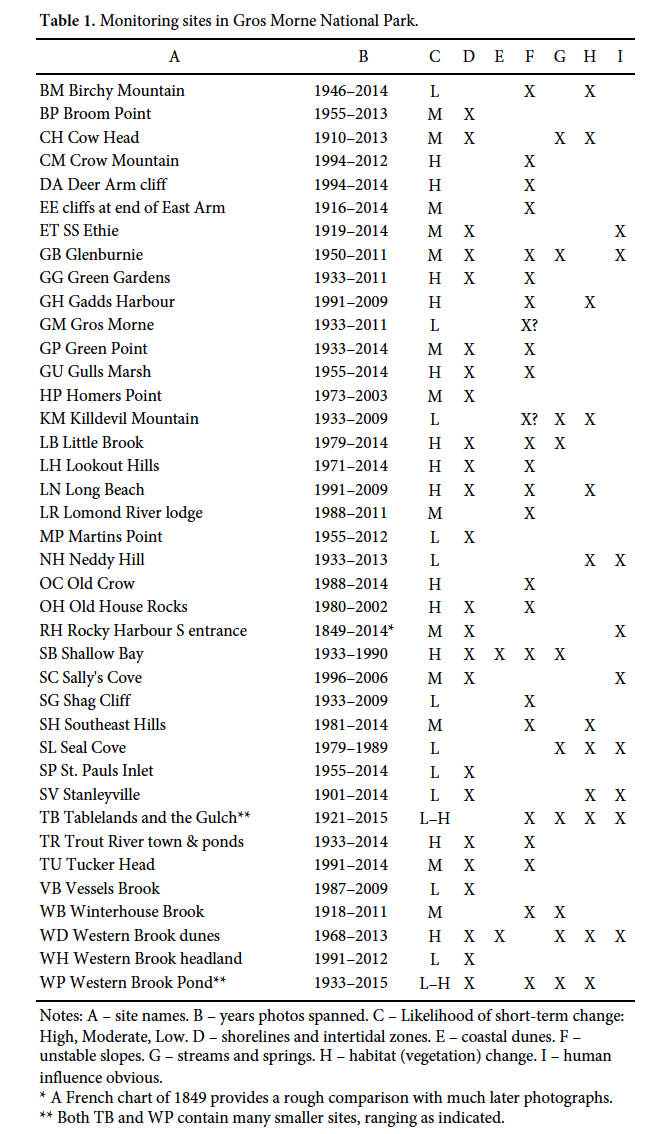 Display large image of Table 1Notes: A – site names. B – years photos spanned. C – Likelihood of short-term change: High, Moderate, Low. D – shorelines and intertidal zones. E – coastal dunes. F – unstable slopes. G – streams and springs. H – habitat (vegetation) change. I – human influence obvious.* A French chart of 1849 provides a rough comparison with much later photographs.** Both TB and WP contain many smaller sites, ranging as indicated.
 7 Four broad landscape categories received the most attention: (1) steep slopes where landslides occur, (2) coastlines where sand, gravel, and boulders can move by wave and ice action, and (3) the nearly bare surfaces of the Tablelands and Trout River Gulch where various forms of patterned ground occur, and (4) the valleys and beds of brooks and rivers where banks erode, channels switch, and sediments move. Examples of each are given below. Other processes were also observed, including the formation of travertine springs of the Tableland, the movement of sand dunes at Shallow Bay and Western Brook, the physical erosion of outcrops at Cow Head, Western Brook headland, and Winterhouse Brook, and the progressive destruction by wave action of the wreck of the S.S. Ethie.
Steep slopes
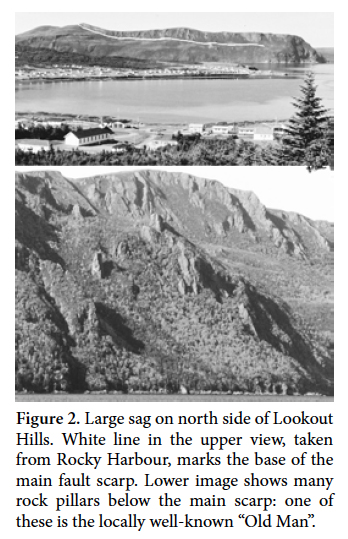
8 Landslides are an important feature in and around GMNP, using the term in its most general sense to refer to the down-slope movement of rocks, soils, vegetation, or other debris. Predicting landslides is rarely possible, and once formed, they may be reactivated many times. Many “thin-skinned” landslides occur on steep bedrock slopes with very little soil or vegetation cover. Rock falls, notoriously difficult to forecast, are common, especially in Western Brook Pond (WP) and Trout River Big Pond (TR). In several locations, slopes have “failed” in large-scale sags or slumps (“sacking”), the largest of which is on the Lookout Hills (LH - see Fig. 2; Cumming and Grant 1974; Berger et al. 1992). Along the coastline north of Bonne Bay and in the town of Trout River slumps and flows of unconsolidated glacial deposits are common, especially after heavy rains. The steep rocky cliffs around Western Head and south to Trout River are also susceptible to rock falls and landslides, but are difficult of access and were not included during this study. In several places, snow avalanches are common, as along the steep slopes at the back of Western Brook Pond, on the south side of Trout River Big Pond, and on the north side of the Lookout Hills. These can be distinguished by lack of rock debris, the effects being seen mainly on the vegetation cover.
 Display large image of Figure 2
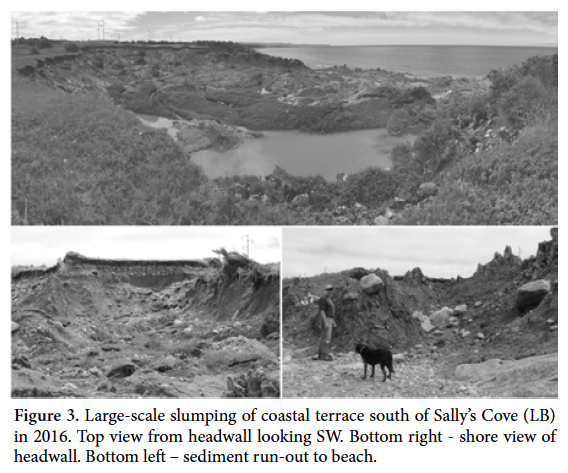
9 Aside from some bedrock cliffs, the shore north of Rocky Harbour is backed by a low escarpment consisting of glacial till and post-glacial sands, clays, and gravels. The cliff front is subject to slumping and collapse from time to time, especially after heavy rains (e.g., ET, GU, OH). The most destructive landslides in unconsolidated clays occurred in the town of Trout River in 2009 when several buildings were pushed off their base or otherwise damaged by earth flows down the side of post-glacial terrace here (Newfoundland and Labrador Department of Natural Resources 2016). A debris flow involving road construction material at Seal Cove (SL) in 1982 pushed segments of the highway some tens of metres into the Main Arm of Bonne Bay. Most of the hazardous escarpments are along seldom-visited coastal stretches, particularly the shore between Little Brook and Sally’s Cove (LB). Large-scale slumping occurred here in recent years, with the latest failure occurring in the spring of 2016 (Fig. 3). Although not tracked in this study, slumps along the steep terrace escarpment below Killdevil Lodge, Lomond, are common: eventually some of the buildings and other facilities here may have to be moved back from the terrace front.
 Display large image of Figure 3
10 Many inland slopes remain unstable and landslides active for some time, as in those on the lower reaches of Winterhouse Brook (WB), which can also be spotted on a 1918 photo taken from a low-flying airplane. Some older images show landslides and rock falls that exposed bare rock surfaces now “healed” to the extent that they cannot be readily detected by visual inspection from a distance. The scars may be obscured by growth of mineral coatings and lichen, with some surfaces taking longer to heal than others, as in the landslides on steep limestone bedrock above the mouth of Lomond River (EE) seen clearly on photographs taken in the 1930s. The progressive growth of trees and shrubs over some landslides along Trout River Big Pond and Western Brook Pond can be clearly traced over a decade or two. In contrast, some slopes may become unstable when covering trees become diseased and dieback, as can be seen along the northern slopes of Trout River Gulch. No evidence has been detected of any recent reactivation of the huge sags on Lookout Hills and on the NE corner of the Tablelands, though open tension cracks and fissures suggest that they remain potentially hazardous.
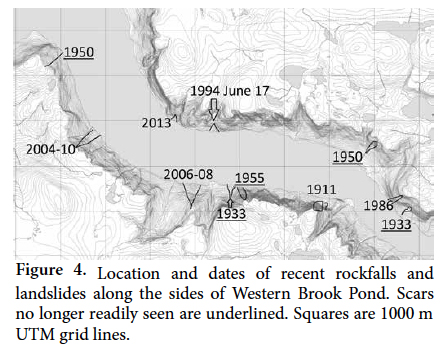
11 Along the steep to vertical cliffs of Western Brook Pond, there is a continuing hazard from falling rocks and steep landslides. Well-known locally is the story of a huge rock fall that occurred on the south side of Western Brook Pond in the early 20th century. An eye-witness account, retold many years later, reported that in October, 1911, a rock slab at or close to “Broke-Off Cliff” fell into the pond. Apparently, it generated a massive wave system that swept across the pond and out to the sea, carrying with it trees that had been knocked down (Ruffman 1998). The trimline on the opposite side of the pond below which trees were destroyed can still be faintly seen. In view of the risk to tourboat traffic along this steep-walled, fresh-water fjord, an effort was made to photograph both sides of the pond, with access by boat and helicopter provided by GMNP. In 2004,I located a series of pond-side rocks and outcrops from which the slopes opposite and/or above could be conveniently viewed: this survey was repeated in 2010, 2014, and 2015. Several landslides took place during this period, and others were dated by studying older photographs (Fig. 4). In one such location an unstable block identified by Grant (1987) apparently tumbled in 2006 to cause a prominent landslide, witnessed during one of the boat tours. This was enlarged by a subsequent slope failure in 2008, forming what is now a salient scar on the south side of the Pond (Fig. 5). However, several rock-fall scars seen clearly in photographs taken in 1933 and 1955, and a few slope failures noted in earlier studies (Grant 1987; Newfoundland Geosciences Ltd. 1988) can barely be detected today.
 Display large image of Figure 4
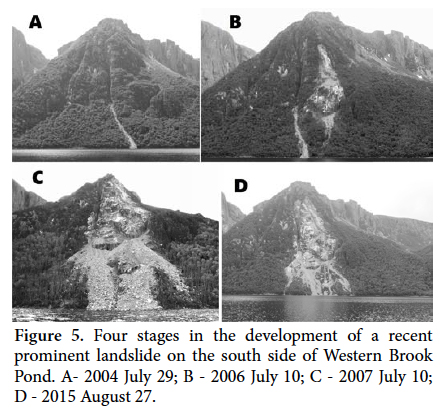 Display large image of Figure 5
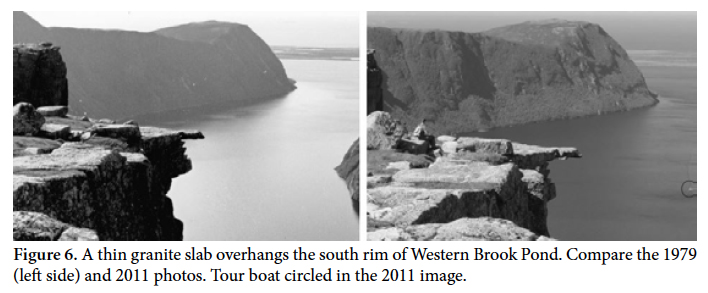
12 Along the steep to vertical cliffs of Western Brook and Trout River Big ponds, there are many places where the presence of overhanging rocks and open joints and crevasses might suggest impending failure. What is surprising, however, is that some of these features have remained stable for decades. A clear example can be seen on the south rim of Western Brook Pond, where a thin slab jutting out into space photographed in the early 1970s was still there in 2011 (Fig. 6). Most of the sites identified here by Grant (1987) and Newfoundland Geosciences Ltd. (1988) as high risk for slope failure have remained stable - so far.
 Display large image of Figure 6
Coastlines
13 Much of the shore north of Rocky Harbour is underlain by unconsolidated clay, sand, and gravel, but around Cow Head (CH) and other headlands north of Rocky Harbour, and around Bonne Bay and southwards, the coast is mostly rocky, outcropping on inter-tidal platforms and in cliffs behind (see coastal video by Forbes and Frobel 1986). An on-going monitoring program by the Geological Survey of Newfoundland (Irvine 2012, 2014) will eventually provide invaluable quantitative data about rates of coastal recession. In the meantime, the coastal features photographed in this study provide detailed information of particular locations.
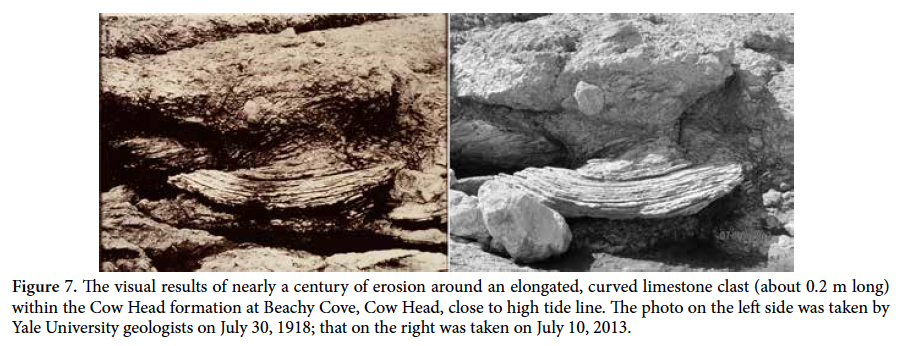
14 The only changes to most of the observed rock outcrops along the coast were minuscule. Among the earliest photographs of GMNP are those taken at Cow Head by visiting geologists from Yale University in the early 20th century. These photographs allow close comparison of tiny sites (Fig. 7) where erosion rates can be estimated. At Green Point (GP), where the Cambrian/Ordovician boundary stratotype is located, the west-facing cliff is partly composed of friable shale and fine-grained sandstone that are receding at some slow rate, not yet established: the limestone conglomerate beds here are rather more resistant to erosion.
 Display large image of Figure 7
15 Particular attention was paid to the movement of boulders and cobbles on certain intertidal platforms (CH, GU, WH, GP, RH) in an attempt to gauge the rate of downward erosion (planation). Some movement was observed, especially at Green Point and Rocky Harbour south, where the platform is wide and littered with large and small boulders that can be shifted around by storm waves and ice movements. At several sites, marked changes from time to time in the level of gravel and sand beaches were observed. At Gull’s Marsh (GU), for example, large angular boulders that “protrude” through the gravel provide an approximate base level or datum. Other beaches appeared to remain relatively stable over the period observed. No obvious changes were observed in the morphology of gravel and sand ledges at SB, SC, and SP, but the sand spit at the mouth of Western Brook is frequently modified by river currents, tides, and ocean waves.
16 Blowouts and migration of coastal sand dunes at Shallow Bay before and after the establishment of the Park are well-known, as are the erosion of fore-dunes and migration inland of sand sheets at the mouth of Western Brook (WD) (see Greenwood 1981; MacCausland 1973). At the latter place, sand sheets spread inland from coastal dunes between 1950 and 1968, but were stabilized by 2002, not by the fences constructed by Park staff to block sand movement, but by planted grasses.
Tablelands and Trout River Gulch
17 Along the top and slopes of the Tablelands and on the floor and sides of the Trout River Gulch, which borders the northern side of this rocky massif of ultramafic rocks (part of the Bay of Islands ophiolite complex), the general lack of vegetation, the bare soils, with frequent freezethaw cycles in fall and spring, suggest that movement of soils and surface rubble might be readily tracked here. The features monitored in a number of sites include latelying snow beds (zabois), active travertine springs, debris flow channels, and stone rings and solifluction lobes characteristic of periglacial terrains (Brookes 1993).
18 Downslope movements of angular rubble have been common over time along the talus slopes of the north side of the Tablelands, but most steep slopes covered by coarse rubble show little sign of movement of loose rocks during past decades. However, an old track into Winterhouse Brook canyon, which has been covered in places by new vegetation growth, appears to have been swamped by an influx of talus, and new talus chutes have appeared on the western side of Dry Brook. A narrow shallow trench on the western slopes of Table Mountain dug by hand in 1962 during exploration for chromite float had closed by downhill creep by 1991.
19 Stone polygons, rings, stripes, and other forms of patterned ground are well-known features of the Gulch floor and Tablelands slopes. Repeated photographs in seven sites in the eastern Gulch where these features are well-developed showed very little or no change within the time frame studied (Fig. 8). However, at one site on an abandoned road bed, a group of angular cobbles has clearly moved and clustered over a 23-year period (Fig. 9), showing that soil movements are still active in places. The contrast between this and the apparently stable sites may reflect the difference between substrates: areas underlain by soil and stone subject to frost heaving since post-glacial times vs unsorted road material recently deposited. Is this kind of patterned ground, once formed, capable of further morphological change, or does it remain unresponsive to further frost-heaving?
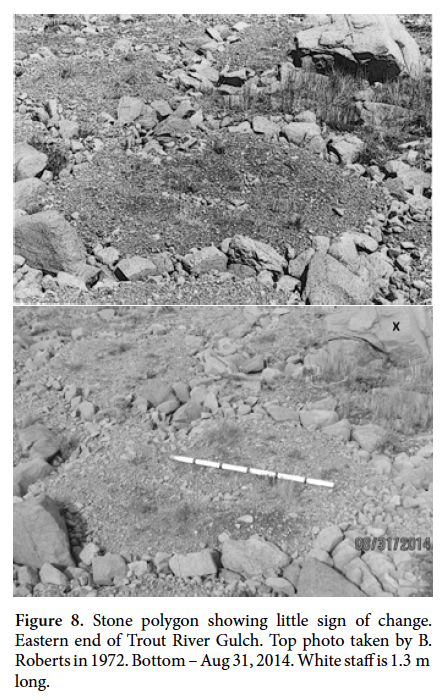 Display large image of Figure 8
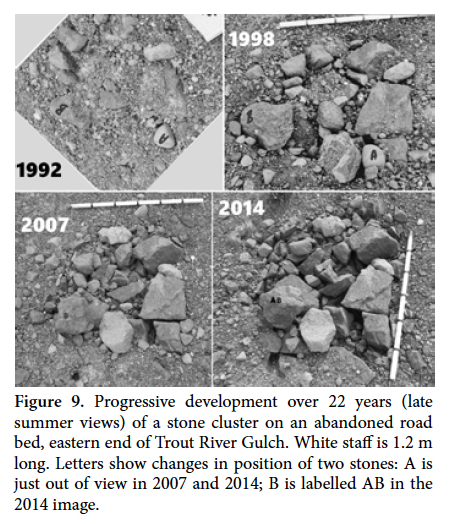 Display large image of Figure 9
20 One of the most intriguing landscape features in the Gulch is locally known as Dry Brook. This descends from the northern slopes of the Tablelands to flow across Trout River Gulch over a prominent alluvial fan composed almost entirely of coarse peridotite rubble material (Fig. 10). How this wide fan formed remains unknown, though Brookes (1993) advanced the idea that it resulted from a catastrophic post-glacial outburst from an ice-dammed barrier upstream. Dry Brook itself fluctuates between a quiescent and a high energy stream, depending on rain fall and snow melt conditions, and much of the drainage is sub-surface. Though its bed is often dry throughout the summer and fall, it flows rapidly and moves much coarse sediment after heavy rains. The road bridge over the brook runs the risk of damage because rock material undercut from its banks upstream can raise the stream bed and the level of flood waters. When the road was last paved in 2003, peridotite was removed from the stream bed just up from the bridge for road construction, leaving a straight, low-gradient scour some 12 m wide and about 600 m long (Fig. 11).
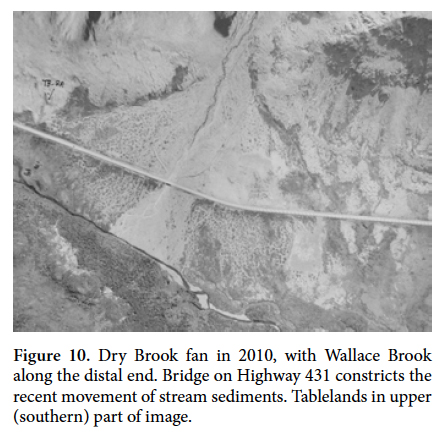 Display large image of Figure 10
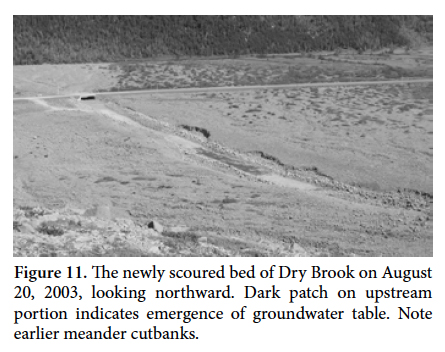 Display large image of Figure 11
21 This situation presented a rare opportunity to track changes in stream-channel morphology and stream sediment bedload - two important geoindicators. Accordingly, fifty marker boulders and cobbles of distinctive lithology were placed at surveyed localities on the scoured stream bed. A year later, only eight of these could still be found on the upstream side of the bridge, and only a few on the downstream side. Searches in subsequent years failed to locate more than a few of the original marker boulders. It appears that most had gone into storage, i.e., they were buried and immobilized under new stream bed material washed downstream and from the scour sides. In the decade since the brook was scoured, many parts of the banks of the scour have been undercut, new meanders have developed on the old scour floor, and much new material has moved over the fan, spreading out below the constriction provided by the road bridge (Figs. 10, 12).
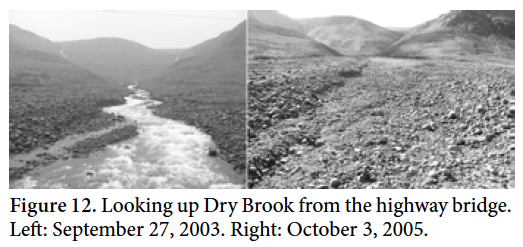 Display large image of Figure 12
ECOLOGICAL OBSERVATIONS
22 Although the primary focus was on physical changes, at many sites successive photographs provide qualitative information about changes in vegetation, especially after landscape disturbance. Where the date of the disturbance is known, some images give a rough idea of the extent to which plants and trees have recovered or established themselves anew. Bedrock landforms may be obscured by trees, shrubs, and other vegetation, and changes may be more apparent than real, for example when comparing an early June photo with one taken of the same site later in the growing season.
23 In several places the effects of earlier landslides or fire can no longer be seen, because of new vegetation cover, as at Neddy Hill (NH), Birchy Mountain (BM), and Long Beach (LN), or where landslide scars over bare rock on the sides of Western Brook Pond have faded away within a few decades (Fig. 4). In places, successive photographs can trace the recovery of tree and shrub vegetation after logging, wind damage, or dieback from infestation and disease. For example, the re-growth of trees on Cow Head is clear from the images taken in the early 20th century, when there had been much tree-cutting.
24 Lichens rarely grow on ultramafic rocks, because of the high concentrations of heavy metals, high Mg/Ca ratios, and scarce macronutrients (Favero-Longo et al. 2004). However, lichens do occur on a few peridotite outcrops along the slopes of the Tablelands where bird droppings appear to provide a ready source of N. Photographs taken over a 20-year period here show modest growth of lichens, related probably to bird visitations.
EXAMPLES WORTH NOTING
25 This study has identified short-term changes in some of the places monitored, but on the whole the landforms tracked photographically appear to be quite stable. Most of the changes noted, of course, reflect normal geological processes including slope failures, the movement of beach sands and gravels, and the downstream transport of stream sediments. However, some situations are particularly worth noting.
- It was expected that action by waves and ice would move loose boulders and cobbles on intertidal platforms, e.g., at Green Point (GP) and Western Brook headland (WH), but most of those tracked appear to have been immobile over several decades. However, movements of some boulders near the cliffs at Green Point have been noted recently.
- The long, thin gravel bars extending perpendicular to the shore at Sally’s Cove (SC) proved to be quite durable, possibly because they are draped over bedrock “reefs”.
- Marked fluctuations in the levels of the gravel beach at Gulls Marsh (GU) were readily detected.
- Frequent changes in dune morphology at Shallow Bay (SB) were noted in successive images.
- Stone rings and other kinds of patterned ground in the Gulch were expected to show change, but apart from of one evolving stone cluster on an old road bed (Fig. 9), if there were movements of the coarser stones, they were hard to detect. Such features appear to be relicts from earlier times.
- It was anticipated that the tracer boulders placed on the newly scoured bed of Dry Brook above the road bridge in 2003 (Fig. 10) would be moved rapidly downstream in periods of high stream flow, allowing transport rates to be estimated. Instead most appeared to have buried under new stream material.
- Another surprise was the sudden appearance in 2011 of a new pond upstream of the distal end of the Dry Brook fan, when Wallace Brook was dammed by an influx of stream sediment from the fan, topped by a small beaver dam. Within a few years, the new pond had drained away.
- The longevity of active landslides along the lower reaches of Winterhouse Brook (WH), seen on an oblique aerial photo taken in 1918 and still readily visible, was an anomaly in view of the fairly rapid stabilization of landslide scars on other wooded slopes by new vegetation cover.
- The photographic survey of the steep sides of Western Brook Pond provided an opportunity to assess in retrospect earlier studies and forecasts of slope conditions (Grant1987; Newfoundland Geosciences Ltd. 1988). Nearly all of the sites then identified as high risk of failure have remained stable. It was surprising to find that thin rock slabs jutting out into space above Western Brook Pond were still there 35 years after first being photographed.
DRIVERS OF CHANGE
27 With the notable exception of Dry Brook, in nearly all sites where change was noted, the immediate cause or “driver” of change was natural (non-human), the result of gravitational instability, heavy precipitation, wave and storm action, frost heaving, and other background processes of the sort that long pre-date the coming of people to the region. Of course, there is also no shortage of examples of anthropogenic environmental change within and near the Park, especially near roads, settlements, and fishing facilities. In several places tracked in this study, change was obviously driven by direct human activities, as in the case of the engineered scour of Dry Brook, the stabilization of dune sheets at Western Brook, and the 1982 debris flow of road-building material at Seal Cove. On the other hand, in Rocky Harbour, the recent construction of a major breakwater near the fish plant appears to have had remarkably little effect on stability of boulders on the adjacent intertidal platform, where modifications in wave and current patterns might have been anticipated.
28 Climate data from Rocky Harbour - the only weather station operating in or near GMNP – are available only for the period 1972–2013, with many gaps (Community Accounts 2016). No obvious trend can be seen in temperature or precipitation records. The only direct weather-related landscape feature tracked photographically here – one that might have reflected any change - was the areal extent in June of late-lying snow beds on the northern slopes of the Tablelands. Again, no consistent trend was noted over the past 25 years. Clear evidence of climate-driven modifications of landforms, such as patterned ground or solifluction lobes, would, no doubt, require a much longer period of monitoring. In the long-term, with increasing climate warming, changes in weather patterns, sea-level, stability of steep slopes, and stream hydrology seem inevitable, but in the time-frame covered in this study, these and other landscape changes were not observed.
FORECASTING CHANGE
29 Forecasting rapid geological change is a challenging task, but some processes (ecological disturbances) will certainly take place. Table 1 contains estimates of the likelihood of short-term, say ten to fifty years, change for each site monitored. Steep slopes will continue to fail from time to time, especially where soils and vegetation cover are thin, but it is not possible to predict when or precisely where a landslide, rock fall or debris flow will occur. The huge sags on the Lookout Hills and the northeastern corner of the Tablelands should remain stable for long periods, despite frequent rock falls and landslides along their outer slopes. The slopes of the Tablelands will continue to shed talus and to form new run-off channels and levees from time to time. The flow of Dry Brook itself will continue to vary greatly, and the rapid transport of steam sediments will continue to pose a threat to the road and bridge. It is fairly certain that Wallace Brook will be blocked now and then by downstream transport of sediments on the surface of the Dry Brook fan, forming new ponds that will have a significant impact on the local wetlands here. Patterned ground in the Gulch and Tablelands is expected to remain stable, except for obvious movements due to frost-heaving on engineered soils such as old road and trail beds. Sand dunes at Shallow Bay and the mouth of Western Brook will continue to erode and blow-outs to occur. The sand sheets at the latter place are expected to stabilize further as surface grasses and shrubs develop, but if these are disrupted, say by severe storms, the sand could move farther inland towards the highway.
DISCUSSION
30 Further study of some of the sites monitored here might contribute to the understanding of surficial geological processes. The relative stability of boulders and cobbles on intertidal platforms bears on models of planation and coastal recession. How the Dry Brook fan formed, how stream sediments are transported and stream channels modified, and the way groundwater moves beneath the surface here are all relevant to the origin and behaviour of piedmont alluvial fans. The stability of the large-scale slump of the Lookout Hills is of prime importance to the nearby communities and to the marine ecosystems in Bonne Bay. The re-establishment of trees, shrubs and other vegetation on new landslide scars and on sand surfaces might throw a little light on models of plant establishment and succession. A better understanding of how prominent landscape features formed and are modified will contribute to management of ecosystem health and public safety.
31 Some of the findings of this study might be usefully incorporated into Park interpretation programs. Examples include the record of slope failure - and stability - in Western Brook Pond, the recent temporary blocking of Wallace Brook by the Dry Brook fan aided by beavers, the formation of patterned ground in Trout River Gulch, and the movement of coastal sand dunes. Explanation of these phenomena could add to the field experience, form the basis of new exhibits, and help the public to appreciate better the importance of landscape processes.
32 It is my hope that this photographic project demonstrates the utility of this kind of inexpensive, non-destructive monitoring. Efforts should be made to continue repeated photography of at least those sites where recent changes have now been demonstrated, as well as other places where they might be anticipated. A spatial and temporal record of slope failures along the steep cliffs of Western Brook Pond should be tracked, for example, using LIDAR and dronemounted cameras (e.g., Danzi et al. 2013). The operators of the daily boat tours on Western Brook and Trout River ponds should be required to note and report any slope failures seen throughout the tourist season, for they are the real landslide experts here. Assessing rockfall risk could also benefit by following new techniques being used in Yosemite National Park and other places where there are significant risks to public visitors (Stock and Collins 2014).
33 Monitoring landscape change is not the kind of research that interests most scientists. Repeated photography, however, is simple enough - once sites are identified - to involve crowd-sourcing of “citizen scientists” (Whitmayer and De Paor 2014). For example, school students and teachers could find this a convenient way to learn about geology and ecology, and community members might be encouraged to become involved either on a volunteer basis or for a modest fee. Drawing in the public in this way would be cost-effective, would contribute to the local public profile of the Park, and would provide another way to increase community appreciation of Park management. It can also assist in the management of public safety (landslides, rock falls, large-scale sags and coastal slumps), the protection of special sites (e.g., the Cambrian–Ordovician boundary stratotype at Green Point), and visitor interpretation programs.
34 Future efforts at landscape monitoring should take into account experiences elsewhere with mobile technologies, including new apps to streamline field work (Camp and Wheaton 2014). It would also be worthwhile keeping a watching brief on new ideas and approaches to landscape monitoring elsewhere, especially in the Vital Signs program of the US National Park Service.
35 Though time-lapse photography, with its gentle and ephemeral footprint, has limited predictive value, it does provide a spatial and temporal record of landscape change, which can be useful for management of ecological disturbance. The most important contribution of this study to Gros Morne National Park is the baseline of photographic information on a number of places where future changes may occur. Fifty or a hundred years hence, Park managers will be able to look back to the late 20th–early 21st centuries for a visual record of landscapes and surface processes. They should, thus, be in a better position to assess the effects of climate or other environmental change.
Although for the most part this project has been a personal effort, I acknowledge gratefully assistance received from current and retired Parks Canada staff, in particular Michael Burzynski, Hugh MacCormack, Scott Taylor, and Randy Thompson. Doug Grant, Bob Stevens, and Ian Brookes, all three of whom have now died, helped to sharpen my eye for landscape details. Brookes kindly gave me many photographs from his work in Gulch in the 1970s and 1980s. The manuscript was significantly improved by comments from two anonymous reviewers and the editor.