Special Series - Enviromental Geoscience
Establishing geochemical baselines in forest soils for environmental risk assessment in the Montague and Goldenville gold districts, Nova Scotia, Canada
ABSTRACT
Mine tailings at historical gold districts in Nova Scotia, Canada, contain high concentrations of arsenic (As) and mercury (Hg), which may represent a risk to ecosystems and human health. Two sites, Montague and Goldenville, are of particular concern as tailings are located close to residences and are occasionally used for racing off-road vehicles. Risk-assessment calculations require knowledge of the naturally occurring concentrations of As and Hg in soils overlying mineralized bedrock within these gold districts. In this study, we collected samples of the top 0–5 cm of surface soil (the Public Health layer) from 46 sites near Montague, and 39 sites near Goldenville. Samples of individual soil horizons (H, Ae, B, and C) were also taken from selected sites to evaluate the vertical distribution of elements in the soil profile. Results show that the concentrations of As and Hg in all soil horizons are generally higher down-ice, southeasterly, of the ore zones in both districts, reflecting glacial erosion and transport of mineralized bedrock. Analysis of the top 0–5 cm of soils shows the following ranges in As and Hg concentrations (<2 mm size fraction): Montague: As, 4–273 mg/kg (median 42 mg/kg); Hg, 72–490 μg/kg (median 164 μg/kg); Goldenville: As, 2–140 mg/kg (median 13 mg/kg); Hg, 39–312 μg/kg (median 114 μg/kg). In general, the concentrations of As are highest in the B and C horizons, whereas Hg concentrations are highest in humus (H). Results from this study have been used to assess the distribution of tailings at these sites, and to help guide risk-management decisions.
RÉSUMÉ
Les résidus miniers des districts aurifères historiques de la Nouvelle-Écosse, au Canada, renferment des concentrations élevées d’arsenic (As) et de mercure (Hg), qui pourraient poser un risque pour les écosystèmes et la santé humaine. Deux endroits, Montague et Goldenville, suscitent des préoccupations particulières, car les secteurs de résidus se trouvent à proximité des résidences et sont occasionnellement utilisés pour des courses de véhicules hors route. Les calculs d’évaluation des risques nécessitent une connaissance des concentrations naturelles d’As et de Hg dans les sols recouvrant le substrat rocheux minéralisé de ces districts aurifères. Nous avons recueilli, dans le cadre de cette étude, des échantillons de la couche supérieure de 0 à 5 cm du sol de surface (couche déterminée par la Santé publique) de 46 emplacements près de Montague et de 39 emplacements près de Goldenville. Des échantillons d’horizons pédologiques distincts (H, Ae, B et C) ont également été prélevés en certains endroits pour l’évaluation de la distribution verticale des éléments à l’intérieur du profil pédologique. Les résultats révèlent que les concentrations d’As et de Hg dans tous les horizons pédologiques sont généralement plus élevées en aval-glaciaire, en direction sud-est, des zones minéralisées des deux districts, ce qui correspond à l’érosion et au transport glaciaires du substrat rocheux minéralisé. Une analyse des cinq centimètres de la couche supérieure des sols révèle les fourchettes qui suivent de concentrations d’As et de Hg (fraction granulométrique de moins de 2 mm) : Montague : As, 4–273 mg/kg (concentration médiane de 42 mg/kg); Hg, 72–490 μg/kg (concentration médiane de 164 μg/kg); Goldenville : As, 2–140 mg/kg (concentration médiane de 13 mg/kg); Hg, 39–312 μg/kg (concentration médiane de 114 μg/kg). En général, les concentrations d’As sont supérieures dans les horizons B et C, tandis que les concentrations de Hg sont les plus élevées dans l’humus (H). Les résultats de cette étude ont servi à évaluer la distribution des résidus miniers à ces endroits et à guider les décisions relatives à la gestion des risques.
[Traduit par la redaction]
INTRODUCTION
1 Exposure to high concentrations of metals and metalloids in soils is an issue of widespread public health concern (e.g., Oliver 1997; CCME 2006; Ernst 2012; Alloway 2013; Brevik and Burgess 2013). The abundance and spatial distribution of these elements in soils are influenced by many variables, including the composition of the underlying bedrock, the degree of weathering, biological processes, and human activity (Garrett 2013a). In Canada, extensive glaciation throughout the Quaternary Period has also played a major role in controlling the geochemistry of surface soils. Most soils across the country have developed on glacial sediments in the 8000 to 10 000 years since the last glaciation, and contain a heterogeneous mixture of material eroded from local bedrock as well as allochthonous material derived from hundreds to thousands of kilometres up-ice (DiLabio 1989; Stea and Finck 2001; Rencz et al. 2006, 2011).
2 The normal abundance of an element in an uncontaminated soil is known as the geochemical background and is characteristically a range, not a single value (Reimann and Garrett 2005). Background concentrations in soils vary from location to location and depend on the scale of the area under investigation (Reimann et al. 2009). In recent years, many authors have worked to develop standardized field, laboratory, and statistical protocols for determining geochemical background in soils to enable comparison of data generated from surveys around the globe (e.g., Reimann et al. 2005; Rencz et al. 2011; Friske et al. 2013). Robust estimates of geochemical background can be used to help develop guidelines for the protection of ecosystems and human health (CCME 2006, 2015; Health Canada 2010), to distinguish the effects of anthropogenic contamination from natural geological variability (e.g., Sanei et al. 2007; Levitan et al. 2014), and to help establish realistic remediation targets for the clean-up of contaminated sites (CCME 1996; RSSI 2002; NSE 2014). In this paper, the term ‘pre-mining background’ is used to refer to the range in element concentrations in a given soil that can be attributed solely to natural processes, whereas ‘baseline’ is used to describe the ambient concentrations of metal(loid)s at the time of sampling, including those derived from human activities.
3 Calculation of geochemical background in historical mining districts is especially challenging because of highly variable metal(loid) concentrations in surficial materials and the influence of past industrial activities (Runnells et al. 1992; Helgen and Moore 1996; Nordstrom 2015). In mineralized areas, it is common for the naturally occurring concentrations of metal(loid)s in soil, sediment, groundwater, and surface water to exceed generic environmental quality guidelines. As an illustration, the Canadian Soil Quality Guideline for As is 12 mg/kg (CCME 2015). This was derived from a background concentration of 10 mg/kg As in agricultural soils from southern Ontario and the Canadian Prairies, with 2 mg/kg added to represent the additional contamination associated with a 1 in 1 million incremental cancer risk (Health Canada 2010). However, the concentrations of As in soils from across Canada vary widely depending on the composition of the underlying parent materials and often exceed this 12 mg/kg guideline in mineralized terrain (Presant and Tupper 1966; Grosz et al. 2004; Wang and Mulligan 2006). For example, in Yellowknife, NWT, Kerr (2001) found that the concentration of As in undisturbed till overlying mineralized bedrock within the Yellowstone Greenstone Belt ranged from 7 to 1560 mg/kg, with an arithmetic mean of 153 mg/kg and a median value of 39 mg/kg (n = 67; <63 μm fraction; Instrumental Neutron Activation Analyses). Based on these results and additional data for surface soils collected by Reimer et al. (2003), a remediation objective of 160 mg/kg As was established for the clean-up of residential soils contaminated by historical gold mining and mineral processing activities in the Yellowknife area (RSSI 2002).
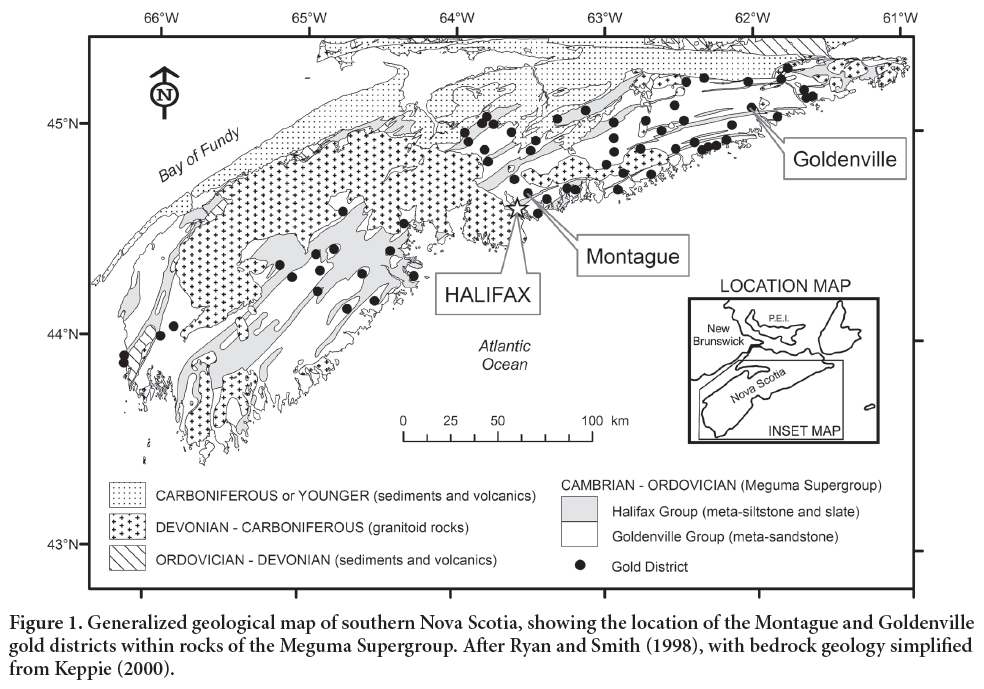
4 In Nova Scotia, As is naturally enriched in rocks, soil, sediment, surface water and groundwater throughout much of the province, particularly in areas underlain by bedrock of the Meguma Supergroup (Fig. 1; Goodwin et al. 2010). Elevated As concentrations and related health effects have been studied since the late 1970s, when a resident living near a past-producing gold district was diagnosed with chronic arsenic intoxication after drinking contaminated well water (Grantham and Jones 1977; Hindmarsh et al. 1977; Meranger et al. 1984; Dummer et al. 2015). The highest concentrations of As in Nova Scotia are found within 64 gold mining districts, which have been mined intermittently from 1861 to the present day. Arsenopyrite (FeAsS) occurs naturally in these gold deposits, and As is present at high concentrations in the mine wastes (10 mg/kg to 31 wt.%; median 2550 mg/kg; n = 482). Historically, most of the gold was recovered using Hg amalgamation, which has also led to high Hg concentrations in mine tailings (<5 μg/kg to 350 mg/kg; median 1640 μg/kg; n = 482) (Parsons et al. 2012). Recent studies of these gold districts have identified several areas where exposure to mine wastes may represent a potential risk to both ecosystem and human health, and detailed studies have been completed on the speciation, bioaccessibility, and bioavailability of both As and Hg (e.g., Winch et al. 2008; Walker et al. 2009; Meunier et al. 2010; Saunders et al. 2010, 2011; Parsons et al. 2012 and references therein). However, there is presently a lack of information on the baseline concentrations of As and Hg in surface soils from these gold mining districts. This information is needed to clarify the spatial extent of mine wastes, to assess environmental health risks, and to establish realistic remediation targets for these contaminated sites.
5 This paper summarizes results from soil sampling surveys carried out in 2007 at the past-producing Montague and Goldenville gold districts in Nova Scotia. Both of these sites contain mine tailings located close to residential properties and which are occasionally used for racing off-road vehicles. The main objectives of this study were to: (1) establish baseline concentrations of As, Hg, and other elements in soils overlying mineralized bedrock within these mine districts; (2) assess the vertical distribution of metal(loid)s in the soil, and the relative contributions of natural versus anthropogenic sources; and (3) evaluate the role of organic carbon, soil grain size, and digestion protocol in controlling metal(loid) concentrations. Results from this study can be used to support ecosystem and human health risk assessments, and to help guide management actions at historical gold mine districts in Nova Scotia and at similar sites worldwide.
GEOLOGICAL BACKGROUND
Bedrock geology and mining history
6 Orogenic lode gold deposits occur throughout southern mainland Nova Scotia, and are hosted by turbiditic metasedimentary rocks of the Cambro-Ordovician Meguma Supergroup (Fig. 1). This supergroup consists of the lower metasandstone-dominated Goldenville Group and the overlying slate-dominated Halifax Group, with a combined vertical thickness of at least 11 km. These sediments were deformed and regionally metamorphosed to greenschist and upper amphibolite facies during the mid- to late-Devonian Neoacadian Orogeny, and subsequently intruded by large volumes of mainly peraluminous granitoid rocks at ca. 385–357 Ma (White 2010). Most of the auriferous quartz veins are located within the Goldenville Group, are structurally controlled, and generally occur near anticlinal fold hinges (Ryan and Smith 1998).
 Display large image of Figure 1
7 The most abundant accessory minerals in the quartz veins include chlorite, biotite, muscovite, and plagioclase. Carbonates (ferroan dolomite to ankerite and calcite) and sulphide minerals are associated with all types of auriferous veins. Arsenopyrite is the predominant sulphide mineral, with variable amounts of pyrrhotite, pyrite, chalcopyrite, galena and rare sphalerite, and molybdenite (Kontak and Jackson 1999). Further details on the metallogeny of gold deposits in the Meguma terrane can be found in Malcolm (1929), Sangster (1990), and Ryan and Smith (1998).
8 Bedrock gold mineralization in Nova Scotia was first discovered in 1858, and mining has since been carried out in 64 gold districts, resulting in a total production of 1.2 million troy ounces of gold. The majority of this production took place between 1862 and the mid-1940s, and there has been only limited mining of gold deposits since that time (Ryan and Smith 1998). At all mines, stamp milling and Hg amalgamation were the primary methods used for gold recovery. Beginning in the 1890s, gravity separation, roasting, chlorination, and cyanidation were also added to the milling circuit at some mines to recover gold from sulphide minerals and older tailings. Historical stamp milling at lode gold mines in Nova Scotia generated more than 3 000 000 tonnes of sand- to silt-sized tailings, which were generally slurried into local rivers, swamps, lakes and the ocean (Parsons et al. 2012). Resurgence in the price of gold over the last decade has led to renewed interest in Nova Scotian deposits, and there are now numerous exploration programs underway and several new gold mines in development.
9 The Montague gold district is located in the community of Montague Gold Mines near the urban core of Halifax Regional Municipality (Fig. 1; 44.714949° N, 63.521709° W). In this district, auriferous bedding-parallel quartz veins occur mainly on the southern limb of an anticline within thin metasiltstone and slate beds of the Goldenville Group (Malcolm 1929). Gold was first discovered at Montague in 1862, and was mined intermittently until 1940. Ore was milled on-site using stamp mills and Hg amalgamation, and from 1938–1940, a cyanide plant was used to recover gold from sulphide concentrates. These mills produced approximately 121 816 tonnes of tailings, most of which were discharged directly into Mitchell Brook (Dale and Freedman, 1982; DeSisto et al. 2011; Parsons et al. 2012).
10 Goldenville was the most productive gold district in Nova Scotia and is located 3.5 km southwest of Sherbrooke in Guysborough County (Fig. 1; 45.122014° N, 62.018956° W). The district includes 105 named quartz veins interbedded with slate and metasandstone of the Goldenville Group along an east-west trending anticline (Malcolm 1929; Sangster 1990). Mining was carried out at Goldenville between 1862 and 1941, and exploration continues to the present day. Most of the gold was recovered using stamp mills and Hg amalgamation, resulting in approximately 540 617 tonnes of tailings. These mine wastes are located at several locations around Goldenville, but the majority were deposited in Gegogan Brook and are visible on the floodplain for at least 6 km downstream (Wong et al. 1999; Parsons et al. 2012).
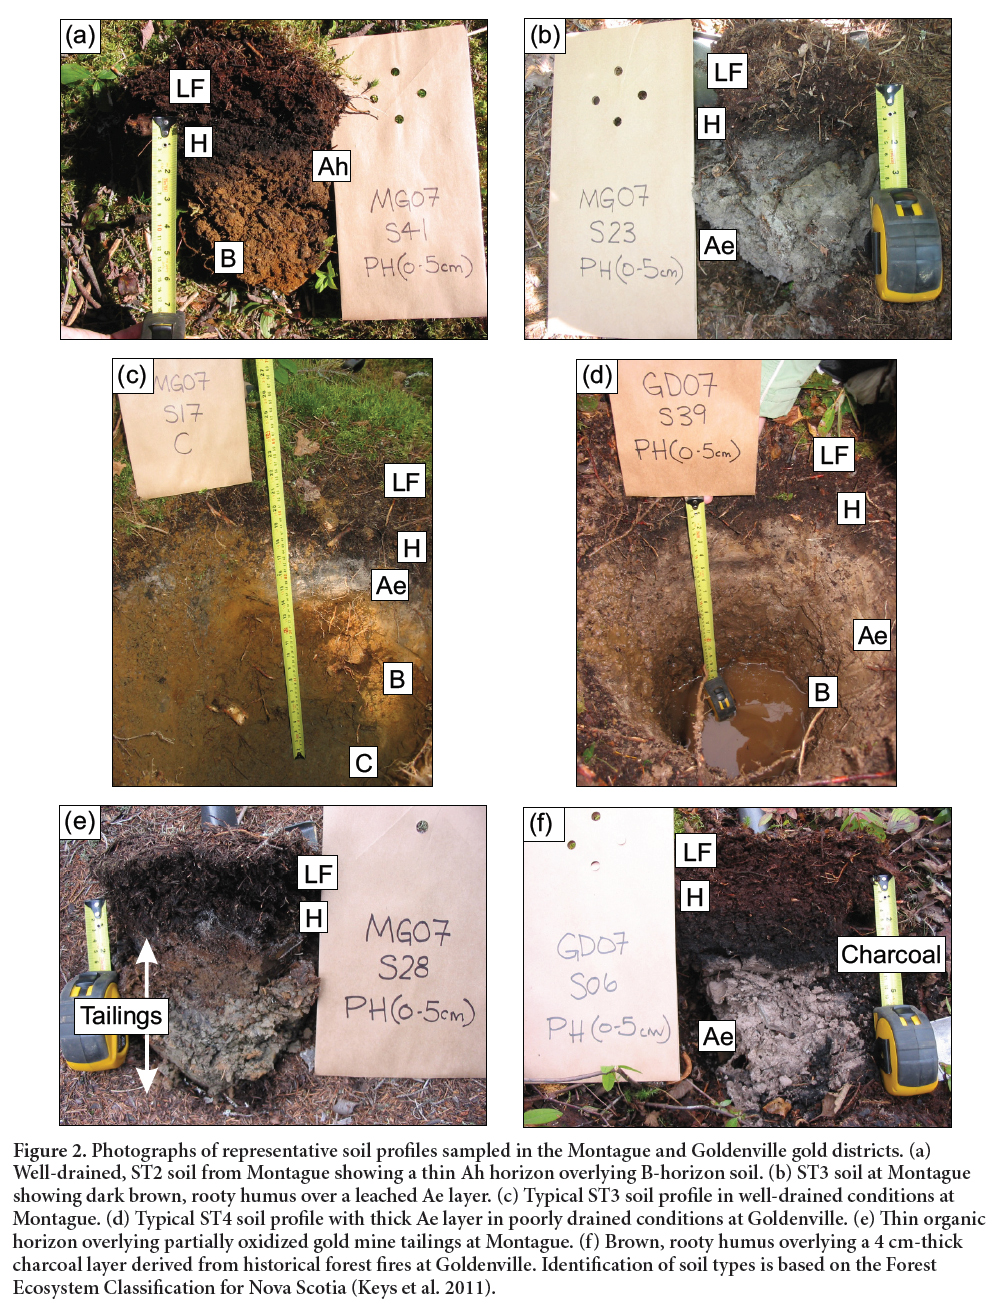
11 The environmental impacts of tailings disposal on stream waters, sediments, vegetation and aquatic and terrestrial organisms in the Montague and Goldenville districts have been studied extensively since the early 1980s (see Parsons et al. 2012 and references therein). Details on the mineralogy and bioaccessibility of As in these tailings can be found in Walker et al. (2009), Meunier et al. (2010), Corriveau et al. (2011a, 2011b), and DeSisto et al. (2011). Environmental Site Assessments were carried out at Montague and Goldenville in 2007 and 2008 to assess human health risks associated with the tailings and local groundwaters (C.J. MacLellan & Associates, Inc. 2009; Maritime Testing, Ltd. 2009), and long-term management options are presently under consideration for both sites.
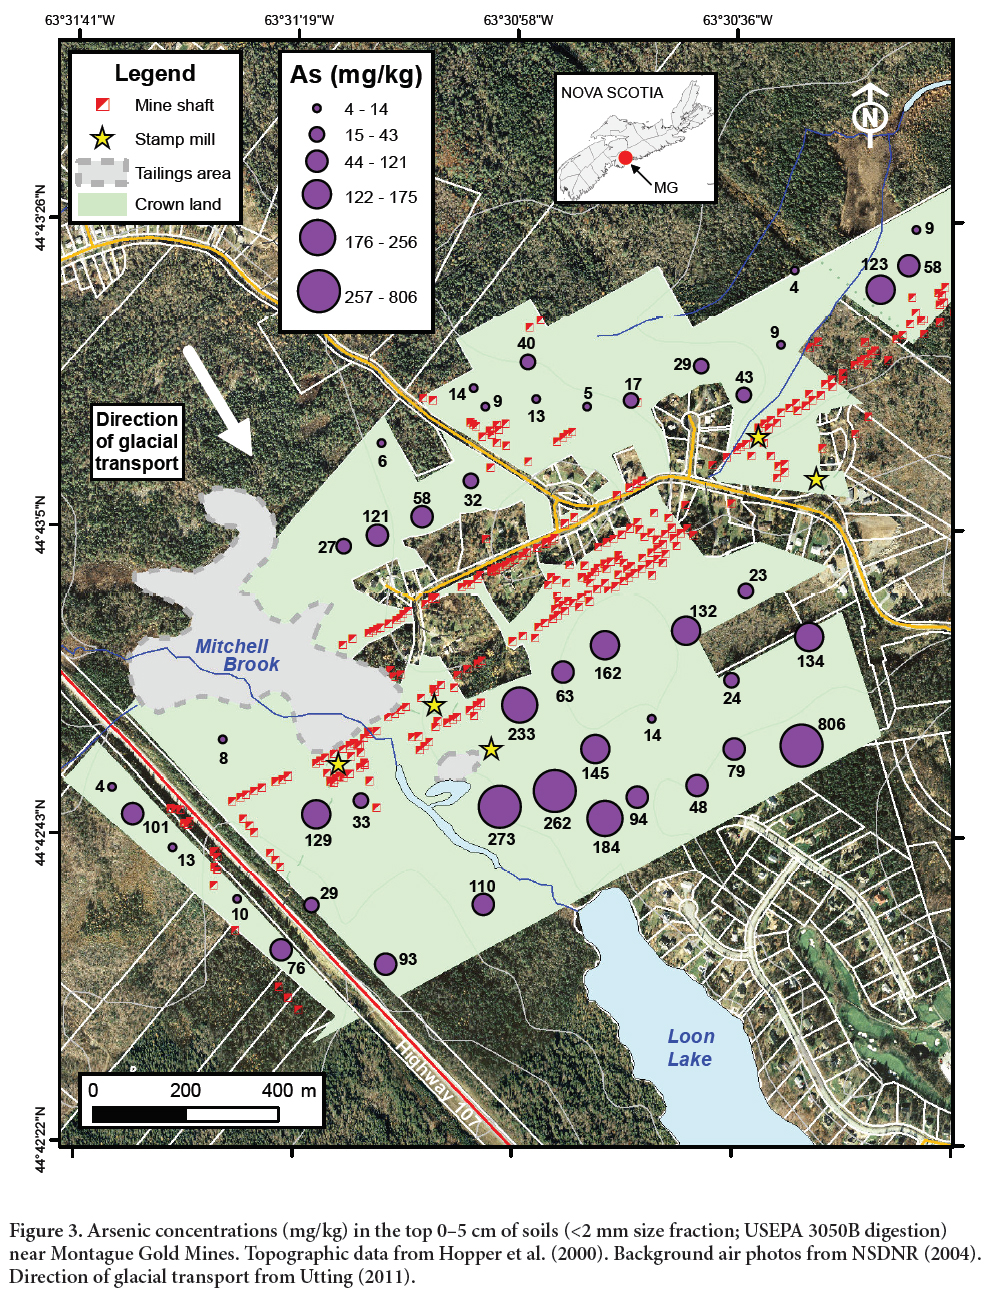
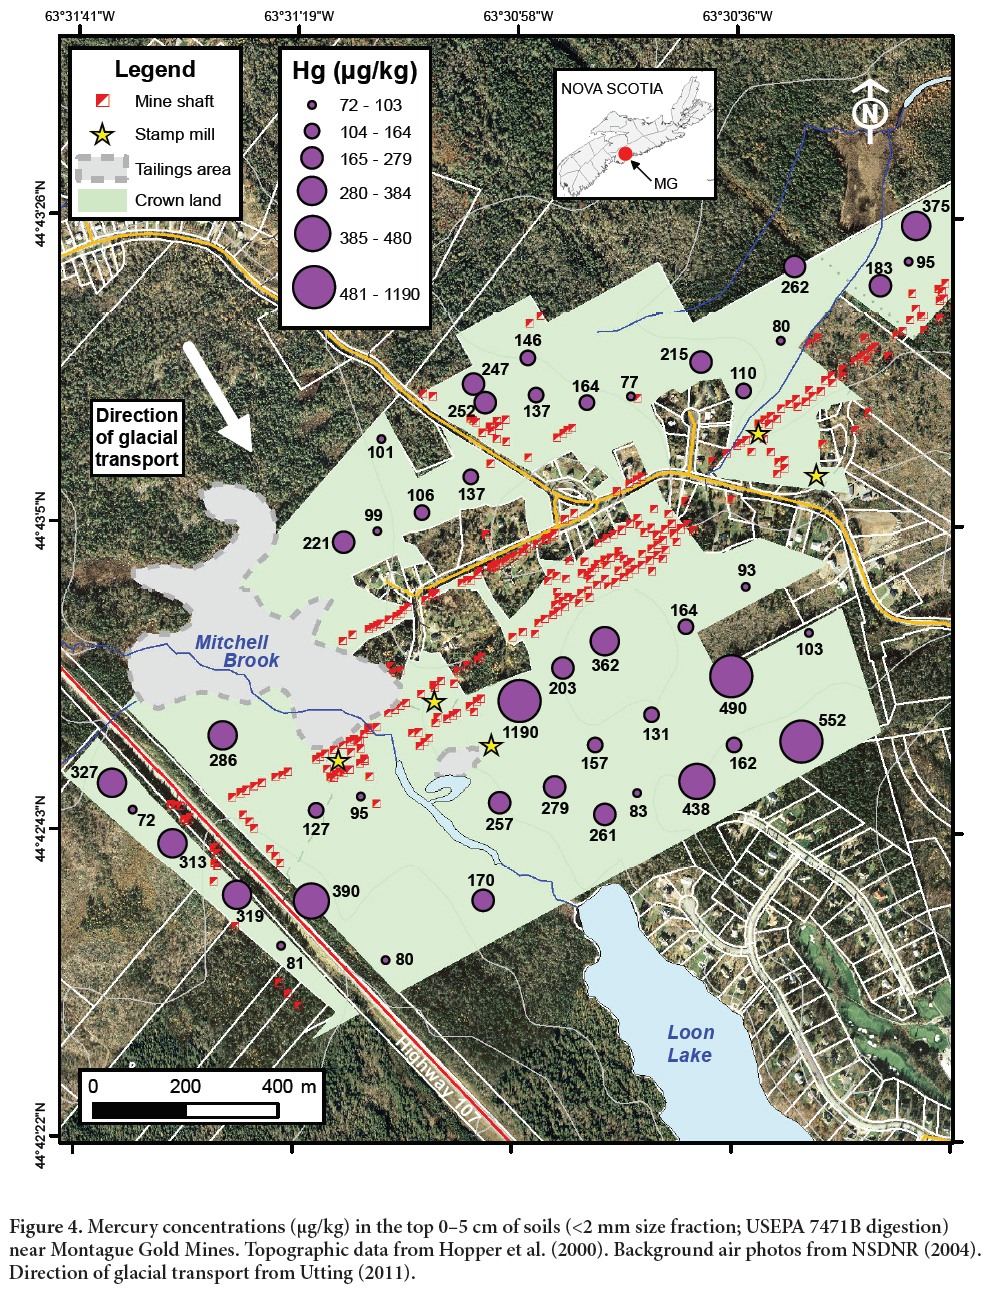
Surficial geology
12 Approximately 90% of the land surface in Nova Scotia is covered with till and other glacial materials, which were deposited sometime during six distinct glacial and interglacial periods over the last 200 000 years. During this time, both regional and local ice sheets were active resulting in a complex series of superimposed glacial landforms and erosional features (Stea et al. 2011). Most soils in the Montague and Goldenville gold districts have developed on the Beaver River Till, a poorly sorted diamicton deposited by ice moving towards the southeast during the Scotian Ice Phase from ca. 20–17 ka (Stea and Fowler 1979; Utting 2011). This till is characterized by a loose sandy matrix with locally derived metasedimentary and granitic clasts, thicknesses between 1 and 10 m, and short (< 1 km) dispersal distances (Stea and Finck 2001).
13 Humo-Ferric Podzols are the predominant soil type overlying the stony tills in most of southern mainland Nova Scotia. These typically occur under forest and shrub vegetation and result from the leaching of overlying horizons in humid, cool to cold settings (SCWG 1998). Under natural conditions, these soils have an organic-rich surface layer composed of plant litter (L), fermented material (F) and humus (H), overlying a light-coloured, leached mineral soil horizon (Ae) or, less commonly, a mineral soil enriched in partially decomposed organic matter (Ah). Below this material, Humo-Ferric Podzols are characterized by a brownish-coloured B-horizon mineral soil that is at least 10 cm thick and enriched in humified organic matter, clays, and iron (Fe), manganese (Mn), and aluminum (Al)-oxides and oxyhydroxides. All of these layers are underlain by C-horizon mineral soil, which is partially oxidized immediately below the B-horizon, but gradually changes colour from reddish-brown to olive grey-brown to grey with increasing depth (SCWG 1998). In general, soils at the Montague and Goldenville gold districts are relatively shallow, and transition into unweathered till within 1.5–2.0 m of the ground surface. In the Montague study area, the shallow, stony soils were mapped as part of the Halifax series by MacDougall et al. (1963) and belong to the ST2 and ST3 soil types in the Forest Ecosystem Classification for Nova Scotia (Keys et al. 2011). At Goldenville, soils of the Halifax series are present in well-drained areas, but where drainage is poor, soils belong to the Danesville and Aspotogan series (Hilchey et al. 1964) and tend to have thicker Ae horizons with prominent redoximorphic features typical of the ST4 soil type (Keys et al. 2011).
14 The regional geochemistry of till and soil overlying bedrock of the Meguma Supergroup has been well studied during past mineral exploration programs (e.g., Carrick Gold Resources 1990; Stea and Finck 2001; Smith et al. 2005 and references therein). These surveys have shown enrichment of Au and As, and to a lesser extent copper (Cu), lead (Pb), zinc (Zn), tungsten (W), bismuth (Bi), tellurium (Te), and iron in surficial materials down-ice from areas of gold mineralization as a result of glacial dispersion (Goodwin et al. 2004). The results of these studies are useful for assessing the pre-mining background concentrations of various elements in tills within the Nova Scotian gold districts. However, they cannot be used to estimate baseline metal(loid) concentrations in the top 0–5 cm of surface soil that is of most interest for human health risk assessment (Health Canada 2010; Rencz et al. 2011).
METHODS
Sampling design and field methods
15 In 2007, we collected samples of the top 0–5 cm of soil (the Public Health (PH) layer) from 46 sites near Montague, and 39 sites near Goldenville. At each gold district, most sampling was restricted to provincially owned (Crown) land and sites were selected both up-ice and down-ice of the main anticlinal fold hinge to study the effects of glacial dispersion. Sample sites were located in relatively well-drained areas that were free from any obvious sources of contamination (e.g., garbage, metal scraps, waste rock, etc.). Photographs, coordinates, and detailed descriptions of each sample location are provided in Parsons and Little (in press).
16 Samples of the Public Health layer were collected using field protocols similar to the recent North American Soil Geochemical Landscapes Project (Friske et al. 2013). At each location, plant litter and partially fermented material were first removed from the soil surface, and then a shovel was used to expose a cross-section of the soil to a depth of at least 10 cm to check for the presence of distinct soil horizons. For the purposes of sampling, the upper boundary of the first layer that supports root growth (the top of the H-horizon, if present) defined the top of the sampling interval (i.e., 0 cm). All equipment in contact with the sample was either polyethylene or steel, and sampling implements were thoroughly cleaned between each location. Approximately 1 kg of soil was collected at each site and pebbles, roots, and any living plant matter were removed before the sample was placed in pre-labelled Kraft paper bags.
17 Samples of individual soil horizons (H, Ae, B, and C) were also collected from 10 sites in Montague and 6 sites in Goldenville to evaluate the vertical distribution of elements in the soil profile. Sites were evenly distributed both up-ice and down-ice of the main anticlinal fold hinge in each district and situated in areas that displayed well-developed soil horizons. Sampling began by clearing plant litter and partially fermented material from the soil surface, then digging a pit that was at least 60 cm wide and 60 cm deep to provide access to the top of the C-horizon. One-kilogram samples of each horizon were collected in sequence from the bottom of the pit to the top to minimize cross-contamination during sampling, cleaned of roots and pebbles, then placed in pre-labelled Kraft paper bags. Observations on the thickness of each horizon, the colour and texture of the soil, and other site characteristics are provided in Parsons and Little (in press).
Laboratory processing and analytical methods
18 All soil samples were air dried in their Kraft paper bags at room temperature in a fume hood to minimize the loss of volatile elements such as Hg. When dry, any remaining pebbles or roots were removed by hand and the soil was then sieved using stainless steel screens to three separate grain-size fractions: <2 mm, <150 μm, and <63 μm. The <2 mm fraction was chosen for comparison with environmental and human health risk assessment guidelines (Health Canada 2010; CCME 2015), the <150 μm material for use in studies of As bioaccessibility (Meunier et al. 2010, 2011), and the <63 μm fraction for comparison with existing exploration geochemistry data sets (e.g., Carrick Gold Resources 1990; Rencz et al. 2006).
19 Analyses of major and trace elements were performed at Acme Analytical Laboratories in North Vancouver, BC. Samples were digested using modified aqua regia (0.50 g of sample digested in a solution containing 2.0 mL HCl, 2.0 mL HNO3 and 2.0 mL H2O at 95°C for one hour) and analyzed for 37 elements following the Acme 1F-MS Ultratrace Inductively Coupled Plasma – Mass Spectrometry (ICP-MS) protocol. For comparison with environmental site assessment studies throughout Nova Scotia, a separate split of each sample was sent to ALS Laboratory Group in Dartmouth, NS, for total Hg analysis using cold-vapour atomic absorption spectrometry (CVAAS), and for As analysis via ICP-MS following digestion using United States Environmental Protection Agency (USEPA) Method 3050B. This method is a partial digestion technique that uses HNO3 and H2O2 at 95°C prior to ICP-MS analyses, and is widely used and accepted for environmental soil surveys throughout most of North America (USEPA 1996; Friske et al. 2013). The analytical accuracy and precision of all major and trace element analyses were monitored using two CANMET certified reference materials (STSD-1 and STSD-3; Lynch 1990, 1999), two EnviroMAT soil standards (SS-1 and SS-2 from SCP Science, Quebec), and blind duplicate samples. In general, the accuracy and precision were within ± 5 to 10% of the expected values for most elements, except for the Method 3050B analyses, which produced As values that were on average 17% higher than the certified partial digestion values.
20 The total carbon content of all soils was measured in 0.50 g sub-samples at the Geological Survey of Canada (Atlantic) using a LECO WR-112 carbon analyser. Organic carbon concentrations were analysed following removal of the inorganic carbon using 1 M HCl. Inorganic carbon concentrations were calculated by difference. Precision and accuracy were approximately ± 0.05 wt.% based on replicate analyses of calibration standards. The full analytical dataset for all samples and certified reference materials analyzed during this study is provided in Parsons and Little (in press).
Statistical analysis
21 The procedures used for exploratory data analysis and for estimating soil geochemical baselines in this study were similar to the recommendations provided by Reimann et al. (2005) and Rencz et al. (2011). The concentrations of As and Hg in each soil horizon were first plotted on maps in ArcGIS and represented by dots sized proportional to concentration to examine the spatial distribution of each element, and to check for patterns related to known sources of metal(loid)s (e.g., stamp mills, waste rock, tailings) and geological processes (e.g., glacial transport) in each district. Data for each element were then plotted on histograms, box-and-whisker diagrams, and probability plots to check for the presence of multiple baseline populations in each data set, and to identify any outliers. In approximately 5% of all samples analysed, the concentrations of Hg were less than the CVAAS limit of detection (10 μg/kg); in each case, one-half of the limit of detection (5 μg/kg) was substituted for the non-detect value prior to statistical analysis. Finally, once outliers were removed, summary statistics were calculated for each data set using the ‘rgr’ software package for the R Open Source statistical computing and graphics environment (Garrett 2013b; CRAN 2015).
RESULTS AND DISCUSSION
Field observations
22 Most of the soil sampling sites in both the Montague and Goldenville gold districts were located in well-drained, hummocky areas and covered by a mixture of deciduous leaf litter, spruce and pine needles, and/or moss. In general, soils were very rocky, with locally derived, angular clasts consisting mainly of metasandstone and slate. Soil horizons in both districts were typical of Humo-Ferric Podzols, with thicker Ae horizons in more poorly-drained areas (Figs. 2a–d). During the sampling at Montague, we discovered a previously undocumented tailings deposit that extends westward from a small stamp mill foundation south of the main ore zone into a wetland along Mitchell Brook (Fig. 3). Tailings at this site (MG07-S28) were buried beneath approximately 5 cm of spruce needles and humus (Fig. 2e) and contained high concentrations of both As (1860 mg/kg) and Hg (70 mg/kg) (<2 mm, aqua regia digestion). Analytical results for this sample are not included in this paper. Many sites in both districts also contained thin layers of charcoal within the top 0–10 cm of soil as a result of past forest fires (Fig. 2f).
 Display large image of Figure 2
Spatial distribution of As and Hg in near-surface (0–5 cm) soils
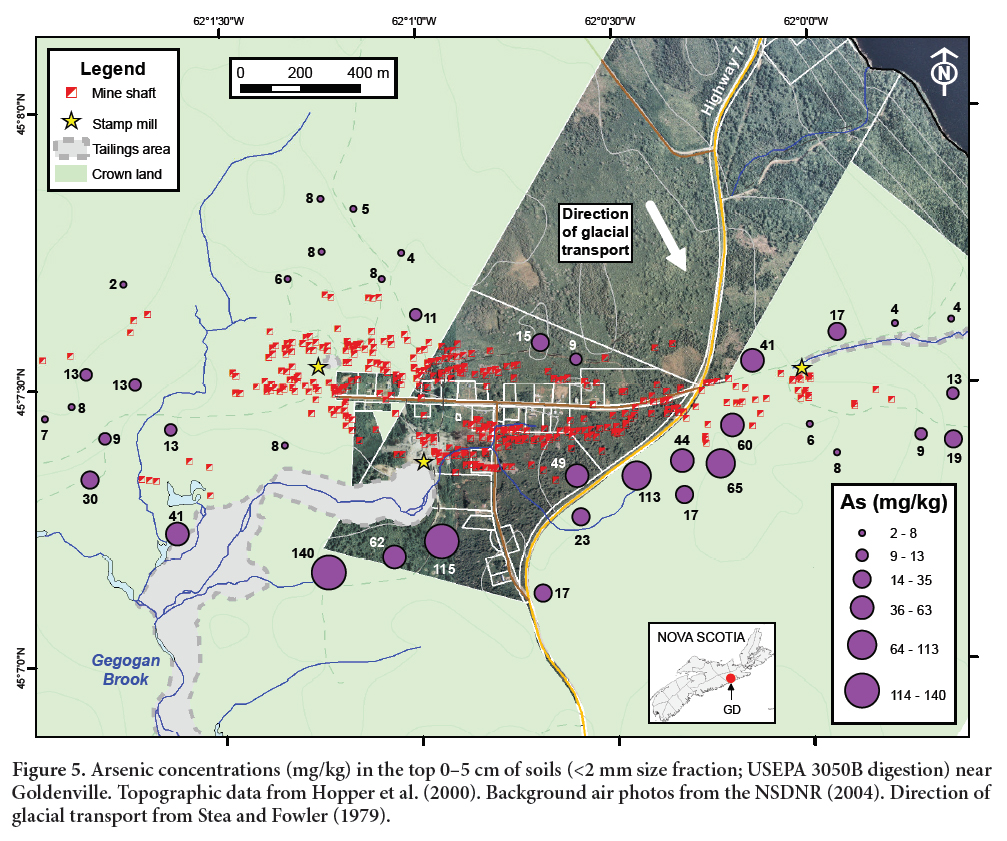
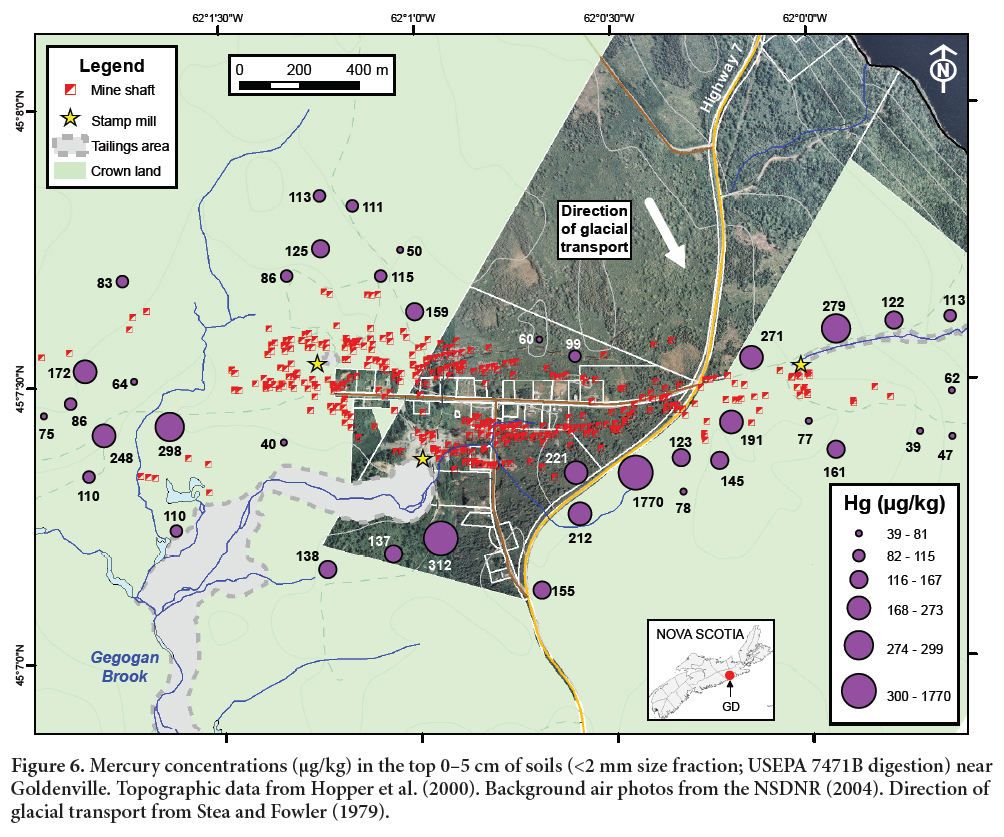
23 The distributions of As and Hg in the top 0–5 cm of soils (<2 mm size fraction; USEPA 3050B digestion) at Montague and Goldenville are represented by dots sized proportional to concentration in Figs. 3–6. On these maps, element concentrations have been separated into six classes using the following percentile breakdown: minimum–25th, 25th–50th, 50th–75th, 75th–90th, 90th–95th, and 95th–maximum. The full geochemical dataset for the Public Health layer at each site shows the following ranges in As and Hg concentrations: Montague: As, 4 to 806 mg/kg; Hg, 72 to 1190 μg/kg; Goldenville: As, 2 to 140 mg/kg; Hg, 39 to 1770 μg/kg (Parsons and Little in press). However, close inspection of the data reveals several anomalous values that may reflect contamination from former milling activities or other sources. At Montague, the Hg value for Site MG07-S30 is anomalously high (1190 μg/kg; Fig. 4), although the As value (233 mg/kg; Fig. 3) falls within the range of other samples. This site is located 100 m from the foundation of a former stamp mill, thus may have been impacted by airborne emissions from past amalgamation activities. Site MG07-S38 has the highest As concentration (806 mg/kg; Fig. 3) of all soil samples collected at Montague, and the Hg concentration is also somewhat elevated (552 μg/kg; Fig. 4). Comparison with the 37-element aqua regia dataset shows that this sample contains very high concentrations of Co (428 mg/kg), Fe (10.6 wt.%), Mn (>10 000 mg/kg), Pb (278 mg/kg), and other elements, suggesting contamination by some sort of polymetallic material. At Goldenville, the only apparent anomaly is the Hg concentration in the <2 mm Public Health layer sample from Site GD07-S17 (1770 μg/kg; Fig. 6). This high Hg value may be an analytical artifact, as it is not repeated in the <150 μm grain size fraction, nor does it appear in the aqua regia dataset (Parsons and Little in press). All of these anomalous samples are omitted from subsequent plots and calculations of geochemical baselines in this paper.
 Display large image of Figure 3
 Display large image of Figure 4
 Display large image of Figure 5
 Display large image of Figure 6
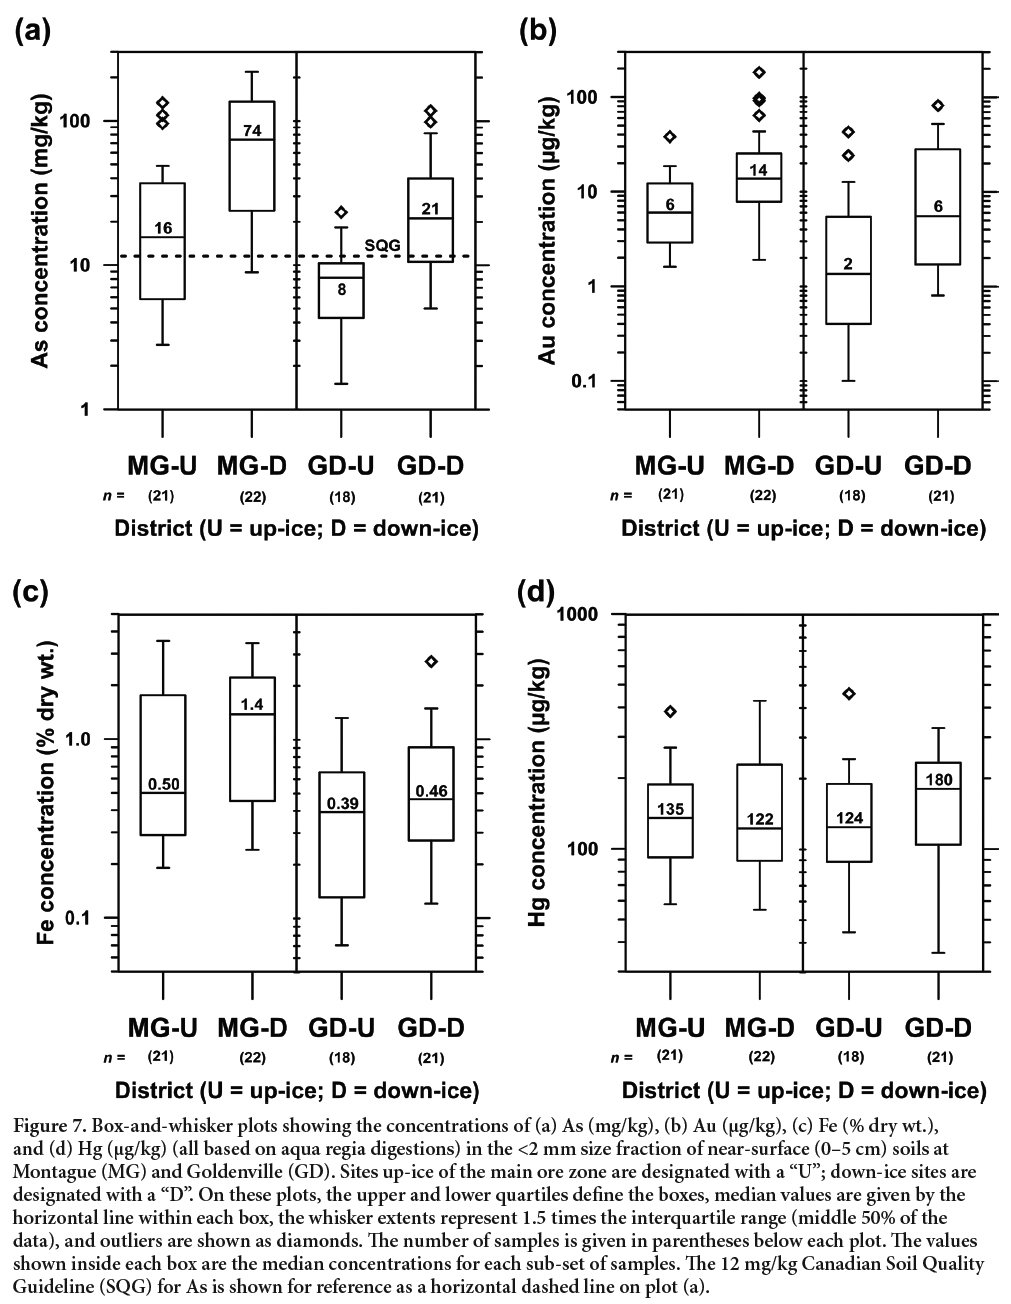
24 One of the most important controls on the chemistry of soils at both Montague and Goldenville is past glacial erosion and transport of mineralized bedrock, which has resulted in distinctly higher concentrations of As, Au, Fe and other elements down-ice of the ore zone in each gold district (Figs. 7a–c). Down-ice enrichment in the Public Health layer is greatest for As at Montague (median As concentration 4.7 times higher down-ice vs. up-ice) and for Au at Goldenville (median Au concentration 3.2 times higher down-ice vs. up-ice). Dispersion of As, Au, and other elements down-ice from gold deposits has been well studied in Nova Scotia (e.g., Carrick Gold Resources 1990; Dunn et al. 1991; Goodwin et al. 2004; Smith et al. 2005) and in other mineralized areas across Canada and worldwide (e.g., Presant and Tupper 1966; Boyle and Jonasson 1973; DiLabio 1989; Kerr 2001; Broster et al. 2009; Reimann et al. 2009). The effects of glacial dispersal are generally most pronounced in C-horizon soils that develop directly on top of till; however, our data show that this process also influences the composition of shallower soils that are of most interest for environmental risk assessment. The spatial distribution of Hg in near-surface soils at Montague (Fig. 4) and Goldenville (Fig. 6) also shows evidence of higher concentrations down-ice of the main ore zone in each district; however, the median concentration of Hg in the Public Health layer up-ice at Montague is actually slightly higher than in the down-ice samples (Fig. 7d). These results are mostly consistent with previous surveys of Hg in C-horizon soils at Nova Scotian gold deposits, which suggest that Hg is naturally enriched in the ore zone and in tills up to 500 m down-ice (Smith et al. 2005).
 Display large image of Figure 7
Vertical distribution of As and Hg in soil profiles
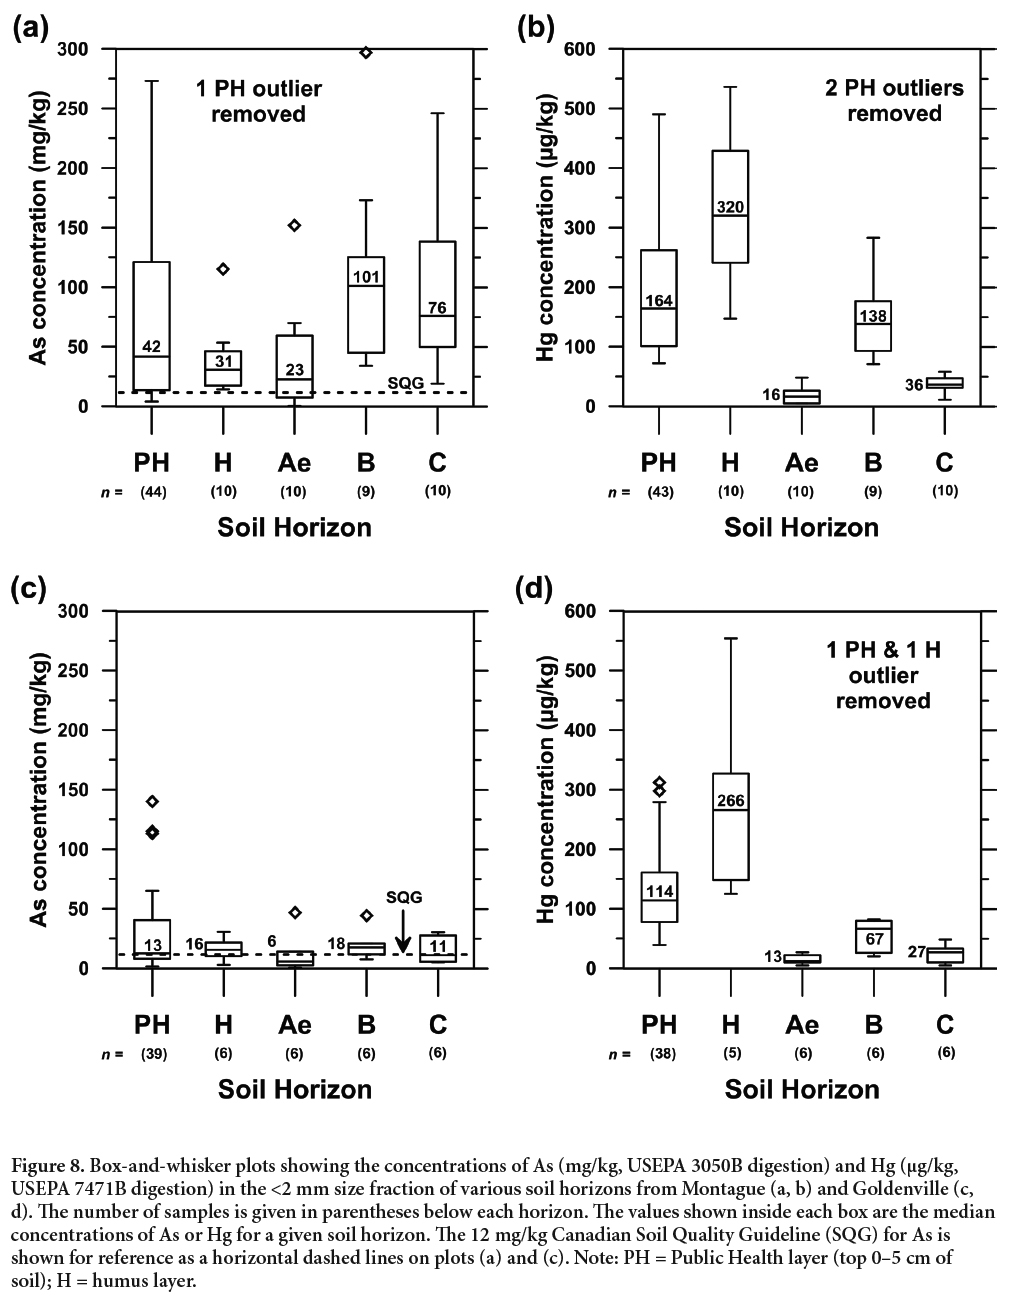
25 Geochemical analyses of individual soil horizons (H, Ae, B, and C) at Montague and Goldenville show that As concentrations are generally highest in B-horizon soils (Figs. 8a, c), whereas Hg levels are greatest in the humus layer (Figs. 8b, d). The enrichment of As in deeper horizons reflects the contribution of As from the underlying first-derivative till (Shilts 1976) on which the soils developed, as well as the adsorption and co-precipitation of As on Fe-, Mn-, and Al-(oxy)hydroxides that accumulate in the B-horizon during pedogenesis (Boyle and Jonasson 1973; SCWG 1998). The strong enrichment of Hg in humus results from the atmospheric deposition of Hg from local and distal sources, as well as gaseous Hg flux from underlying soils, and the subsequent bonding of Hg to thiol groups in soil organic matter (Grigal 2003; Skyllberg et al. 2006). As expected, the concentrations of both As and Hg are lowest in the Ae horizon at most sample sites, reflecting the leaching of soluble constituents during soil formation and their transport to deeper horizons. These results are consistent with the vertical distributions of As and Hg measured by Jaggard (2007) in forest soil profiles at four locations around Montague Gold Mines.
 Display large image of Figure 8
26 The variability of As and Hg in different soil horizons complicates the interpretation of geochemical data for samples collected from fixed depth intervals (e.g., the top 0–5 cm), as the thickness of individual horizons can vary significantly from site to site (Rencz et al. 2011). As shown in Figs. 8a–d, As concentrations in the PH layer are generally greater than those in the H and Ae horizons, while Hg concentrations are consistently higher in humus as compared to the PH layer and Ae horizon. These observations are comparable to the results of Broster et al. (2009), who documented significantly higher concentrations of Mn, Cd, Ag, Pb, Hg, and Zn in humus as compared to till overlying Ag–As–Cu–Mo–Pb–Zn mineralized occurrences in northeastern New Brunswick. Where data for individual horizons are available, variations in the As and Hg concentrations of the PH layer at different sites can sometimes be explained by examining the relative amounts of the H, Ae, and B horizon in the top 0–5 cm at each site. However, differences in the composition of the PH layer between sites may also reflect spatial variations in the geogenic or anthropogenic inputs of metal(loid)s in a given study area. In the absence of data on the thickness and composition of soil horizons, spatial variations in the chemistry of the PH layer such as those shown in Figs. 3–6 must be interpreted with care.
27 Comparison of the As and Hg levels in similar soil horizons at Montague (Figs. 8a, b) and Goldenville (Figs. 8c, d) shows that the median concentrations of both elements are consistently higher in all horizons at Montague. The greater As and Hg concentrations in the C-horizon at Montague suggest that these elements are also enriched in the underlying till, which may reflect a higher degree of glacial erosion of mineralized bedrock in this district. The generally higher As and Hg levels in near-surface (PH, H, Ae) soils at Montague are most likely a result of differences in the chemistry of the underlying parent materials, as well as greater inputs from mining-related sources (e.g., stamp mills, windblown tailings). The relatively high As concentrations throughout the soil profile at Montague have important implications for risk assessments in this district. As shown in Fig. 8a, the median As values in all horizons are consistently higher than the Canadian Soil Quality Guideline for As (12 mg/kg; CCME 2015), and also exceed the Environmental Quality Standard for As in soils at contaminated sites in Nova Scotia (31 mg/kg; NSE 2014) in the PH layer, B- and C-horizons.
Textural and compositional controls on As and Hg concentrations in soils
28 Variations in grain size can have a strong effect on the distribution of elements in soils. Higher trace element concentrations are often found in the finer fractions of soils because of their greater specific surface areas, cation exchange capacities, and surface charges (Friske et al. 2013). However, elements hosted primarily in resistant detrital minerals (e.g., Si in quartz; K, Ba, Sr in feldspars) are typically enriched in coarser grain-size fractions, as these minerals do not break down easily during weathering. The partitioning of elements between various grain sizes depends on the lithology of the soil parent material and the geochemical and mineralogical changes that occur during soil formation (Acosta et al. 2011).
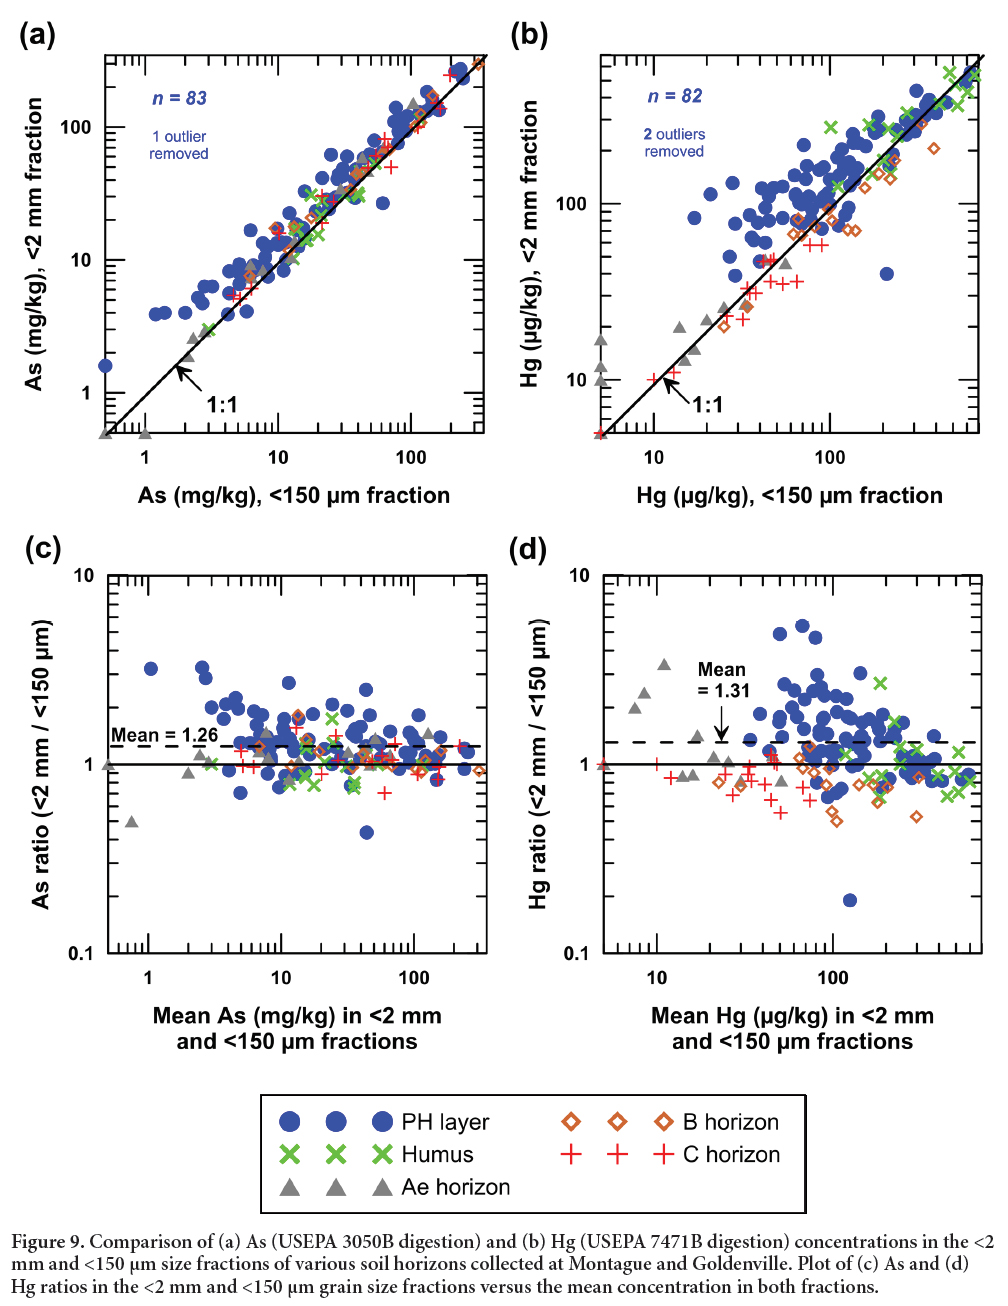
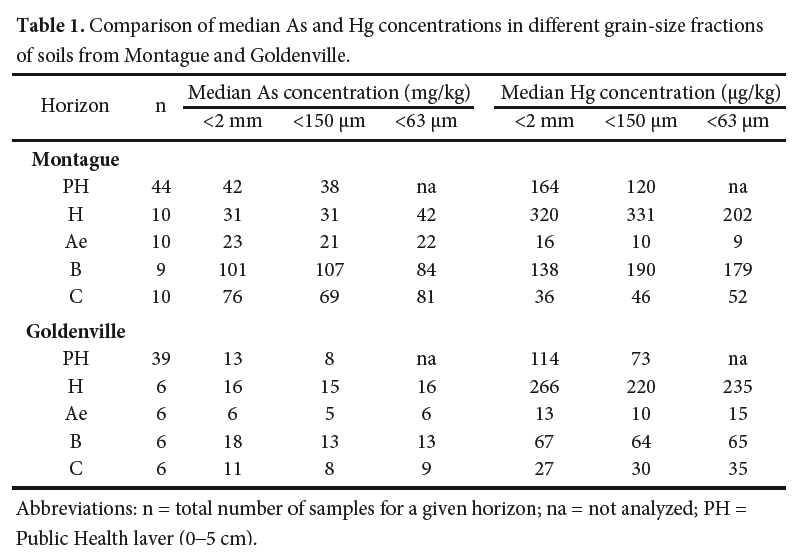
29 In this study, we sieved soil to three separate size fractions (<2 mm, <150 μm, and <63 μm (horizon-based samples only)) to investigate the effects of particle size on As and Hg concentrations. As shown in Figs. 9a and 9b, As and Hg levels are similar in both the <2 mm and <150 μm fractions of various soil horizons at Montague and Goldenville, but are distinctly higher in the <2 mm fraction at lower concentrations. To test whether or not As and Hg concentrations in the <2 mm and <150 μm fractions are sufficiently similar to be considered equal at the 95% confidence level, we plotted the ratio between the concentrations in the <2 mm and <150 μm fractions in each sample versus the mean of the As (Fig. 9c) and Hg (Fig. 9d) concentrations in each size fraction (Garrett 2015). For As and Hg, the mean ratios between concentrations in the <2 mm and <150 μm fractions are 1.26 and 1.31, respectively. The differences between the mean ratios and unity (0.26, 0.31) are greater than the 95% confidence level of the mean of both As (0.07) and Hg (0.13) ratios. As discussed by Garrett (2015), this indicates that As and Hg concentrations in the <2 mm and <150 μm fractions are statistically different at the 95% confidence level. Furthermore, comparison of the median As and Hg concentrations in all three grain-size fractions shows that there is an inconsistent relationship between grain size and As and Hg levels in these soils (Table 1). In some cases, the concentrations of As or Hg are very similar across all three size fractions, while in others, there are distinct differences between the coarse and fine fractions of the soil. These results are consistent with the observations of Bright et al. (2006), who conducted a literature review of the relationship between soil particle size and contaminant partitioning and concluded that many elements exhibit a non-uniform distribution across particle sizes. Our data suggest that As and Hg concentrations from different grain size fractions are generally not interchangeable, and that human health risk assessments should consider those size fractions that are most relevant to human exposure (cf. Bright et al. 2006; Ljung et al. 2006; Meunier et al. 2010).
 Display large image of Figure 9
 Display large image of Table 1Abbreviations: n = total number of samples for a given horizon; na = not analyzed; PH = Public Health layer (0–5 cm).
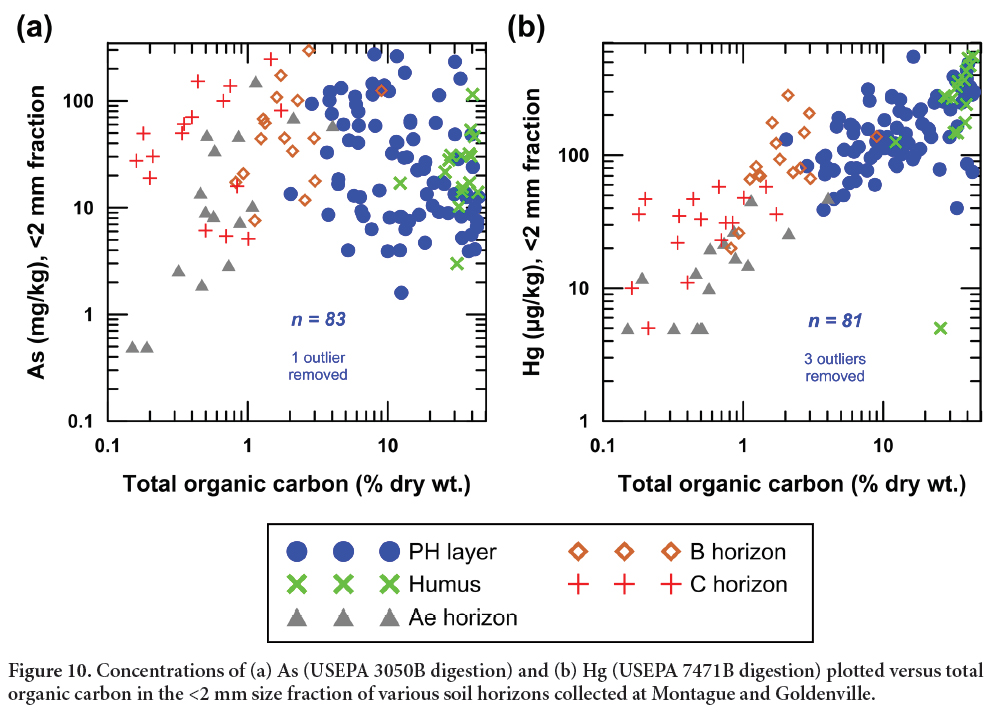
 30 The partitioning and bioaccessibility of metal(loid)s in soils are also influenced by variations in organic carbon content (Alloway 2013). Previous studies of tailings and soil from Montague and Goldenville suggest that the addition of organic matter to soils may result in greater As bioaccessibility (Meunier et al. 2011), which could increase the risk associated with As exposure if tailings are transported into residential areas via windblown dust (Corriveau et al. 2011a). The total organic carbon concentrations in the <2 mm fraction of soils collected from Montague and Goldenville range from 0.15 to 45 % dry wt., and are usually highest in the humus layer (12 to 44 % dry wt.; mean = 34 % dry wt.) and lowest in the C-horizon (0.16 to 1.7 % dry wt.; mean = 0.62 % dry wt.). The concentration of As in various soil horizons shows no obvious correlation with total organic carbon content, unlike Hg, which demonstrates a weak positive correlation with soil organic carbon (Figs. 10a, b). As discussed above, the sequestration of Hg by organic carbon in the soils at Montague and Goldenville is an important factor controlling the spatial distribution of Hg in the Public Health layer illustrated in Figs. 4 and 6.
 Display large image of Figure 10
Baseline ranges and threshold values of As and Hg in near-surface (0–5 cm) soils
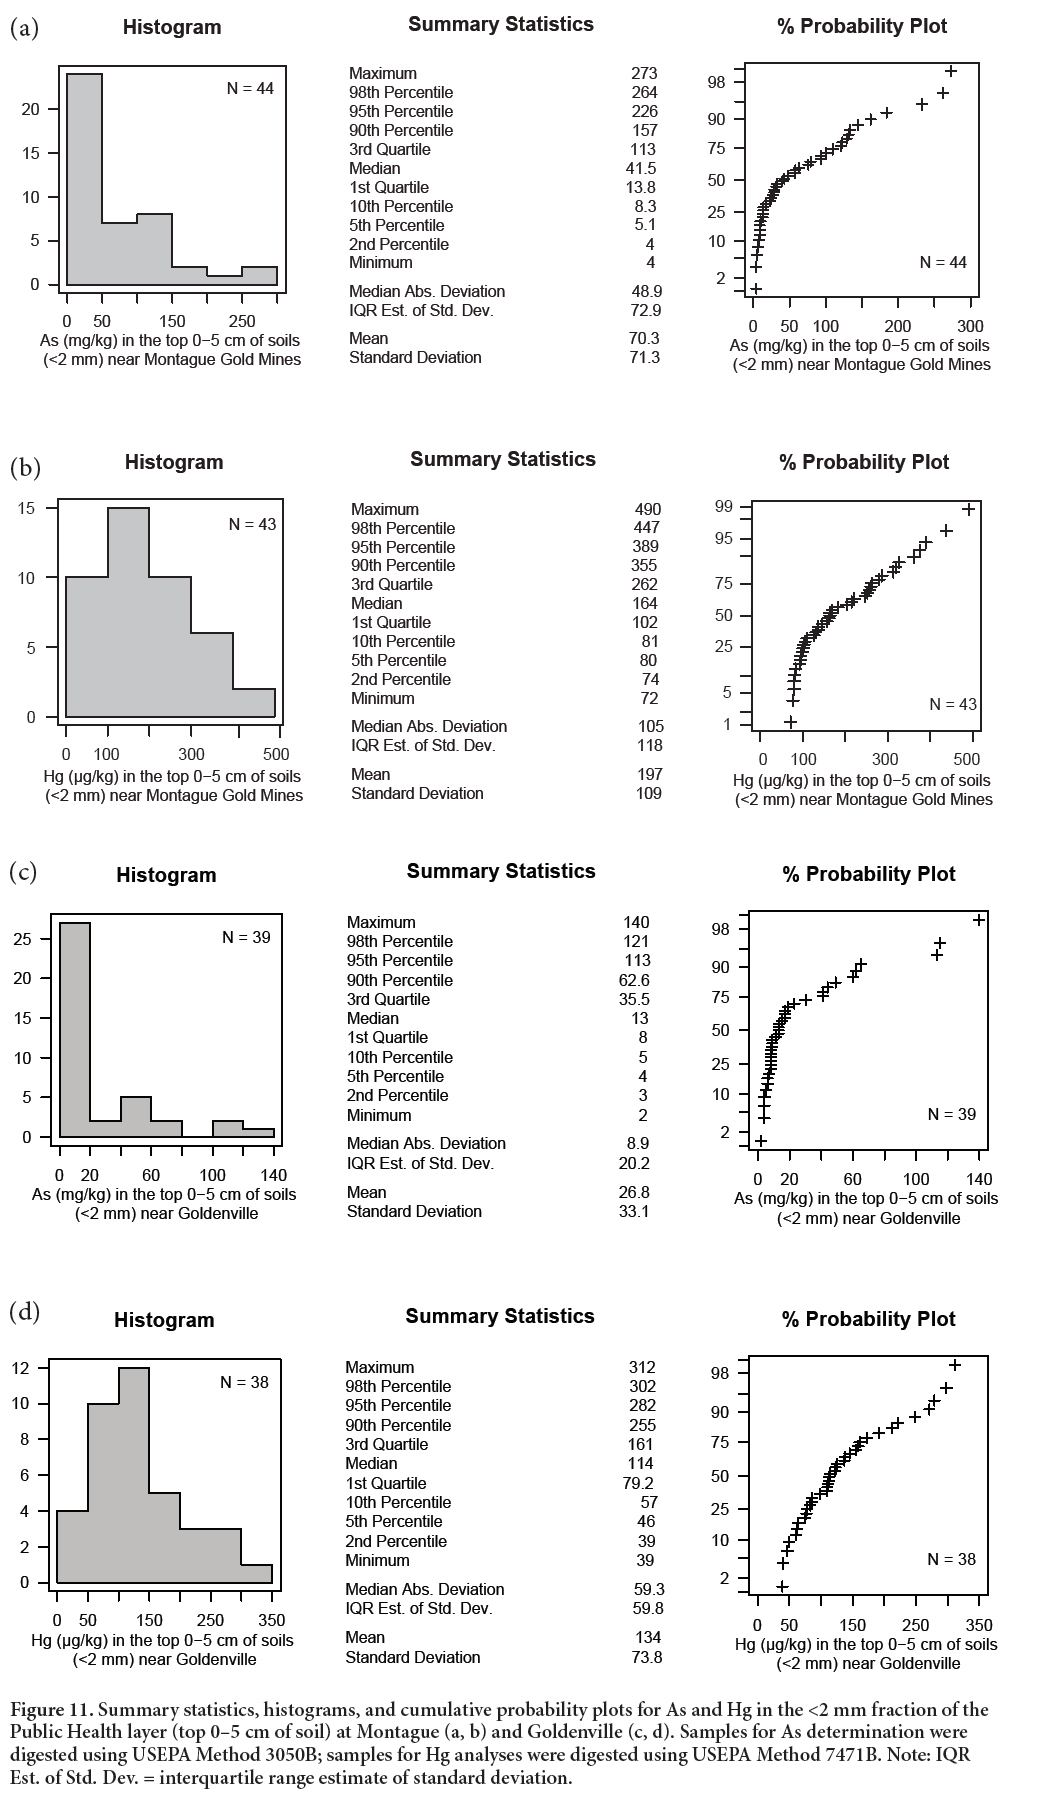
31 For the purpose of estimating geochemical background values at Montague and Goldenville, the data for individual soil horizons within each district were treated as a single population, despite the obvious differences in the up-ice and down-ice concentration ranges for As and Hg (Fig. 7). This was a practical choice, as a single range of baseline values for both As and Hg in the Public Health layer was required to inform risk assessments in each district. Following the removal of outliers from each dataset (discussed above), summary statistics, histograms, and percent probability plots were generated for both Montague (Figs. 11a, b) and Goldenville (Figs. 11c, d) using the ‘rgr’ software package (Garrett 2013b).
 Display large image of Figure 11
32 The histograms in Figs. 11a–d demonstrate that even after the removal of outliers, the concentrations of As and Hg in the Public Health layer at both sites are not normally distributed and are positively skewed, as is typical of minor and trace elements in most geochemistry datasets (Reimann and Filzmoser 2000). These data distributions suggest that the average baseline concentrations are best estimated by the median of each dataset, and that the median plus or minus two median absolute deviations (median ± 2MAD) should be used to estimate the range of baseline concentrations, as both the median and MAD are more resistant to extreme values relative to the mean and standard deviation (Reimann et al. 2005). Based on these criteria, the average baseline concentrations (<2 mm size fraction; USEPA 3050B digestion) in the Public Health layer in both districts are: Montague: As, 42 mg/kg; Hg, 164 μg/kg; Goldenville: As, 13 mg/kg; Hg, 114 μg/kg. The upper limits of baseline variation (or threshold values) for each district as determined by median + 2MAD are: Montague: As, 139 mg/kg; Hg, 374 μg/kg; Goldenville: As, 31 mg/kg; Hg, 233 μg/kg. Public Health layer soils with As and/or Hg concentrations above these thresholds may be contaminated and warrant further investigation in risk assessments or remediation activities in the Montague and Goldenville districts.
33 Comparison of these As and Hg threshold values with generic (Tier 1) Environmental Quality Standards for the assessment of contaminated sites in Nova Scotia highlights the importance of establishing local baseline concentrations of naturally occurring substances during site investigations (CCME 1996, 2006; Health Canada 2010; NSE 2014). The Hg concentrations in all soil samples collected during this study are less than the Environmental Quality Standard for Hg of 6600 μg/kg, with the exception of one Public Health layer sample overlying a previously undocumented tailings deposit at Montague (Site MG07-S28; 70 mg/kg Hg). At Goldenville, the calculated threshold concentration for As in the Public Health layer matches the Nova Scotia Environmental Quality Standard for As of 31 mg/kg. However, at Montague, 42% (19 of 45) of the Public Health layer samples collected during this study have As concentrations that exceed the 31 mg/kg Environmental Quality Standard, but fall below calculated upper limit of baseline variation (139 mg/kg) for As in this district. Knowledge of the local baseline conditions at Montague and Goldenville has been used by the Province of Nova Scotia to guide risk-assessment efforts (M. Haggart, Nova Scotia Environment, personal communication, 2008) and could eventually be used to help establish appropriate targets for site remediation.
Comparison with regional geochemistry data
34 In Table 2, summary statistics and threshold values for As and Hg concentrations in the Public Health layer and C-horizon soils at Montague and Goldenville are compared to results from soil sampling surveys conducted throughout Nova Scotia in 2007, 2008, and 2010 (Friske et al. 2014a, b). These provincial-wide surveys documented natural geochemical variability in PH, A-, B-, and C-horizon soils from 133 sites overlying most of the major geological lithozones in Nova Scotia (Goodwin et al. 2009; L. White, Health Canada, personal communication, 2012). All samples were collected using field and analytical protocols established during the North American Soil Geochemical Landscapes Project (Friske et al. 2013) and the geochemical results for As and Hg are directly comparable to our own data for Montague and Goldenville. Table 2 also includes values for the 98th percentile of each dataset, as this threshold has been used by some environmental legislators as a measure of the upper limit of baseline variation (Reimann et al. 2005; Sanei et al. 2007; Rencz et al. 2011).
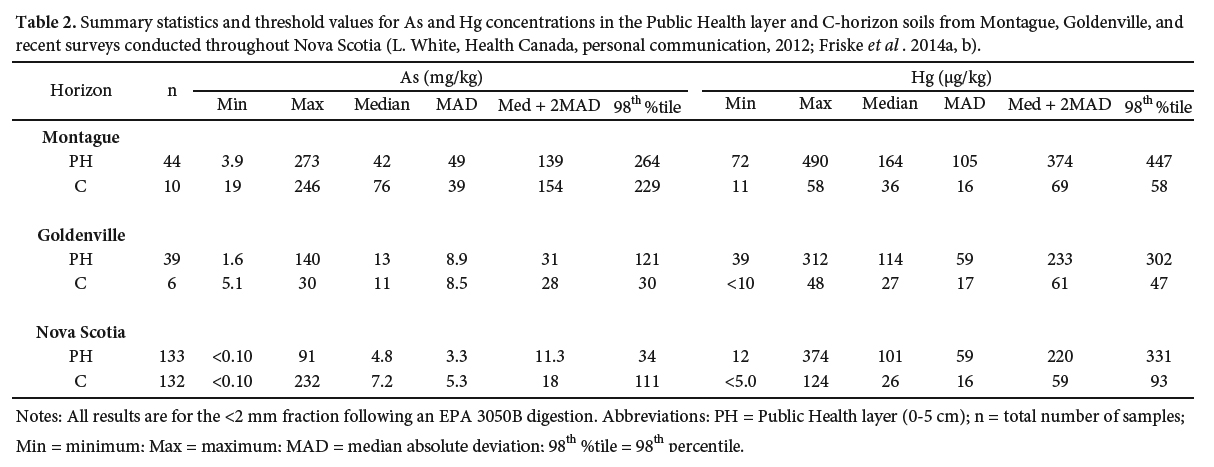 Display large image of Table 2Notes: All results are for the <2 mm fraction following an EPA 3050B digestion. Abbreviations: PH = Public Health layer (0-5 cm); n = total number of samples; Min = minimum; Max = maximum; MAD = median absolute deviation; 98th %tile = 98th percentile.
 35 Comparison of the medians and upper thresholds (median + 2MAD) of As and Hg concentrations in the PH layer and C-horizon soils shows that these statistical parameters are consistently highest at Montague and lowest in the regional data from around Nova Scotia. The greatest difference is in the median As concentration in the C-horizon, which is 10.5 times higher at Montague as compared to the provincial dataset. In contrast, the median and upper threshold (median + 2MAD) of Hg concentrations in the C-horizon at Goldenville are only slightly higher than the provincial values, suggesting that geogenic Hg levels are not anomalously high within the Goldenville district. Summary statistics for the Nova Scotia data show that even in areas away from known gold districts, the naturally occurring levels of As occasionally exceed both the Canadian Soil Quality Guideline for As (12 mg/kg; CCME 2015) as well as the Nova Scotia Environmental Quality Standard for As (31 mg/kg; NSE 2014).
36 Estimates of the upper threshold of As and Hg concentrations calculated using the 98th percentile are generally higher than values calculated using the median + 2MAD approach (Table 2). As noted by Reimann et al. (2005), the use of percentile-based approaches to identify “outliers†for further inspection will result in the same percentage of extreme values for all variables, regardless of the shape of the underlying data distribution. Ultimately, choosing the most suitable threshold value for a given site depends on the degree of protection required by the risk assessment or remediation activity (Health Canada 2010; Rencz et al. 2011).
CONCLUSIONS
37 Chemical analyses of forest soils collected from the Public Health layer (0–5 cm) and various soil horizons (H, Ae, B, and C) at the historical Montague and Goldenville gold districts in Nova Scotia show that the baseline concentrations of As and Hg are highly variable. The main controls on As distribution are glacial dispersal of mineralized bedrock down-ice of the ore zone in each district, and subsequent enrichment of As in the B- and C-horizons by soil-forming processes. Mercury concentrations are most strongly influenced by the distribution of organic matter in the soils and are highest in the humus layer. Analyses of the <2 mm, <150 μm, and <63 μm fractions show an inconsistent relationship between grain size and As and Hg concentrations, indicating that geochemical data from different size fractions are not interchangeable. These results suggest that the effects of glacial transport should be considered when conducting environmental assessments of metal mine sites in glaciated terrain, and that risk assessments should focus on those grain size fractions most relevant for human exposure.
38 The estimated upper limit of baseline variation (median + 2MAD) for As in Public Health layer soils from Montague (139 mg/kg; <2 mm, USEPA 3050B digestion) is 11.6 times higher than the Canadian Soil Quality Guideline for As (CCME 2015), and 4.5 times higher than the Tier 1 Environmental Quality Standard used for assessing contaminated sites in Nova Scotia (NSE 2014). The upper threshold for As in the Public Health layer at Goldenville (31 mg/kg) is 2.6 times higher than the federal guideline, but equal to the provincial As standard for contaminated sites. The Hg concentrations in all soils collected during this investigation are much lower than the Canadian and Nova Scotia soil guideline of 6600 μg/kg. The wide ranges in baseline As and Hg concentrations observed during this study demonstrate that generic soil quality guidelines are impractical for guiding risk assessments and remediation activities at historical and modern gold mining sites in Nova Scotia, and at similar sites worldwide. Our results suggest that it is very important to establish local baseline concentrations of naturally occurring substances during site investigations, especially in mineralized areas. Results from this study have been used to help delineate the extent of tailings deposition at the Montague and Goldenville sites, and to inform preliminary human health risk assessments.
This study was funded through the Environment and Health Program (2006–2009) of the Earth Sciences Sector at Natural Resources Canada, and by the Contaminated Sites Division of the Safe Environments Programme at Health Canada. We thank Terry Goodwin (Nova Scotia Department of Natural Resources) and Louise White and Nellie Roest (Health Canada) for their assistance in designing the soil sampling and analytical protocols used in this study, and for providing unpublished data from the 2010 soil sampling surveys throughout Nova Scotia. Bob Fitzgerald and Bill LeBlanc (Geological Survey of Canada – Atlantic) are acknowledged for their help with sample processing and carbon analyses, respectively. We also thank Bob Garrett (Geological Survey of Canada – Ottawa) for his advice regarding statistical analyses of our data, his guidance in using the ‘rgr’ software package, and for helpful comments on this manuscript. Our paper also benefitted from constructive comments by Toon Pronk and an anonymous reviewer. This is Contribution Number 20150250 of the Earth Sciences Sector, Natural Resources Canada.