Special Series - Enviromental Geoscience
Assessing patterns of dissolved methane in shallow aquifers related to Carboniferous and Triassic sedimentary basins, Nova Scotia, Canada
ABSTRACT
The study examines patterns of groundwater methane in shallow aquifers located in Carboniferous and Triassic sedimentary basins in Nova Scotia to improve our understanding of the factors influencing the observed distribution. A combined total of over 800 dissolved methane samples were collected from water wells during surveys conducted in 1975 and 2013. Statistical analyses of the methane data did not detect a significant difference between groupings of methane concentrations for aquifer type, bedrock group, and distance to wetlands. A significant difference, however, was observed between sedimentary basins and bedrock formations, which was largely attributed to localized higher methane concentrations found in the Stellarton Formation/basin compared to other on-shore sedimentary basins of the province. A significant difference was also found between groupings of methane data based on the distance to major stream systems, which was used to indicate topographic position (i.e., valley vs. upslope). The low sample density and percentage of detectable methane concentrations, and the multiple sources of dissolved methane in shallow groundwater in sedimentary basins made it difficult to detect and interpret statistical and spatial trends. Geochemical classification indicates that elevated dissolved methane in well water is associated with sodium dominated groundwater.
RÉSUMÉ
L’étude porte sur les schémas de méthane dans les eaux souterraines des aquifères peu profonds des bassins sédimentaires du Carbonifère et du Trias en Nouvelle-Écosse, afin d’améliorer notre compréhension des facteurs qui influent sur la distribution observée. En tout, plus de 800 échantillons de méthane dissous ont été recueillis dans des puits d’eau lors de levés réalisés en 1975 et en 2013. Les analyses statistiques des données sur le méthane ne révèlent pas une différence importante entre les groupes de concentrations de méthane par type d’aquifère, par groupe de substratum rocheux ou par distance des terres humides. On a toutefois observé une différence importante entre les bassins sédimentaires et les formations de substratum rocheux, qui a été en grande partie attribuée aux concentrations de méthane localisées plus élevées dans la formation et le bassin de Stellarton par comparaison avec d’autres bassins sédimentaires terrestres de la province. On a également découvert une différence importante entre les groupes de données sur le méthane fondés sur la distance des principaux chevelus hydrographiques, que l’on a utilisée pour indiquer la position topographique (vallée ou hauteurs). La faible densité des échantillons et le faible pourcentage de concentrations de méthane détectables, ainsi que les multiples sources de méthane dissous dans les eaux souterraines peu profondes des bassins sédimentaires, ont rendu difficiles la détection et l’interprétation des tendances statistiques et spatiales. La classification géochimique indique que les taux élevés de méthane dissous dans les eaux des puits sont associés aux eaux souterraines à concentration dominante de sodium.
[Traduit par la redaction]
INTRODUCTION
1 Recent reviews of shale gas development in Canada have identified the need for an improved understanding of baseline hydrogeological conditions in Carboniferous and Triassic sedimentary basins (Rivard etal. 2014; Wheeler 2014; Council of Canadian Academies 2014). Elevated concentrations of dissolved methane in well water have been associated with areas of existing or potential hydrocarbon extraction (Jackson et al. 2013), however, the spatial distribution and environmental drivers of dissolved methane in these sedimentary basins in Nova Scotia are not well understood. The origin of methane in the subsurface can be biogenic, which tends to be produced from microbial breakdown of organic material at shallow depths and low temperatures (such as occurs in wetlands or carbon rich shales) or thermogenic, produced from abiotic degradation of organic matter buried for millions of years at great depths and temperatures.
Methane in well water
2 Methane is a naturally occurring hydrocarbon that is colourless, odourless and tasteless. In drinking water methane is non-toxic; however, it can cause spurting from taps and ‘water hammer’ (i.e., sudden pipe vibration that occurs when a water valve is closed). Furthermore, if it is allowed to accumulate in enclosed spaces, it can cause oxygen-deficient atmospheres, flammable conditions, and explosions. There is no Canadian drinking water quality guideline (Health Canada 2012) for dissolved methane. The Ontario drinking water standards (Ontario Ministry of Environment 2006) provide an aesthetic objective for methane of 3 L/m 3 (i.e., 2 mg/L) to limit problems with gas bubble release and spurting from taps.
Methane in well water surveys
3 Methane is commonly present at low levels in shallow groundwater and is reported to be detectable in up to 60% of all water wells in the U.S.A. (National Ground Water Association 2013). Regional surveys of methane in well water have recently been carried out in several North American jurisdictions in areas of existing or potential hydrocarbon extraction, including Quebec (Pinti et al. 2013), New Brunswick (Al et al. 2013), New York (McPhillips et al. 2014; U.S. Geological Survey 2012), West Virginia (U.S. Geological Survey 2006) and Pennsylvania (Molofsky et al. 2013).
4 A regional survey of methane in shallow groundwater in the Carboniferous basins of eastern Canada was completed in 1975 by the Geological Survey of Canada (GSC) and provincial partners (Dyck et al. 1976) to investigate whether uranium occurrences could be predicted using well water geochemistry. The survey included the testing of 714 private water wells in Nova Scotia for dissolved methane and other parameters, such as uranium, radon, helium, pH, and selected trace metals. Methane samples were collected in glass bottles at the tap (with the aerator removed), acidified, and then analyzed by mass spectrometry. The results of the study showed that approximately 15% of water wells had detectable levels of dissolved methane. The maximum detected concentration was 9.2 mg/L. Few anomalies and generally low concentrations of methane were observed in Nova Scotia, and the anomalies did not correspond closely to Nova Scotia’s coal fields (i.e., thermogenic methane production) or significant wetland areas (i.e., biogenic methane production) based on available topographic mapping (Dyck et al. 1976). However, due to a strong correlation of methane with manganese, which is associated with reducing environments such as wetlands, and a lack of correlation of methane with helium, which is associated with hydrocarbon deposits, Dyck et al. (1976) attributed the likely source of the observed methane in well water to be biogenic.
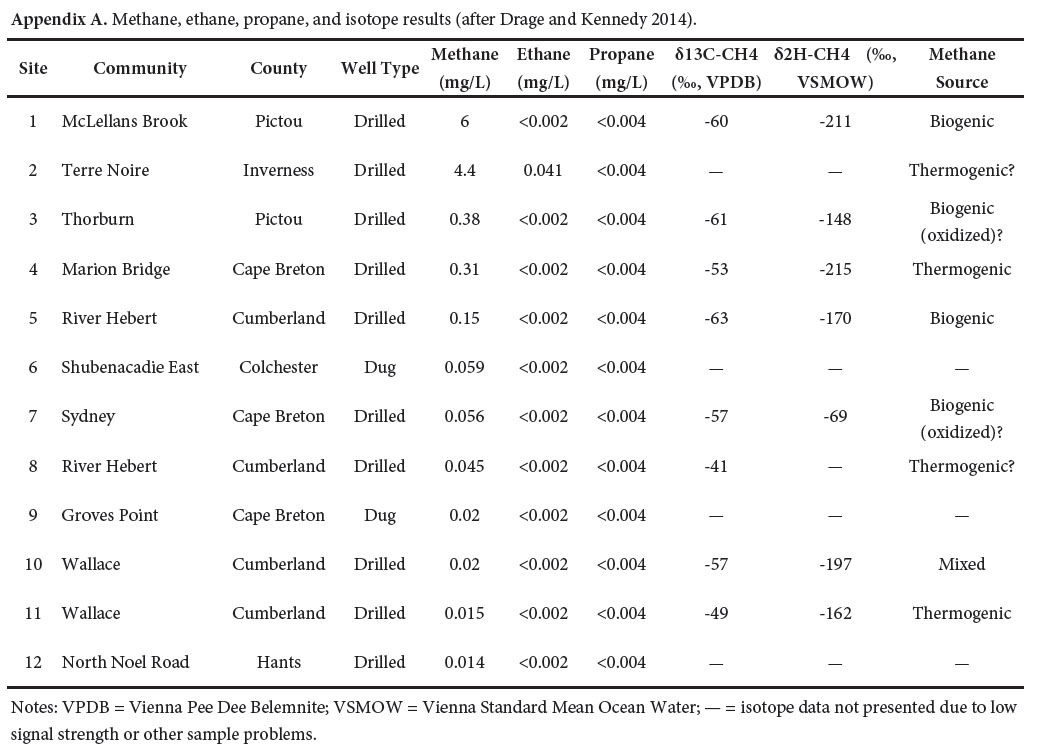
5 In 2013, the Nova Scotia Department of Natural Resources carried out a survey of methane levels in approximately 100 wells in the on-shore sedimentary basins of Nova Scotia. These sedimentary basins are considered to have the highest potential for elevated methane levels in groundwater and include both the Carboniferous and Triassic basins that have historically been the focus of on-shore petroleum exploration. The Carboniferous basin stratigraphy from oldest to youngest includes the Horton, Windsor, Mabou and Cumberland groups (e.g., Keppie 2000). High carbon content is most likely to be associated with organic-rich strata in the Horton and Cumberland groups at the bottom and top of the section, respectively. The survey program was funded by Natural Resources Canada, through the Program of Energy Research and Development (PERD), as part of a project titled ‘Unconventional gas potential from Paleozoic shales of eastern Canada—addressing knowledge gaps for sustainable development’. A summary of the methane survey results is published in Drage and Kennedy (2014). Based on the observed methane-toethane ratios and the isotope results, methane in well water was found to originate from a range of possible sources, including biogenic, thermogenic, and mixtures of these two (Appendix A).
6 Several recent studies have investigated the spatial patterns of regional groundwater methane distribution using statistical techniques, and it has generally been found that dissolved methane in well water was best correlated with groundwater geochemistry (Molofsky et al. 2013; McPhillips et al. 2014) with some studies also reporting significantly higher concentrations of methane encountered in lowland or valley areas compared to upland or hill top areas (Molofsky et al. 2013; Heisig and Scott 2013).
Study objectives
7 The objectives of the present study were (1) to characterize the distribution of background levels of dissolved methane in well water in the on-shore Carboniferous and Triassic sedimentary basins of Nova Scotia using hydrogeologic and landscape criteria; and (2) to analyze dissolve methane patterns using a variety of statistical techniques to better understand the factors influencing the observed distribution.
METHODS
Sample collection
8 Water wells owned and operated by the Government of Nova Scotia and located in the province’s Carboniferous and Triassic sedimentary basins were sampled for dissolved methane in 2013. These included water wells at public schools, provincial parks, museums, visitor information centres, and other government offices and maintenance facilities. All of the wells that were sampled were active water supply wells in surficial (n= 8) and bedrock aquifers (n = 95) that are routinely monitored for chemical and biological water chemistry parameters. The majority of these wells therefore had well water chemistry results (e.g., major ions and trace metals) available (Nova Scotia Department of Natural Resources 2014). Due to the sampling program’s reliance on individual wells, areas serviced with municipal water within the sedimentary basins could not be included in the survey.
9 An initial sampling program was carried out in September 2013 where 103 water wells were sampled for dissolved methane analysis. Based on the initial results, 12 water wells with elevated methane concentrations were selected for additional sampling and analyses, including ethane, propane and carbon, and hydrogen isotopes of dissolved methane to help determine whether the methane was of thermogenic or biogenic origin. A third sampling event was carried out in December 2013 to re-sample the wells with the highest methane results from the September 2013 sampling event, and to collect quality assurance and quality control (QA/QC) samples.
10 The well water samples were collected from a raw-water source (i.e., before water treatment) as close to the wellhead as possible, which generally involved collecting samples from a tap located at the pressure tank. The samples were collected in accordance with the method described by the U.S. Geological Survey (2005) for sampling dissolved gases where samples are collected with the sample bottle submerged under water so that the sample never contacts the air and the potential for methane volatilization is minimized. Additional details on the 2013 sample collection protocol are available in Drage and Kennedy (2014).
Sample processing
11 Analyses for dissolved methane were submitted to Maxxam Laboratories in Bedford, Nova Scotia and were performed using the modified method 6211B (Rice et al. 2012). The reportable detection limit for dissolved methane was 0.003 mg/L. Quality assurance and quality control (QA/QC) for the project was achieved by submitting approximately 5% of the dissolved methane samples as field duplicates. The field duplicates were collected during the third sampling event in December 2013. During the QA/QC sampling event, the five locations with the highest methane concentrations were resampled. Two samples were collected at each location: a primary sample and a field duplicate. The 2013 sample collection protocol allowed methane results to be compared for samples collected at the same location at two different times (i.e., September and December) and at the same location and same time (i.e., December field duplicate).
Data analysis
12 ArcGIS 10 (ESRI, Inc.) geographic information system software was used to analyze the distribution of dissolved methane concentration data. Where possible, both the 1975 survey data and the September 2013 survey data were used in the spatial analysis. Water sample locations were classified according to the aquifer type (surficial vs. bedrock), sedimentary basin, hydrostratigraphic unit supplying the water well (based on bedrock group or formation), distance to wetlands (Nova Scotia Department of Natural Resources 2012), and major stream systems (Nova Scotia Geomatics Centre 2014). The sedimentary basins were assigned to sample locations based on mapping by the Nova Scotia Department of Energy (S. Weldron, unpublished data) and the hydrostratigraphic units were assigned to water samples based on provincial scale bedrock geology mapping (Keppie 2000). Methane samples were grouped according to their proximity to wetlands (<100 m) to investigate whether wetland areas are associated with elevated methane in well water. Methane samples were also grouped according to their proximity to major stream features (<300 m) to differentiate valley vs. upslope landscape position.
13 Statistical analyses were conducted using statistical software STATA® (StataCorp, LP) and ProUCL 5.0, which was developed by the United States Environmental Protection Agency (US Environmental Protection Agency 2013a). ProUCL 5.0 is designed for statistical analyses of environmental data and is adapted to handle left censored datasets with a skewed distribution, such as water chemistry (i.e., analyte concentrations are below laboratory detection limits). The Tarone-Ware rank sum non-parametric test for censored data with multiple detection limits (i.e., 1975 vs. 2013 surveys) was used in ProUCL 5.0 to analyse the dissolved methane data where two evident groupings of methane data were present (two tailed test, 95% confidence interval). The rank-sum test requires no assumptions about the population distribution and is resistant to outliers. Where multiple groupings of the methane data were evident, the Kruskal-Wallis non-parametric test, which extends the rank sum test to more than two groups, followed by Dunn’s pair-wise comparison test was performed in STATA®. The rejection of the null hypothesis (i.e., all samples originate from the same distribution) in the Kruskal-Wallis test indicates that at least one sample stochastically dominates at least one other sample, meaning that a randomly drawn sample from at least one group is more likely to be larger than smaller than a randomly drawn sample from a different group. The Dunn’s test (Dinno 2014) was applied to evaluate stochastic dominance within the groupings.
14 For each of the wells sampled during the 2013 methane survey, the Nova Scotia Groundwater Chemistry Database (Nova Scotia Department of Natural Resources 2014) was searched to locate the most recent representative water chemistry data. Well water chemistry (n=97) was then classified using major cation and anion data (Deutsch 1997), a Piper diagram was generated, and methane concentrations were compared to the interpreted geochemical categories.
RESULTS
Baseline distribution and statistical summaries
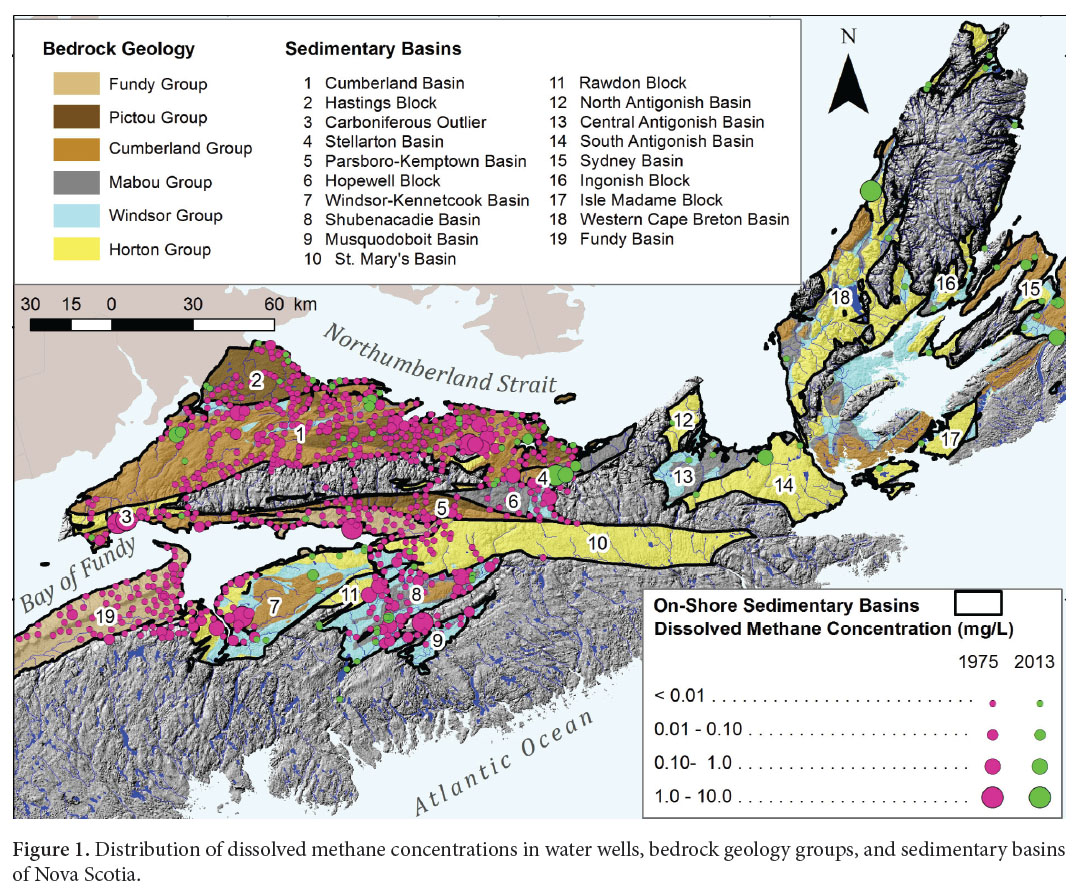
15 A map showing the distribution of dissolved methane concentrations in well water from the 1975 and 2013 surveys is shown in Figure 1. The percentage of wells with detectable methane in the combined Nova Scotia surveys was 15%, which is low compared to previous surveys in West Virginia (77%; U.S. Geological Survey 2006), Pennsylvania (78%; Molofsky et al. 2013) New York (53%; U.S. Geological Survey 2012) and the Quebec lowlands (90%; Pinti et al. 2013), where much higher percentages of detectable concentrations of methane were reported. The percentage of samples with detectable methane found in Nova Scotia is similar to the percentage reported in a survey recently completed around the McCully gas field in New Brunswick (12%; Al et al. 2013).
16 A statistical summary of methane concentrations classified by aquifer type, sedimentary basin and hydrostratigraphic unit of well completion (based on bedrock group) is provided in Table 1. Concentrations of dissolved methane ranged over three orders of magnitude (MDL < 0.003 mg/L to 9.2 mg/L) in the combined dataset. The Kaplan-Meier (K-M) mean and percentage of samples with detectable methane was greatest for the Stellarton (100%) and Windsor-Kennetcook (30.2%) basins (minimum of 3 samples with detectable methane) compared to other sedimentary basins in the province, although the basin sizes and corresponding sample sizes vary widely (e.g., n=4 and area is 9 307 ha for Stellarton basin and n=43 and area is 144 014 ha for Windsor-Kennetcook basin). The K-M method has been shown to perform well in terms of bias in estimates of mean for datasets with non-detects and multiple detection limits (US Environmental Protection Agency 2013b). Less variability is observed in the measures of central tendency for the other major groupings presented in Table 1 (aquifer type, hydrostratigraphic unit of well completion).
 Display large image of Figure 1
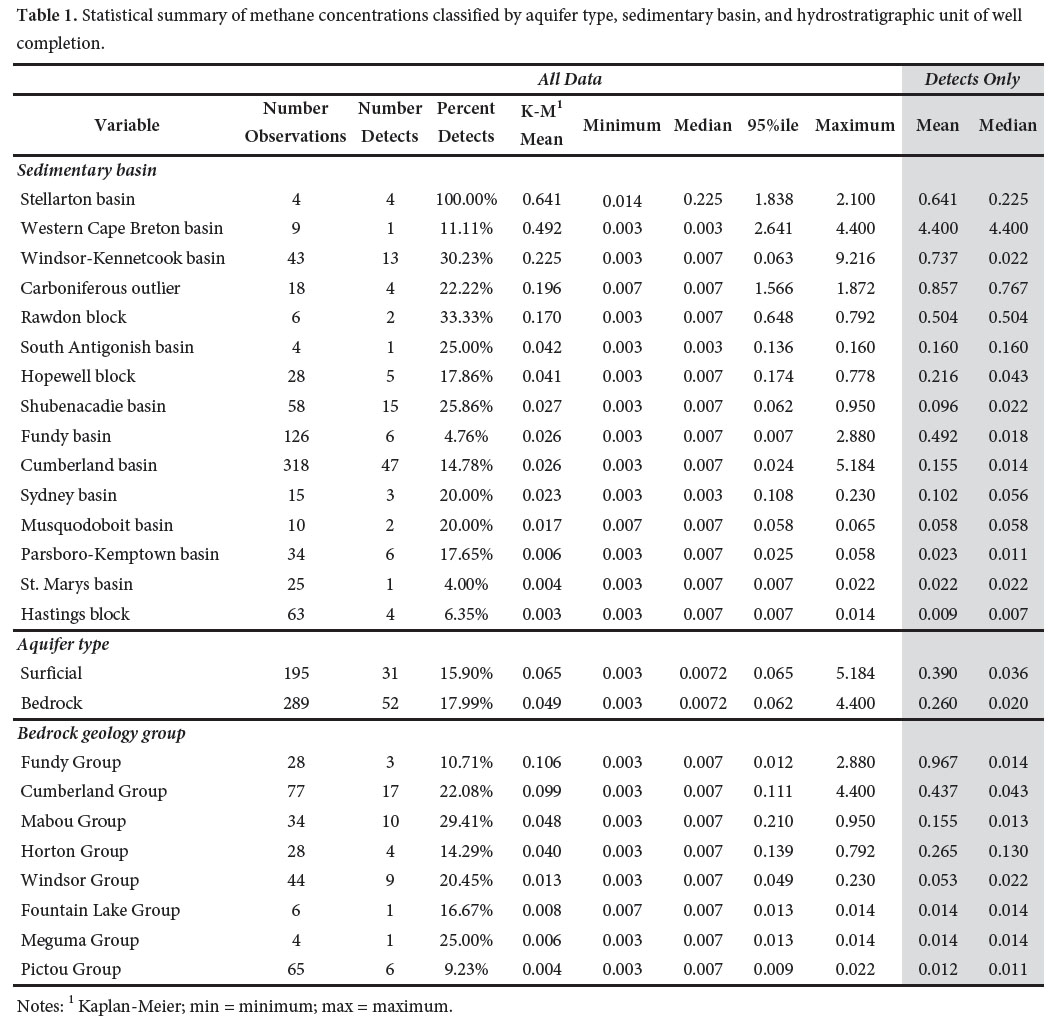 Display large image of Table 1
Statistical analysis
17 The distribution of populations compared using the Tarone-Ware rank sums non-parametric test were visually checked using quantile-quantile (Q-Q) plots to ensure that distributions were similar and variances were comparable. Statistical comparison of methane concentration data using the Tarone-Ware test indicated a significant difference (p=0.0034) between the distribution of samples less than 300 m (n=99) and greater than 300 m (n=718) from a major stream feature. The proximity to streams was used to differentiate valley from upslope sample locations, with greater methane concentrations expected in valley areas because these areas are more likely to represent regional groundwater discharge areas, and hence groundwater with a longer residence time in the subsurface and greater potential to interact with strata producing methane (Heisig and Scott 2013). The present study, however, found significantly elevated methane levels in upland areas (i.e., >300 m from stream feature) compared to valley areas. This finding may indicate that methane production is not closely associated with deep thermogenic sources in Nova Scotia or that distance from major streams (based on available provincial mapping) is not a reliable surrogate variable for topographic position or confining conditions.
18 Isotope analysis was completed on 12 samples (Drage and Kennedy 2014), and for half of these samples, the source of methane was considered to be biogenic (Appendix A). To characterize the potential for wetlands to be a source of methane in the groundwater flow system, a statistical comparison of methane concentrations using the TaroneWare rank sums non-parametric test for samples less than (n=128) and greater than 100 m (n=689) from wetlands was conducted. No significant difference (p=0.521) between the groupings was found. Comparison of methane concentration using the Tarone-Ware method also did not show a significant difference (p=0.578) between the distribution of samples completed in surficial aquifers (n=195) compared to bedrock aquifers (n=289).
19 Statistical comparison of methane concentration using the Kruskal-Wallis non-parametric test found a significant difference (p<0.0001) between methane concentrations grouped by sedimentary basin. Additional pair-wise comparison of the basins using Dunn’s test found that the Stellarton basin showed stochastic dominance within the 19 groupings. Comparison of methane concentrations using the Kruskal-Wallis method found no statistically significant (p=0.147) difference between hydrostratigraphic units (based on bedrock group) where there was adequate well construction information to assign a source hydrostratigraphic unit to the water sample. When the hydrostratigraphic units were assigned to methane concentration results based on bedrock formation, however, a statistically significant difference (p<0.0001) was found using the Kruskal-Wallis test, again due to the stochastic dominance of the Stellarton Formation of the Cumberland Group, which was evident from the pair-wise analysis. The Stellarton Formation is a known coal bearing geological unit, although both wells sampled in this area (community of River Hebert) for isotope analyses indicated a biogenic source (Appendix A). A summary of the statistical analyses discussed above is provided in Table 2.
Well water geochemistry
20 Assessment of major anion and cation chemistry (Fig. 2) revealed that the majority (55%) of representative water samples associated with the wells sampled during the 2013 survey were either calcium bicarbonate (Ca-HCO 3 ) or calcium chloride (Ca-Cl) groundwater types according to the classification scheme presented in Deutsch (1997). Comparatively, 22% of the groundwater samples were classified as either sodium-chloride (Na-Cl) or sodiumbicarbonate (Na-HCO 3 ) type groundwater, but these samples accounted for 50% of the detectable concentrations of methane. The only two wells sampled in 2013 with methane values exceeding 1 mg/L were both associated with sodium-bicarbonate (Na-HCO 3 ) type groundwater. These findings are consistent with previous studies by Molofsky et al. (2013) and McPhillips et al. (2014) where elevated concentrations of methane were associated with sodium-dominated water.
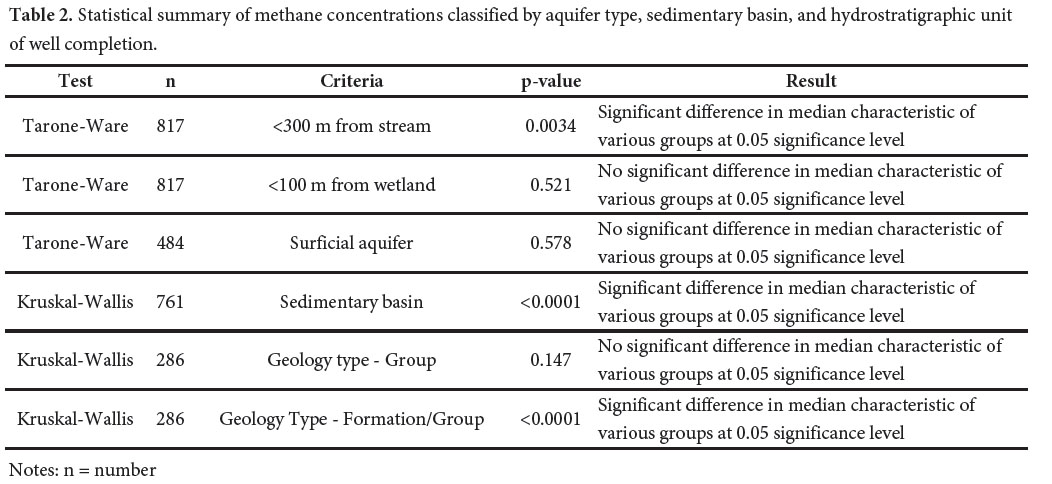 Display large image of Table 2
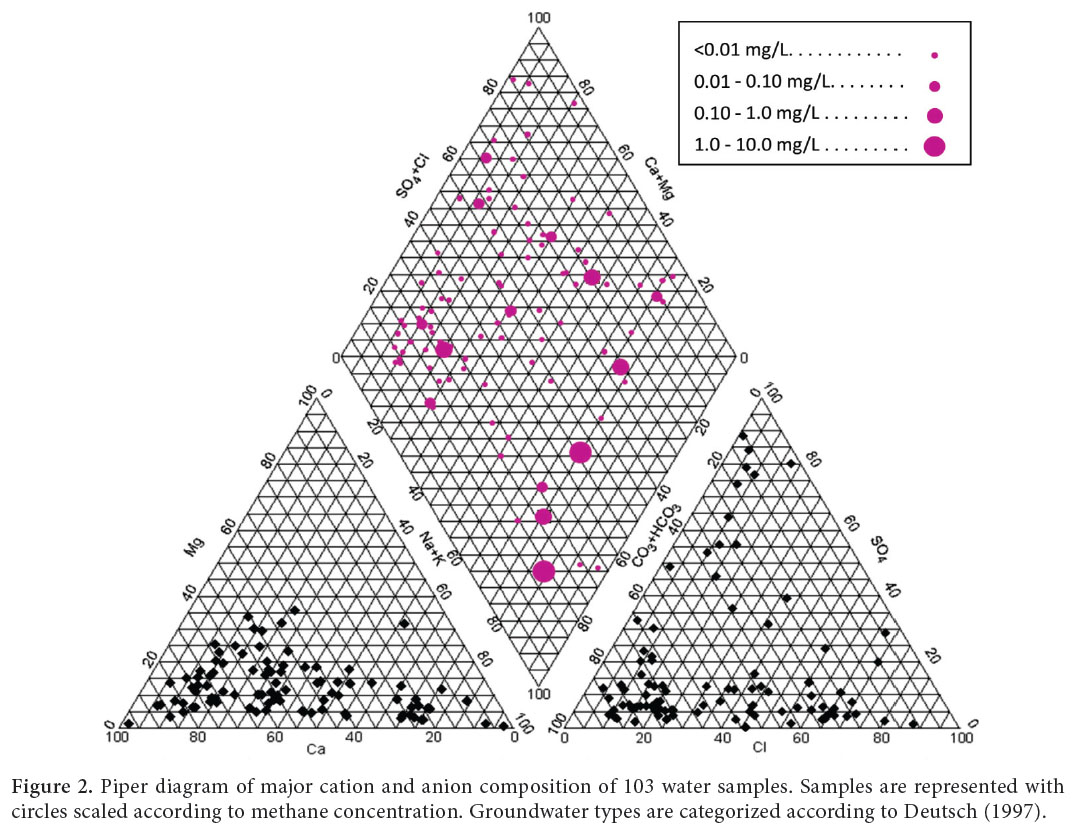 Display large image of Figure 2
21 The association of sodium dominated water types with elevated methane concentrations suggest that wells exhibiting higher methane levels intercept or are influenced by aquifers containing sodium bearing rock units, such as Windsor Group rocks. The association could also be attributed to longer groundwater residence times (and therefore, longer rock-water interaction times) and/or interaction between sodium-chloride rich water originating from deeper, more saline aquifers and shallow aquifer systems (i.e., <100 m depth).
CONCLUSION
22 This study advances the understanding of patterns of groundwater methane in Nova Scotia and complements the previous analysis of potential sources of methane by Drage and Kennedy (2014). The Stellarton Formation/ basin showed significantly higher dissolved methane concentrations in groundwater compared to other onshore sedimentary basins of the province despite a low number of samples (n=4). The Stellarton basin is of limited areal extent, and other zones with elevated methane in groundwater may occur within some of the broader sedimentary basins, such as the Windsor-Kennetcook and Cumberland basins (Fig. 1). The low sample density, the low percentage of detectable methane concentrations and the likely multiple sources of dissolved methane in shallow groundwater in Nova Scotia’s sedimentary basins (see Appendix A) make it difficult to detect and interpret statistical and spatial trends. Recommendations for future work include additional methane sampling in areas with data gaps (e.g., Cape Breton, northeastern mainland Nova Scotia, areas within municipal water servicing) and anomalously high concentrations (e.g., Stellarton basin), and additional isotope testing to confirm methane sources. Test drilling at strategic locations with detailed vertical characterization of methane concentration and corresponding borehole stratigraphy would also advance our understanding of the spatial distribution of methane in groundwater. Geochemical classification suggests that elevated dissolved methane in well water is associated with sodium dominated groundwater in Carboniferous and Triassic sedimentary basins of Nova Scotia.
The authors would like to gratefully acknowledge assistance and advice provided by several individuals and organizations, including Denis Lavoie (Natural Resources Canada), Fraser Keppie (Nova Scotia Department of Energy), and Robert Apold and Paula Smith (AquaCheck Inc.). The methane sampling program conducted in 2013 was funded by Natural Resources Canada through the Program of Energy Research and Development (PERD), as part of a project entitled "Unconventional gas potential from Paleozoic shales of eastern Canada - addressing knowledge gaps for sustainable development". Terry Hennigar and an anonymous reviewer are thanked for their comments on the earlier version of this paper. Ian Spooner is thanked for his editorial handling of this paper.
 Display large image of Table 3