Special Series - Enviromental Geoscience
Late Wisconsinan and Holocene development of the Grand Lake Meadows area and southern reaches of the Saint John River Valley, New Brunswick, Canada
ABSTRACT
A 67 m near-continuous stratigraphic core was recovered from drilling at Grand Lake Meadows, located near the junction of Grand Lake and the Saint John River, approximately 40 km south of Fredericton, New Brunswick. From analyses of recovered samples and finite radiocarbon dating, four phases of development of the study site and surrounding environs were identified to have occurred following the Late Wisconsinan glacial maximum. Phase I, related to the formation of the DeGeer Sea, commenced more than 15 000 calyBP from deglaciation accompanied by marine transgression. Phase II began ~14 000 calyBP and continued until approximately ~8000 calyBP during which time there was major isostatic readjustment in the region and formation of a stratified, mostly brackish, ancestral Grand Lake and transformation into a mostly freshwater, Lake Acadia. Phase III began shortly after 8000 calyBP and continued until after 3000 calyBP accompanied by return of the Saint John River to a fluvial- dominated system after down-cutting an outlet at the Reversing Falls gorge, and draining much of Lake Acadia. During phase IV, ~3000 calyBP to present, estuarine conditions were initiated as marine water advanced up- stream over the Reversing Falls, leading to the development of the modern river system and Grand Lake Meadows.
RÉSUMÉ
On a obtenu une carotte stratigraphique quasi continue de 67 m d’un forage dans la région des prés du Grand Lac, près de la jonction du Grand Lac et de la rivière Saint John, à environ 40 km au sud de Fredericton, Nouveau- Brunswick. L’analyse des échantillons récupérés et la détermination au radiocarbone de l’âge fini ont permis de préciser que quatre phases de développement se seraient produites sur le site d’étude et les terrains avoisinants après le maximum glaciaire du Wisconsinien tardif. La phase I, liée à la formation de la mer DeGeer, a débuté plus de 15 000 ans cal BP, à la suite d’une déglaciation accompagnée d’une transgression marine. La phase II a commencé environ 14 000 ans cal BP et a duré jusqu’à plus ou moins 8 000 ans cal BP. À ce moment-là, il y eut, dans la région, un réajustement isostatique majeur et la formation du Grand Lac ancestral stratifié, principalement saumâtre, ainsi que la transformation du lac Acadia en un lac principalement composé d’eau douce. La phase III a commencé peu de temps après, il y a 8 000 ans cal BP, et s’est poursuivie jusqu’à il y a 3 000 ans cal BP. Cette période a vu la rivière Saint John redevenir un système principalement fluvial après avoir réduit le débit de la gorge des chutes réversibles et drainé la majeure partie du lac Acadia. Durant la phase IV, qui s’étend depuis environ 3 000 ans cal BP jusqu’à ce jour, des conditions estuariennes se sont manifestées alors que l’eau de mer s’est introduite en amont des chutes réversibles, conduisant au développement du système fluvial actuel et des prés du Grand Lac.
[Traduit par la redaction]
INTRODUCTION
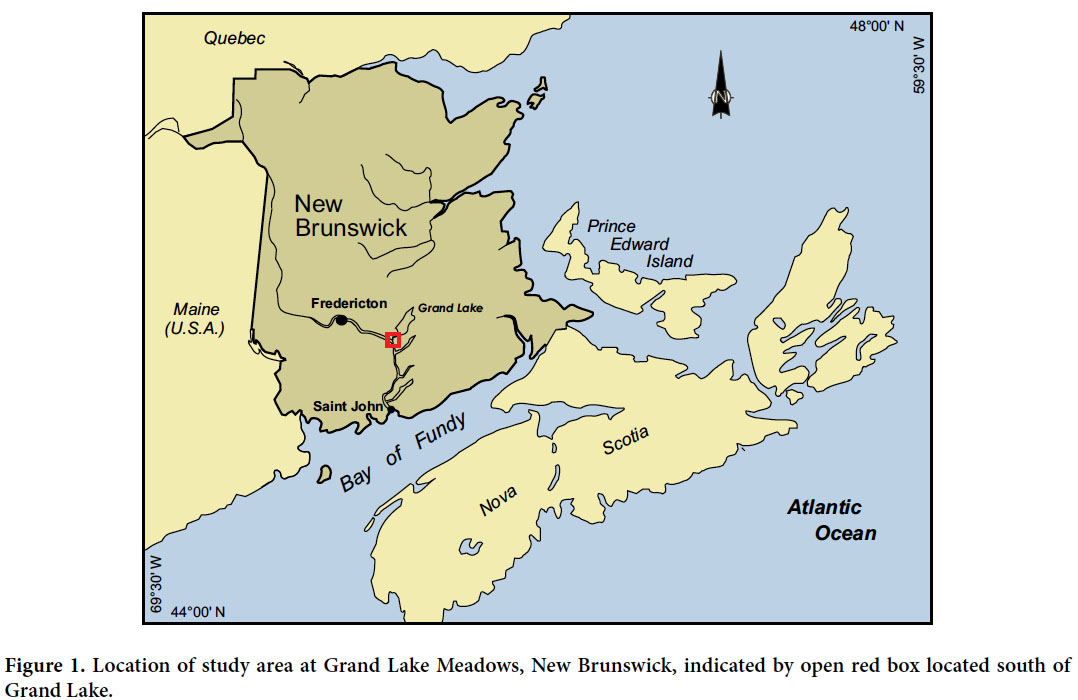
1 Discovering and understanding the geomorphological processes operating on the physical environment is a current focus in geological, environmental, ecological, and archaeological research. The mechanisms driving these physical processes are often complicated, involving many components that operate on diverse scales varying from macro- to micro-regional. Several events have contributed to the formation of the estuarine landscape of the lower Saint John River Valley and Grand Lake Meadows (Fig. 1) including riverine, marine, lacustrine, and terrestrial processes, as well as glaciation. Both the river and Meadows systems are dynamic features of the landscape, whose characteristics varied over time and space due to their associated link with geological and climatic controls affecting the region.
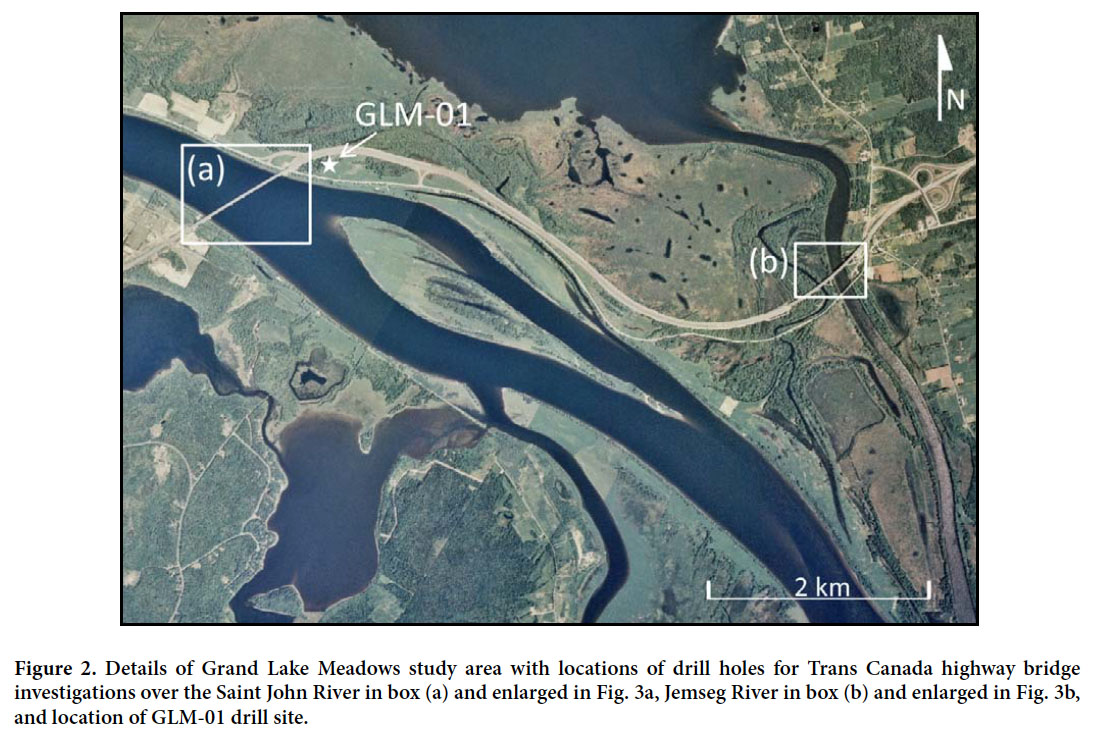
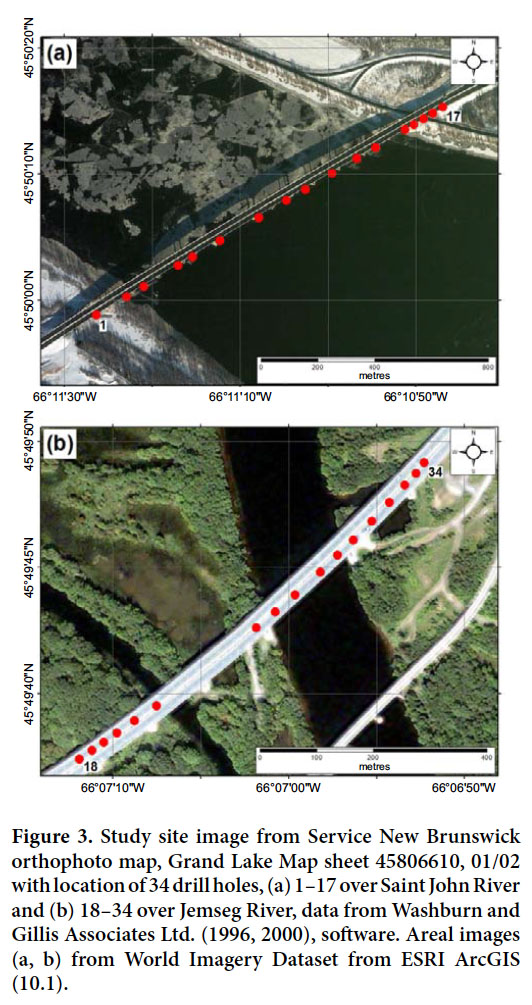
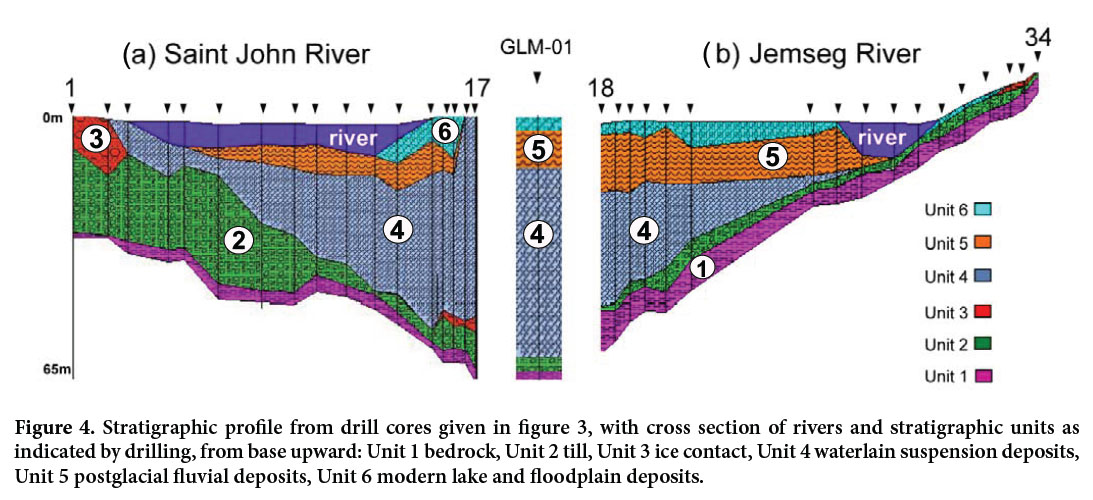
2 The study site afforded a unique location (Figs. 1, 2) situated on the northeast side of the Saint John River at the confluence of Grand Lake and the Saint John River. Drill logs from 34 holes drilled for the New Brunswick Department of Transport (DOT) related to Trans Canada Highway (TCH) and bridge construction (Washburn and Gillis Associates 1996, 2000), were provided by Maritime Road Development Corporation and used to construct a stratigraphic profile for sediments to about 70 m thick overlying bedrock at the Meadows (Figs. 3, 4). During June of 2006, GLM-01 was drilled to a depth of 67.5 m at 45° 50’ 14” N and 66° 10’ 33” W (NAD830CSRS); a location correlative with previous DOT drill log data (Figs. 2, 3). Analytical results of GLM-01 and interpretations are discussed herein. To minimize confusion with references citing published non-calibrated radiocarbon dates (yBP), calibrated dates are used sparingly and are denoted as calyBP.
 Display large image of Figure 1
Location and geomorphology
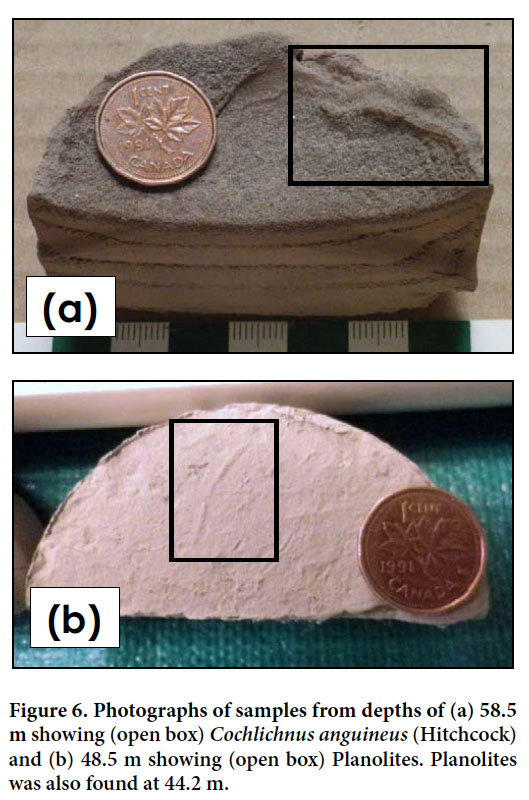
3 The Grand Lake Meadows is located in south-central New Brunswick, approximately 40 km east of Fredericton, within the lower Saint John River Valley (Figs. 1, 2). The region consists primarily of a broad floodplain, mid-channel and point bars, and wetland meadow, with various smaller bodies of water. At approximately 16 500 ha (~41 000 acres) in surface area, Grand Lake is the largest inland lake in New Brunswick and in all of Atlantic Canada. The lake connects with the Saint John River via the Jemseg River, approximately 6.5 km in length (Fig. 2), and via groundwater flow through the study site. The study site occupies part of the Meadows and is an aggrading channel bar less than 1 km wide at its narrowest point that separates the Saint John River from Grand Lake. The Saint John River at this location is estuarine and flows into the Bay of Fundy approximately 68 km downstream of Grand Lake. The river gradient is low and both the river and lake are ~2 m above mean sea level (msl). The effect of tide head results in a rise in river level in this area, which is most obvious when the lake and Saint John River are at their lowest levels, and also during storm conditions when the Saint John River is influenced by high tides in the Bay of Fundy.
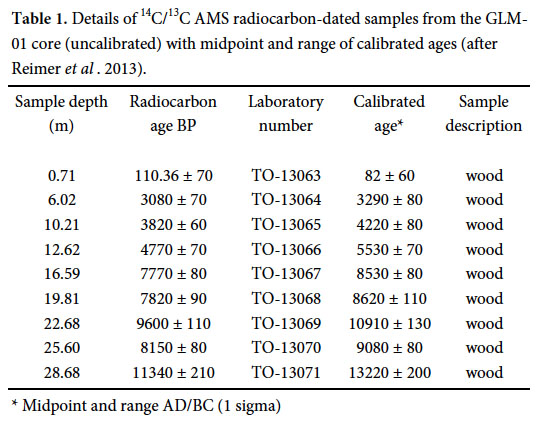
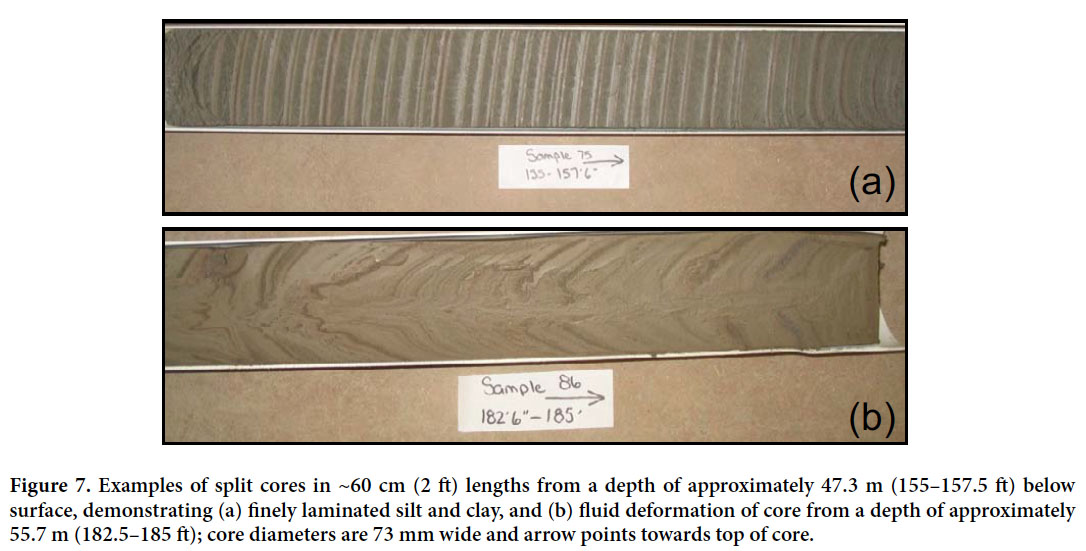
4 Grand Lake is a major contributor to groundwater in the area, although this resource is stratified at depth. In New Brunswick at sites within 75 km of the coast, brackish water is frequently encountered during drilling, underlying fresh water at depths as little as 60 m. One cause of this stratification is saline intrusion along coastal areas; another is due to the migration of a saline wedge and intrusion into aquifers along estuary valleys (Broster 2008). A third cause is attributed to pockets of remnant late glacial seawater remaining from a marine incursion of this region following deglaciation (Giudice and Broster 2006). Currently, groundwater from local aquifers at shallow depths (<50 m) is within acceptable limits of the Canadian drinking water quality (Health Canada 1996), although rising sea level will result in a decreased potable ground water supply due to rise in the saline/fresh groundwater boundary and inland movement up estuaries and buried channels. Present chloride concentrations are commonly less than 10 ppm within Grand Lake, where as higher chloride concentrations in GLM-01 (discussed below) indicate deposition under previous marine conditions.
 Display large image of Figure 2
 Display large image of Figure 3
Glacial history
5 The late Pleistocene/early Holocene history of the study area is significant to the modern structure of the lower Saint John River. During the Late Wisconsinan New Brunswick was covered by glaciers flowing south to southeast (Lee 1957; Gadd 1973; Thibault 1981; Rampton et al. 1984; Seaman 1989, 2004, 2006; Seaman et al. 1993). Rampton et al. (1984) and Seaman (1982, 2004) suggest that shortly after 14 500 yBP glacier volumes and extent decreased by means of regional ice stagnation and down-wasting. Deglaciation and marine submergence were contemporaneous events creating a broad embayment extending inland from the Bay of Fundy (Rampton et al. 1984; Broster et al. 2013). From studies in Maine, Belknap et al. (2005) implied an earlier removal of ice possibly coincident with a marine transgression at around 15 500 yBP in the Bay of Fundy, followed by the lowering of sea-level until isostatic rebound reached its maximum elevation at around 12 000 yBP, which was followed by isostatic readjustment of the coast from a marginal bulge (glacier forebulge). While timing of isostatic events may have been slightly different in our area,the Bay of Fundy was not completely filled until after 7000 yBP (Fader et al. 1977) and much of the Bay was likely subareal from 12 000–7000 yBP.
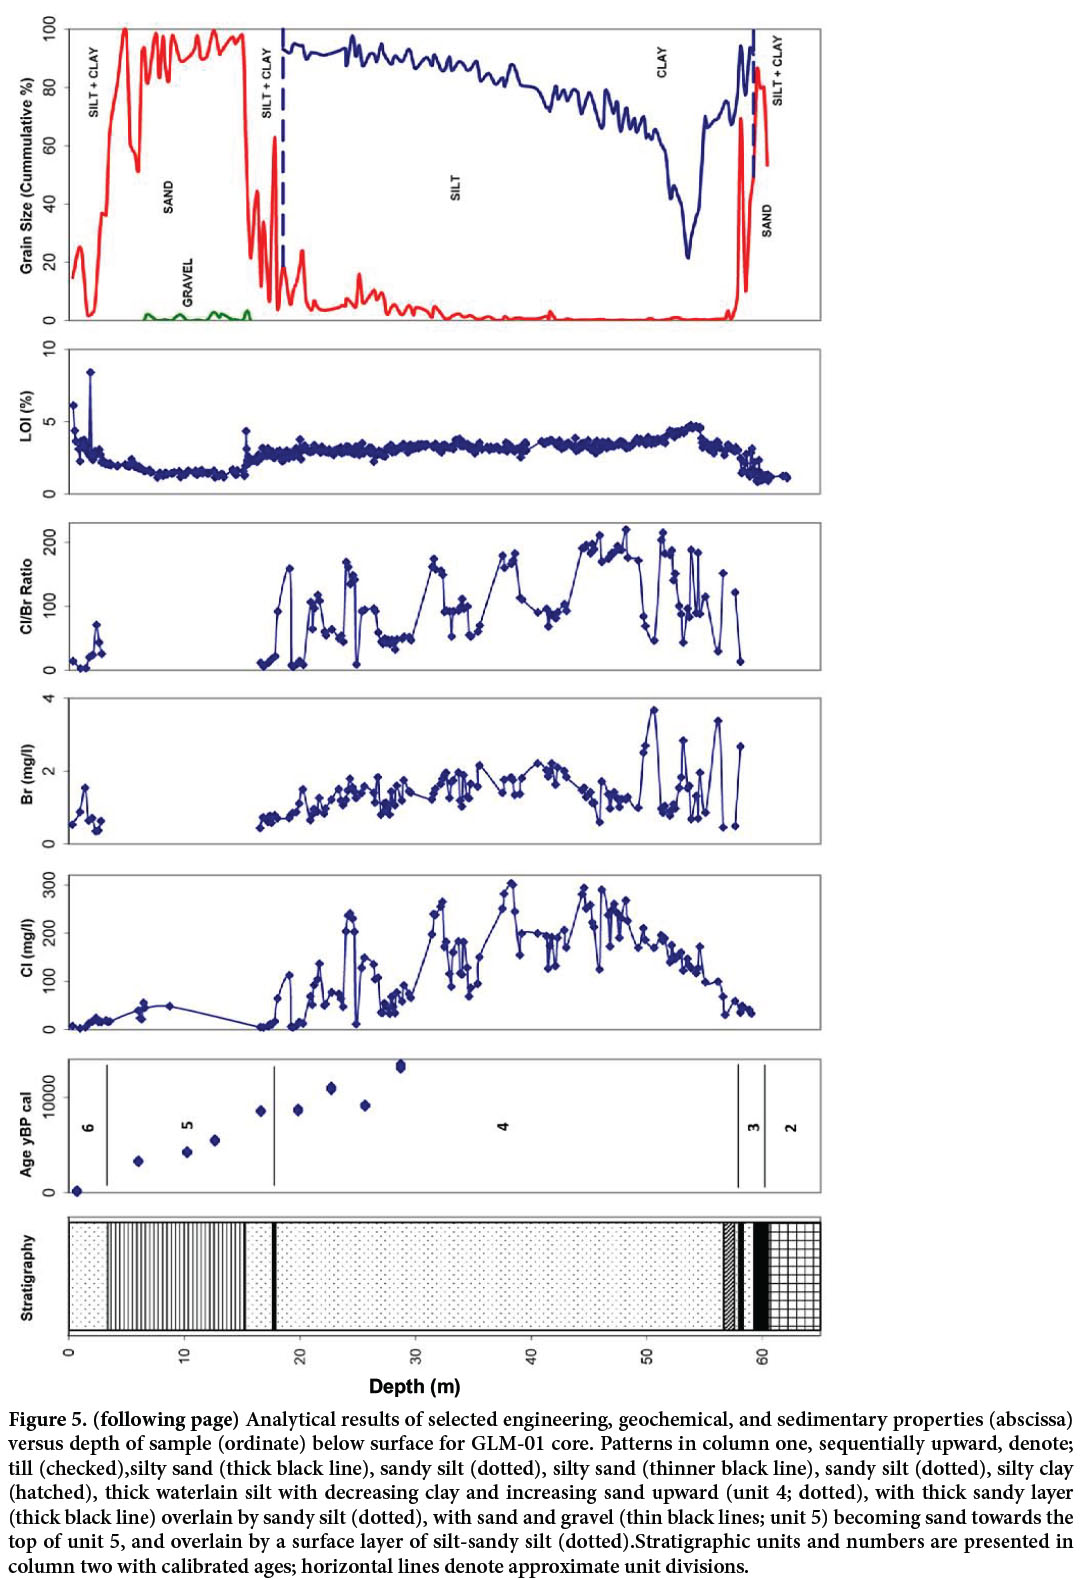
6 Water level in the lower Saint John River Valley has fluctuated at different times and for different reasons since the end of the last glaciation. Eustatic sea-level rise, local tectonic events, isostatic adjustment, flexure of the glacial forebulge, and tidal expansion have collectively affected the marine limit in the Bay of Fundy (Struiver and Borns 1975; Rampton and Paradis 1981; Seaman 1982; Rampton et al. 1984; Gehrels et al. 1996; Shaw et al. 2002, Belknap et al. 2005). As glaciers retreated a large body of water inundated the Saint John River Valley and much of southern New Brunswick. This water body has been called Lake Acadia by Chalmers (1902) and interpreted by Kiewiet de Jonge (1951) as an arm of the Late Glacial DeGeer sea (named after G. De Geer). Lee (1957) suggested that Lake Acadia was at first an ice-dammed glacial lake and subsequently an estuary. Studies by Broster et al. (2013) at Fredericton (Fig. 1) indicate that sea water invaded much of the lower Saint John River Valley during deglaciation and was trapped by isostatic rebound as previous outlets to the ocean were cut off. Seaman et al. (1993) suggest that burial of the previous outlet for the Saint John River at the Bay of Fundy by an end moraine (~14 000 yBP uncalibrated, 15 000 calyBP, Seaman personal communication 2014) likely initiated capture of marine water and formation of a large ancestral Grand Lake; considered herein to have been the formation of the DeGeer inland sea.
BOREHOLE GLM-01
Field and laboratory analysis
7 Drilling of GLM-01 occurred between June 14–18, 2006, sited on an aggrading channel bar sequence located between the Saint John River and Grand Lake, approximately 3 m above mean sea-level at drill site (Fig. 2). A track-mounted hollow stem auger was used to drill to a depth of 67 m; bedrock was determined at 64 m and till was encountered at 60 m. Visible gas was released from the drill hole during drilling through interbedded sand and silt at 17.0–17.6 m. The release lasted for less than 1 minute and gas samples could not be collected for analysis (see Dickinson 2008). Core samples representing a near-continuous core were collected along the full length of the borehole using 75 mm (3 inch) diameter Shelby tubes and 50 mm (2 inch) outside diameter split-spoon samplers for non-cohesive soils. Samples were returned to the Civil Engineering Soils Laboratory at the University of New Brunswick(UNB) and split longitudinally, with one half preserved for detailed sediment logging and the other half used for geotechnical analysis. The full length of the core was allowed to dry and visually examined at the Sedimentology Laboratory (Department of Earth Sciences, UNB) to produce a detailed lithological record.
8 Grain size analysis was carried out on all 153 samples collected, using sieves only for 49 samples and also by hydrometer for 104 silt- and clay-rich samples as set out in ASTM D 422-63 (1992), slightly modified (Bouyoucos 1962). Natural moisture contents, liquid and plastic limits, and activity were analysed for 77 samples of the clay-silt sediments located between 18.5–59.2 m using standard analytical procedures (ASTM 2216-98 1998; ASTM D 4318- 00 2000). For 52 samples from the clay-silt unit, mineralogy was determined using X-Ray Diffraction (XRD) and chloride concentrations were determined using Inductively Coupled Plasma-Optical Emission Spectrometry (ICP- OES). Samples were analysed using standard operating procedures for a Bruker D8 Advance Solid State Powder Diffraction XRD System. Using a Dionex, DX-120 ion chromatograph, chloride (Cl) and bromide (Br) content was determined using method 4110 (Eaton et al. 1995) for 148 samples ranging in depth from 0.3–59 m. Loss-on-ignition (LOI) for 489 samples, followed methods by Dean (1974) with modifications by Dickinson (2008) after analytical tests on reference samples produced consistent results only after the samples were heated at 550°C for 2 hours. These analyses were conducted at the Department of Earth Sciences, University of New Brunswick. Nine wood fragments were obtained from the core and sent to IsoTrace Radiocarbon Laboratory at the University of Toronto Accelerator Mass Spectrometry Laboratory for determination of 14C/13C ratios. Calibration dates (calyBP) were calculated following the method of Reimer et al. (2013).
RESULTS AND INTERPRETATION
9 A stratigraphic profile for the Meadows was delineated from TCH drill logs supplied by Maritime Road Development Corporation (Fig. 3), which confirmed visual observations of GLM-01 core samples (Fig. 4). A mixture of very compact, fine-grained, grey-brown, sandy silt with subangular to subrounded striated pebbles and cobbles of mixed lithologies was recovered from the lower 64–60 m overlying bedrock. The sediment is interpreted as till and is similar to that recognized locally (Rampton et al. 1984; Seaman et al. 1993). The predominance of non-local lithologies suggest that the till is englacial or supraglacial (Dreimanis 1976), most likely deposited from stagnant or retreating ice.
10 Overlying till at a depth of 60 m, poorly sorted silty sand grades upward into centimetre-thick layers of silt and sand, becoming 2–3 mm thick couplets of sandy silt and clay laminae at 58 m to 56 m (Fig. 5). The poorly sorted sand grains are angular to sub-angular in shape when viewed through a magnifying glass, and may indicate deposition proximal to a melting ice-front with variable current strengths, grading upwards into material deposited under a low-energy regime.
11 Clay layers increase in frequency upwards from 59 m (Fig. 5) as sediment becomes finer and well-laminated showing ‘varve’-like couplets of alternating grain size and colour. Between 56 and 52 m clay content increases, with a high of 78.3% clay at 53 m. This part of the core commonly demonstrates deformed layering and fluid-escape structures causing couplets to be less distinct. This zone (56–52 m) also includes the highest plastic index values from 7 to 12 PI (Dickinson 2008). Deformation is restricted to this interval of the samples, which may have been due to collection and transportation of samples containing zones of material sensitive to disturbance. Natural water content percent is approximately 30% in most zones and exceeds 40% in some deformed samples (Dickinson 2008).
12 Trace fossils Cochlichnus anguineus (Hitchcock) was found at 58.5 m (Fig. 6a) and Planolites were found at 48.5 m and 44 m (Fig. 6b). Both organisms are infaunal and occur across many facies. However, their occurrence indicates that this interval was not representative of an isolated proglacial lake, devoid of life.
13 Above 56 m the sediments are highly laminated with layers as thin as 2 mm occurring between 54–51 m (Fig. 7a). Lamina thickness was 3 to 5 mm with rare lamina up to 7 mm (i.e., at 33 m) possibly due to turbation or storm events causing erosion and re-sedimentation. Several core samples demonstrated deformation and mixing of layers in the upper part of the cores due to disturbance caused by impact of the sampling tube during collection or extraction of the samples from the sampling tubes (Fig. 7b). With the exception of the lowermost sandy layers (<58 m), natural water content was commonly found to be above 30% and >40% in some areas (Dickinson 2008). From 58 to 15 m a total of 3472 couplets were counted, with more than 70% of the couplets occurring below the level of the oldest dated material of 11 340 ± 210 yBP at 28.68 m (Table 1). The couplet data are not considered to provide an exact representation of the age of the unit as some couplets may not be true varves. Also, some laminations have been obscured by deformation and some material has likely been eroded during the onset of fluvial conditions at the top of the unit (at 15 m). Nonetheless, the data is consistent with the area becoming ice free sometime between 13 000 and 14 000 yBP.
 Display large image of Figure 4
14 Distinct visual laminations within the sediment were not clearly visible between 28 m and 22 m depth. The 8150 yBP and the 9600 yBP dated materials were recovered at 25.6 m and 22.68 m, respectively, suggesting a potential dating error associated with mixing, possibly due to subaqueous slumping, bioturbation, or some other catastrophic event. Re-sedimentation can be caused by strong storms or liquefaction due to seismic disturbance and these phenomena could explain the mixed dates and lack of preserved laminae.
15 Small, bright blue concretions were observed that X-ray diffraction confirmed to be the mineral vivianite (Fe2+3 (PO 4)2·8H2O). Results of X-ray diffraction analysis of 52 stratified samples collected between 58–18 m indicated a mineralogical composition consisting mostly of quartz, muscovite, albite, clinochlore, calcite, and orthoclase (details in Giudice 2005; Dickinson 2008). Vivianite was not found in samples collected below 42 m in depth (Fig. 8a) but increased in frequency of occurrence and size of structure upward, occurring most frequently in samples collected between 25 and 18 m. Vivianite was found as 2 mm fragments at lower depths and occurring as fissile nodules up to 1 cm in size in samples above 25 m.These concretions were observed surrounding or in association with some of the organic fragments (Fig. 8b), an association often recognized by others (Fagel et al. 2005).
16 Vivianite is a widespread mineral in lacustrine sediments (see samples of world occurrences in Fagel et al. 2005) and can be formed by either authigenic or diagenetic processes related to a chemical, physical, or biological change after its initial deposition. The vivianite concretions are likely related to authigenic processes as they are associated with areas of high biological productivity where organic matter was able to fall out of suspension with the fine silt and clay. Additionally, the vivianite was not associated with an oxidized layer or crust, but found only as small concretions. Deike et al. (1997) noted that vivianite is most likely to be formed just below a thick oxidized layer if related to a diagenetic formation.
 Display large image of Figure 5
 Display large image of Table 1
 Display large image of Figure 6
17 Small wood fragments were also frequently encountered above 42 m to surface. Of the 37 samples of sufficient size, nine samples were selected for 14C/13C analysis by IsoTrace Radiocarbon Laboratory (See Table 1 for yBP and calyBP results). Eight of the nine dates were found to decrease in age sequentially from 11 340 ± 210 yBP at 28 m to 110.36 ± 70 yBP at 0.71 m. A sample recovered from 22.68 m returned a date of 9600 ± 110 yBP that is older than would be expected by examination of the dates obtained from samples immediately overlying and underlying this depth (Table 1). It may be that bioturbation has resulted in older material being moved up in the sequence or, more likely, mixing and re-sedimentation due to a turbation event from some other cause. As samples for dating were collected from material in the centre of cores, it is unlikely that younger wood fragments could have been dislodged from a higher position during drilling. Nonetheless, a linear regression analysis of both raw and calibrated data gives a best fit line equal to, or better than R2 = 0.94. These results suggest that the dates, considered in toto, represent an accurate estimate of the ages of the upper 30 m of sediment at GLM-01. A tenth sample from a depth of 41 m was too small to return a date but the occurrence of wood fragments at this elevation suggests that the region was ice free much earlier than 11 000 yBP (13 000 calyBP, Table 1).
18 Further observations and additional analytical data are reported in Dickinson (2008) with a selection of tests presented in plots of value with depth of sample (Fig. 5). Granulometric analysis demonstrates the change of percent sand, silt and clay with depth and indicates higher silt and clay content for the lower half of the sediment core. Sand content increases throughout the middle portion of the core with gravel present from ~15 to 5 m depth. A unit of silt and clay occurs within the top 5 m of the core. The differences in grain size are interpreted to reflect current-deposited sand and gravel versus suspension-deposited silt and clay, although water depth and size of the water body may also affect grain size occurrence.
19 LOI is a method that has been used by others in the region to measure the organic content of sediments for the delineation of past fluctuations in climate (Levesque et al. 1993; Mayle and Cwynar 1995a). However, it is important for the lower Saint John River Valley that LOI organics, mainly pollen, may not only have come from local terrestrial sources but may also have been introduced to the system through the inundation of marine water. Therefore, using samples from a closed system as opposed to an open system like the lower Saint John River Valley would potentially allow for a more unbiased conclusion when correlating climatic conditions with LOI. High LOI is typically correlative with warm temperatures, but within GLM-01 samples, high concentrations are related to low-energy environments and low LOI concentrations are associated with major fluvial aggregation as between 15 and 4 m or proglacial environments as with samples from below 59 m (Fig. 5).
 Display large image of Figure 7
20 The percent of LOI in the samples, from bedrock to surface, fluctuates with grain size and depth (Fig. 5). The sandy sediments deeper than 60 m are characterized by the lowest percentage of organic material, commonly <2%. In material above 59 m LOI increases to between 3% and 4.7%, falling to between 2.5% to 3.5% for the silt-rich layers above 45 m. Between 15 and 6 m LOI decreases to less than 1.7% likely due to an increase in velocity of flow accompanying a change to a fluvial environment as indicated by the occurrence of gravel layers at that level (Figs. 4, 5). Above 6 m, organic content increases as does the occurrence of silt and clay deposits, likely reflecting deposition in a low- energy environment by flooding related to development of the modern lake and river system. These interpretations are supported by a strong Spearman Correlation of rs = 0.61 significant at the 99% level between LOI and clay% deposited from suspension.
21 Variation in Br and Cl concentrations are interpreted to reflect changes between dominantly freshwater and saline water conditions (Gieskes et al. 1991; Davis et al. 1998, 2000, 2001; Broster et al. 2013). Both Cl and Br demonstrate similar trends in distribution and are supported by a strong positive Spearman Correlation of r s = 0.7 significant at the 99% level. The absorption of chloride and bromide onto the surface of the clay minerals was used as a possible indication of brackish or marine water deposition (Burt 2004).
22 Davis et al. (1998, 2000, 2001) have indicated that the chemical ion ratios of chloride/bromide are especially useful as geochemical indicators in assessing marine inputs to a region. A large portion of the sediment core has low Cl/Br ratios suggesting ratios similar to those that can be generated in brackish water. The highest Cl/Br ratios were found in the lower half of the core; decreasing in concentration upward and fluctuating in value throughout the middle and upper portion of the sediment core (Fig. 5). The overall variations in Cl and Br concentrations with depth indicate initial low values increasing above 58 m to an area of highest values (i.e., Cl = 300 mg/l, Br = 2.0 mg/l) between 50–25 m and decreasing to the lowest concentrations between 20–10 m depth, with undetectable levels of Br and Cl in samples located between 16 and 9 m. The fluctuations in Br and Cl concentrations in the silt/clay unit between 58 and 20 m are likely due to dilution of the saline water by pulses of fresh meltwater from glacier melting (cf. Broster et al. 2013). Undetectable amounts of Br and Cl between 16–9 m indicate a net outflow across the area with no influx of brackish water. This change is also coincident with coarse-grained sediment and gravel suggesting higher flow velocities due to significant fluvial activity and possible erosion of upper parts of the marine/lacustrine unit. An increase in Br, Cl and Cl/Br ratio values in the upper 6 to 3 m (Fig. 5) is likely due to the initiation of modern estuarine conditions.
DISCUSSION
23 Analysis of drill logs indicates the stratigraphy can be described by six lithostratigraphic units (Fig. 4). Sandstone bedrock (unit 1) underlies the study site and is overlain by englacial and ablation till (unit 2).The till changes to interbedded sand and pebbly sand in places and is interpreted as an ice-contact/glacifluvial deposit (unit 3), most likely originating as a subaqueous outwash from melting of a glacier ice front. Till and glacifluvial sediments represent a glacial retreat sequence that grades upward into layered clayey silt at the base of a thick waterlain deposit (unit 4) informally referred to here as the marine/lacustrine unit.
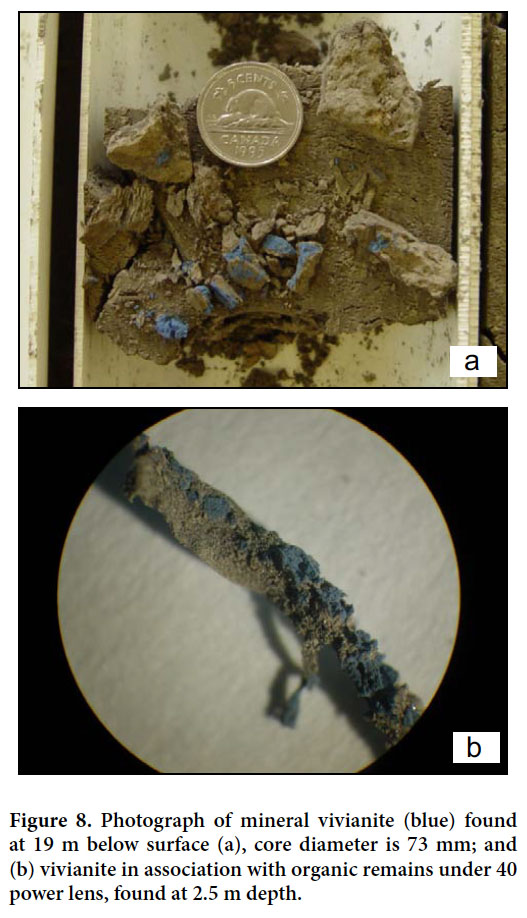 Display large image of Figure 8
24 Clay-silt sediments, exposed locally in raised terraces, were mapped by Rampton et al. (1984) as of undifferentiated marine and lacustrine origin. As well, Broster et al. (2013) drilled and sampled the clay-silt unit at Fredericton (Fig. 1) and found both attributes of lacustrine sedimentation, such as zones with distinct varve-like laminae, as well as poorly stratified zones of low-strength sediments characteristic of marine deposits. Differences and oscillations in Cl mg/l concentrations, within the marine/lacustrine unit at Fredericton were attributed to deposition in an estuarine environment, experiencing occasional dilution of brackish conditions by pulses of fresh water from melting glaciers (Broster et al. 2013).The marine/lacustrine unit sampled in GLM-01 demonstrates Cl changes similar to those found by drilling at Fredericton, except Cl concentrations here (exceeding 300 mg/l) are an order of magnitude higher than those at Fredericton. The higher concentrations are likely due to a greater marine influence at the location of the study site, being closer to the central, and likely deeper, parts of the marine/lake basin than is Fredericton, located 40 km farther up-river and possibly closer to a melting ice front.
25 The marine/lacustrine unit is interpreted to represent two phases of development of the Grand Lake area: (1) a lower part representing initial deposition in an open water marine environment, changing upward into an inland sea likely from isostatic rebound and captured marine water, and (2) water in the basin becoming increasingly fresher and lacustrine-like. Overlying units represent a fluvial phase (unit 5), which in turn is overlain by the establishment of the present lake and fluvial floodplain conditions (unit 6). The waterlain deposits of units 4, 5 and 6 represent four distinct phases of evolution of the lower Saint John River Valley and Grand Lake Meadows area including, (I) an open DeGeer Sea, (II) an inland DeGeer Sea and Lake Acadia, (III) a fluvial regime, and (IV) development of present conditions.
Phase I: open DeGeer Sea
26 The lower DeGeer portion of the marine/lacustrine unit contains nematodes, high Cl content and Cl/Br ratios characteristic of a marine or estuarine environment. Raised deltas noted by Rampton et al. (1984) and Seaman et al. (1993) indicate that the marine limit exceeded 60 m for much of southern New Brunswick and may have been as high as 80 m at deglaciation and at the time of maximum isostatic depression of some areas. As the oldest date of 11 340 ± 210 yBP (calibrated 13 220 ± 200 calyBP, Table 1) was recovered from the upper 1/3 of the marine/lacustrine unit, the lower 2/3 of the unit must be much older in age. In the upper part (Fig. 5), 12 m of sediment was deposited in approximately 3000–4000 yrs. The lower 38 m of sediment likely represents deposition over a few thousand years, even if early post-glacial deposition occurred under an initial high rate of sedimentation. Deglaciation of southern New Brunswick is thought to have started along coastal areas around 15 000 to 14 000 yBP (Rampton et al. 1984; Seaman et al. 1993; Belknap et al. 2005) with burial of the previous Saint John River outlet into the Bay of Fundy by deposition of an end moraine occurring around 13 400 yBP (Gadd 1973; Rampton et al. 1984; Nicks 1988). Deglaciation likely occurred in the Grand Lake area between 13 000 yBP and 14 000 yBP with capture of inundated marine water occurring between 13 500 yBP and 12 000 yBP coincident with timing of maximum isostatic rebound in Maine (Belknap et al. 2005). Although not exactly synchronous events, the early open DeGeer Sea, which covered much of south-central New Brunswick, may be correlative with the Goldthwait Sea marine incursion that affected areas of the St. Lawrence Lowland (~12 000–11 000 yBP, Gadd 1988) and western Newfoundland (Elson 1969).
Phase II: inland DeGeer Sea and development of Lake Acadia
27 The upper part of the marine/lacustrine sediments (unit 4) records the transformation of the brackish inland DeGeer Sea into the freshwater Lake Acadia. Isostatic rebound is thought to have lifted the Grand Lake area in the manner proposed by Bloom (1963) and Barnhardt et al. (1995) for areas of Maine. The transformation occurred gradually and is mainly demonstrated through changes in Br and Cl concentrations and the abundance of wood fragments. Bromide and Cl and Cl/Br Ratios demonstrate an oscillating, up-core decrease in concentrations above 45 m (Fig. 5) likely representing dilution of the captured brackish water by pulses of freshwater. If the supply of marine water into the area remained open, then corresponding elements and ratios would be expected to maintain more uniform concentrations with periodic fluctuations depending on nearness to source and volume of occasional contributions of freshwater runoff. An overall decline in Br and Cl content in the sediments above 45 m suggests that no new supply of saline water occurred in the unit after deposition of sediment at this elevation, until recently (Fig. 5). Burial of the previous Saint John River outlet by construction of an end moraine (~13 400 yBP) and isostatic rebound of the Grand Lake area likely contributed to isolation of the saline DeGeer Sea and subsequent development of a stratified lake with local freshwater overlying brackish water. Isostatic rebound is estimated to have occurred between 13 500 yBP and 12 000 yBP (Belknap et al. 2005).
28 In GLM-01, wood fragments increase in frequency and size of occurrence in sediment above 42 m, indicative of increased terrestrial vegetation in the catchment area. An AMS date extracted from a fragment of wood collected at 28 m, suggests that the Grand Lake Meadows region was ice free prior to 11 340 yBP (~13 000 calyBP, Table 1). The woody interval spans the Younger Dryas cooling event in the region (~11 000 to 10 000 yBP; Mayle and Cwynar 1995b) and although growth of ice masses is known to have occurred in some areas (Rampton, et al. 1984; Seaman et al. 1993; Seaman 2006), LOI% between 53–16 m implies that the Grand Lake area remained ice free. From ~53 to 16 m LOI% is fairly consistent with a slight decrease to 2.2% at 26 m depth (Fig.5) that may represent slightly lower organic production during the Younger Dryas. However, quantities of approximately 2–3% organic matter (LOI% Fig. 5) indicate that a glacier re-advance across the study area was unlikely to have occurred. Kite and Stuckenrath (1989) determined that ice was present in the upper Saint John River Valley until 10 000 yBP and the oscillations in Cl and Br concentrations and Cl/Br ratios indicate that ice masses may have occupied higher elevations within the headwaters and southern highlands and contributed meltwater to the area until as recently as 8000 yBP.
Phase III: fluvial phase
29 The upper part of the marine/lacustrine unit, ~19 m to 16 m, records major changes in Br, Cl, LOI, and grain size suggesting that the former lacustrine environment was changing to a fluvial-dominated environment. AMS dates extracted from wood fragments from core depths of 19.81 m and 16.59 m indicate uncorrected dates of 7820 ± 90 yBP and 7770 ± 80 yBP, respectively. Between 11 000 yBP and 7000 yBP sea-level in the Bay of Fundy, and thus local river base levels, were >20 m below present msl (Fader et al. 1977; Shaw et al. 2002; Belknap et al. 2005; Legere 2012). But at approximately 8000 yBP major changes occurred to the drainage of the Saint John River and Grand Lake.
30 At a depth of 19 m below surface the Cl/Br ratio decreases substantially and to zero concentration in samples collected between 8.6–3 m. In samples above 15 m, LOI decreases to between 1% and 2%, sand increases to >90% (Fig. 5) and layers of medium- to well-sorted fine gravel were found with clasts >2 mm in diameter. The sediments indicate a fluvial environment with increased flow energy. Kite and Stuckenrath (1986, 1989) suggested that at around 8000 yBP the Madawaska River changed direction and drained southward into the Saint John River, increasing river flow south of Grand Falls, located about 200 km upstream of Fredericton (Fig. 1). A major climate event with temperatures warmer than today and increased moisture locally (Rampton et al. 1984), occurred during the Hypsithermal period between ~8000 yBP and 3500 yBP (Davis et al. 1980), with a thermal maximum proposed for ~6500 yBP (Bradstreet and Davis 1975).
31 The variation in grain size in GLM-01 sediment between ~16 m and 6 m are indicative of a change to a fluvial environment. These changes are interpreted to be due to activity by flowing water likely associated with the formation of a new river outlet developed from down- cutting of the Reversing Falls at Saint John and drainage into the Bay of Fundy. Down-cutting of the outlet began to significantly affect the area by ~8000 yBP and continues to present day. With this new outlet the size and volume of Grand Lake decreased to modern levels. While the volume of water drained would likely increase with increased erosion of the outlet, onset of modern estuarian conditions can be determined from AMS dates and return of saline water to the area. AMS dates from wood collected at 10.21 m and 6.02 m depth, returned dates of 3820 ± 60 yBP and 3080 ± 70 yBP, respectively. This is consistent with Belknap et al. (2005) who indicate that prior to 3000 yBP, the Bay of Fundy did not rise to a level that would have facilitated breaching of the present barrier at the Reversing Falls, enabling saline water to flow up-river.
Phase IV: development of modern conditions
32 From ~6 m core depth to the surface, fluvial sediments are overlain by silt and clay laminae suggestive of deposition from suspension associated with flooding of the floodplain or lacustrine deposition since ~3000 yBP. The decrease in grain size in this interval is also accompanied by an increase in LOI%, and Br and Cl concentrations (Fig. 5). The increase in Br and Cl content is interpreted to represent breaching of the area by saline water after a return to estuarine conditions. The study site is an aggrading bar of the estuarine Saint John River that closed off the bottom of Grand Lake relatively recently in geological time. Its construction has contributed substantially to reducing brackish water input from the estuary.
CONCLUSIONS
33 The Grand Lake area has experienced four significant periods of change since the Late Wisconsinan Glaciation as follows, using a calibrated time scale:
- Phase I occurred more than 15 000 ya and represents deglaciation in a proglacial marine environment and formation of the DeGeer Sea by a marine incursion that occupied isostatically depressed portions of southeastern New Brunswick.
- Phase II, between ~14 000 and 8000 calyBP, accompanied the end of the major isostatic readjustment through the region, and the development of an inland sea and its transformation into the predominantly freshwater Lake Acadia. Vegetation reclaimed the area as temperatures increased and remnant ice masses slowly disappeared from the headwaters of tributaries to the Saint John River.
- Phase III occurred between ~8500 to 3000 calyBP. Sediments in this interval indicate major draining of the extended Lake Acadia and return of the lower Saint John River Valley to a fluvial-dominated system, likely initiating the beginning of the modern Grand Lake Meadows complex. This phase is associated with the down-cutting of the Reversing Falls gorge, capture of new tributaries, abandonment of raised terraces and construction of new alluvial landforms along the Saint John River.
- Phase IV began after ~3000 calyBP and denotes the establishment of estuarine conditions in the Saint John River and an increase in brackish water to the area from breaching of the Reversing Falls gorge by marine water from rising sea level and higher tides in the Bay of Fundy.
34 From analyses of the sedimentary record in GLM- 01 it is clear that glaciers did not re-occupy the area after 13 000 calyBP (including the Younger Dryas cooling event). Occurrence of wood fragments in the upper half of unit 4 (waterlain suspension deposits) indicates that the area was likely vegetated prior to 13 000 calyBP. Flora and fauna adapted to local conditions even though original Cl content within the DeGeer Sea Phase, exceeded 300 mg/l. The modern Grand Lakes Meadows complex has existed for less than 3000 years and has contributed to preservation of Grand Lake as a freshwater resource.
35 The data examined here indicates that brackish water has occupied the area for approximately fourteen millennia and that the present supply of potable water may not be a sustainable resource. While Grand Lake and local estuaries have become less brackish over the last 8000 years, these freshwater resources should be considered as finite and susceptible to salinization from climate change and anthropogenic over-extraction. Sea level is predicted to rise with future climate warming, thus increasing saline intrusion from an accompanying rise in the saline groundwater table and from higher tides and further upriver migration of brackish water along estuaries. If local surface and groundwater extraction remains unchecked, brackish water may be drawn up from pockets of relict (glacial-age) saline-rich water in some areas (Giudice and Broster 2006) or from stratified lake and groundwater sources containing brackish water at depth. While the human taste-threshold for chlorine in water is between 200 mg/l and 300 mg/l depending upon associated cations (Health Canada 1996), some fauna and flora demonstrate a greater sensitivity to Chlorine. A program to identify and monitor areas were potable water resources could be threatened should be identified is a priority for research and litigation.
The authors are indebted to Maritime Road Development Corporation for providing drilling information for the study site. Funding for this project was provided in part by the New Brunswick Department of Environment and Local Government Environmental Trust Fund and Sciences and Reporting Branch, Grand Lake Meadows Trust Fund, New Brunswick Geological Survey and the New Brunswick Museum. The work formed part of a UNB Ph.D. thesis by P. Dickinson. The authors are grateful to A. Daigle and G.M. (née Giudice) Burtt, and S. Boonsue for engineering and geochemical analyses and to Dr. R.K. Pickerill for ichnological identifications. The finished manuscript has benefited from reviews by D. Belknap and C. Nixon.