A petrochemical study of basaltic layering at Henley Harbour, Labrador, using multidimensional scaling
John D. GreenoughDepartment of Earth and Environmental Sciences, Okanagan University College,3333 College Way, Kelowna, BC V1V 1V7, Canada
jdgreeno_AT_ouc.bc.ca
J. Victor Owen
Department of Geology, Saint Mary's University, Halifax, NS B3H 3C3, Canada
victor.owen_AT_stmarys.ca
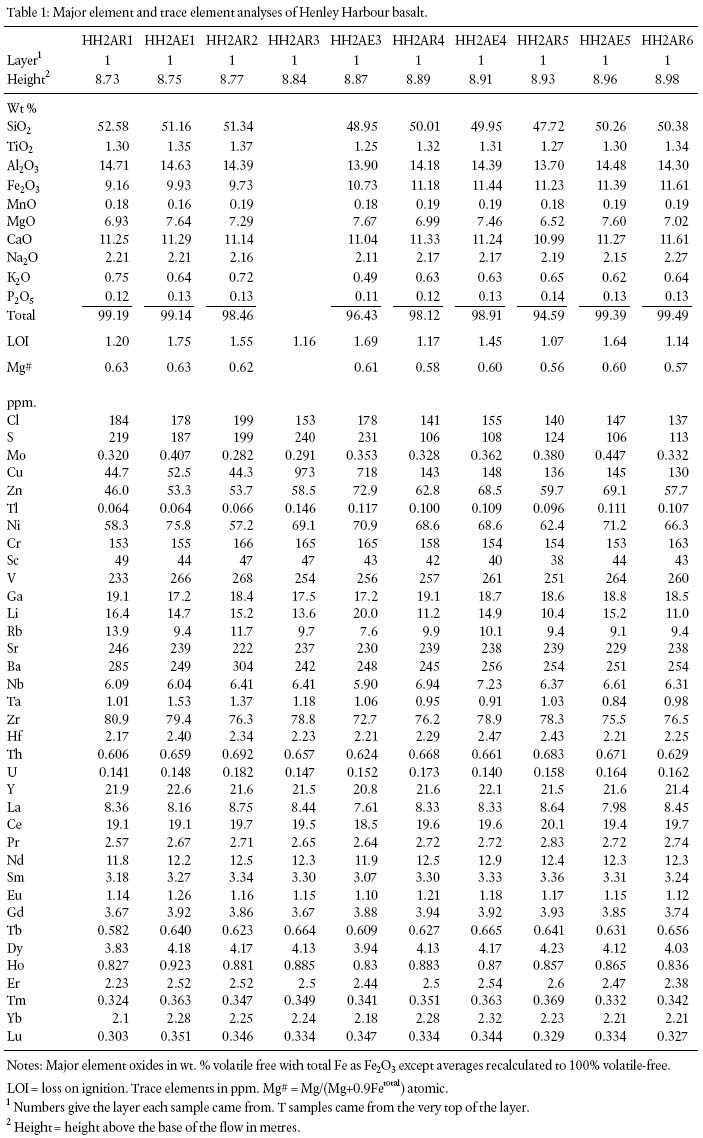
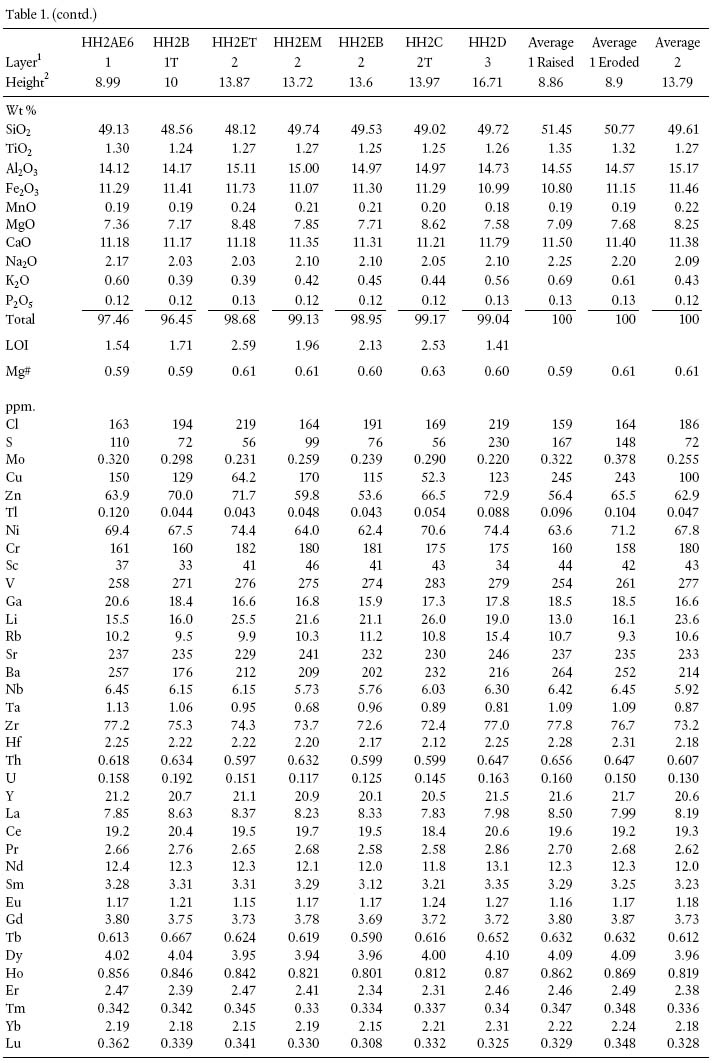
Date received: October 3o, 2002 ¶ Date accepted: May 22, 03
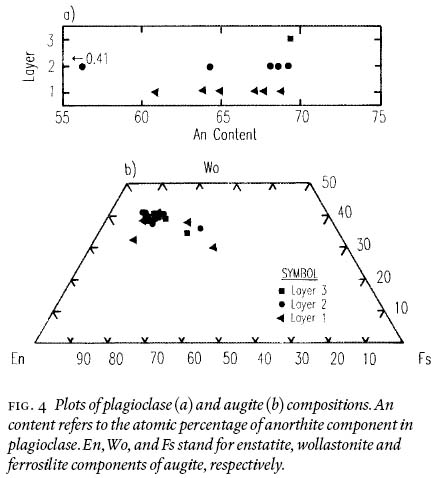
ABSTRACT
Lack of internal textural evidence for flow tops and small chemical variability among late Proterozoic basalt samples suggest the presence of a single flow at Henley Harbour, Labrador, Canada, despite spectacular, m-scale layering in outcrop. Total chemical variation just slightly exceeds analytical uncertainty for many elements. Multidimensional scaling (MDS) enhances "effective" analytical precision by allowing all data (elements and samples) to be compared simultaneously. Scaling of elements reveals element associations/patterns consistent with igneous controls on distribution, even for alteration-sensitive (Na, K, Sr) elements. MDS also shows that the m-scale layering has a chemical fingerprint. However, to explain chemical variability between layers using mass balance calculations and averaged whole-rock data requires unreasonable (low temperature) phenocryst compositions. Textural features of the m-scale layering record changes in cooling regime between the bottom and center of the flow but chemical variation may reflect changing magma compositions during formation of an inflated flow. However, mass balance calculations suggest that large-scale chemical variation reflects the migration of residual liquid, perhaps as vesicle plumes, within an initially chemically homogeneous flow. Low in the flow (layer 1), metres-long but cm-scale raised and eroded subhorizontal "bands" superficially resemble segregation veins but lack coarse-grained textures. MDS confirms that raised and eroded samples are chemically distinct. Mass balance indicates that banding is not related to phenocryst percentages but may reflect the abundance of a residual liquid resembling the liquid explaining compositional variation between large-scale layers. Alignment of microlites and variations in the quantity of altered residual-liquid glass suggest that banding is related to magma movement during extrusion. It is possible that banding of this type has not been recognized before.RESUMÉ
L'absence d'attestation texturale interne des sommets d'écoulement et la faible variabilité chimique entre les échantillons de basalte du Protérozoïque tardif laissent supposer la présence d'un écoulement unique à Henley Harbour, Labrador, Canada, malgré la stratification spectaculaire à moyenne échelle de l'affleurement. La variation totale des compositions chimiques dépasse tout juste légèrement l'incertitude analytique de nombreux éléments. L'analyse multidimensionnelle (AMD) améliore la précision analytique « effective » en permettant une comparaison simultanée de toutes les données (éléments et échantillons). L'analyse des éléments révèle des associations/dispositions d'éléments correspondant à des contrôles ignés de la répartition, même dans le cas des éléments sensibles à l'altération (Na, K, Sr). L'AMD révèle par ailleurs que la stratification à moyenne échelle présente une empreinte chimique. L'explication de la variabilité chimique entre les couches au moyen de calculs du bilan pondéral et de moyennes des données sur la roche totale nécessite cependant des compositions de phénocristaux excessives (basse température). Les caractéristiques texturales du fil de stratification à moyenne échelle changent en régime de refroidissement entre le fond et le centre de l'écoulement, mais la variation des compositions chimiques peut correspondre à des compositions magmatiques changeantes pendant la formation d'un écoulement gonflé. Les calculs du bilan pondéral laissent toutefois supposer que la variation des compositions chimiques à grande échelle témoigne de la migration de liquides résiduels, peut-être sous forme de panaches de vacuoles à l'intérieur d'un écoulement initialement homogène du point de vue chimique. Au bas de l'écoulement (première strate), des « bandes » subhorizontales de plusieurs mètres de longueur mais érodées et soulevées de quelques centimètres ressemblent superficiellement à des filons d'exsudation mais sont dépourvues de textures à grain grossier. L'AMD confirme que les échantillons soulevés et erodes sont chimiquement distincts. Le bilan pondéral révèle que le rubanement n'est pas lié au pourcentage de phénocristaux, mais qu'il témoigne de l'abondance d'un liquide résiduel ressemblant au liquide expliquant la variation des compositions entre les strates à grande échelle. L'alignement des microlites et les variations de la quantité de verre soluble résiduel altéré laissent supposer que le rubanement est apparenté à un déplacement magmatique survenu pendant l'extrusion. Il est possible qu'on n'ait pas décelé un rubanement de ce genre auparavant.INTRODUCTION
1 The flat-topped basaltic cliffs rising above Henley Harbour, Labrador, have international historical significance as navigational aids (Owen and Greenough 2000). Igneous layering that created the cliffs has been ascribed to extrusion of two or more lava flows representing the surface expression of Late Proterozoic intrusive activity that formed the Long Range dykes (e.g., Strong and Williams 1972; Strong 1974). Our examination of the cliffs suggested the presence of a single lava flow that could lead to a better understanding of the thermal and chemical processes that produce layering in many individual basaltic flows.
2 Although apparently common, layering in individual basaltic flows does not tend to be reported by geologists. The subtle or inconspicuous variations in texture give little indication of the potentially large variations in chemical composition between layers (Goff 1996; Rogan et al. 1996; Caroff et al. 1997; Greenough et al. 1999). Even when reported, layering is likely to be ascribed to multiple extrusions as opposed to cognate processes. An understanding of the physical and chemical processes responsible for layering in lava flows is fundamental due to the information accruing from their rapid cooling regime (Greenough and Dostal 1992; Goff 1996). Processes responsible for layering and chemical variation in lava flows must be processes that act quickly. In contrast, the slow cooling regime of intrusions allows late (slow-acting) processes to overprint and obscure the effects of early, high-temperature, fast-acting processes. However, the study of layering in basaltic lava flows is in its infancy and so it is not surprising that the layering described in this paper has perhaps never before been reported in the literature. Although texturally conspicuous, we use the power of multidimensional scaling to demonstrate that small-scale layering in the basalt at Henley Harbour displays a subtle chemical fingerprint. Similar techniques also show that large-scale layering is probably not reflective of multiple extrusion.
GEOLOGY AND SAMPLING INFORMATION
3 Plateau basalts of western Newfoundland and southern Labrador, including those at Henley Harbour (Fig. 1), belong to the Late Proterozoic Lighthouse Cove Formation. They are associated spatially and chemically with the Long Range Dyke swarm which cuts gneiss and granitoid rocks of the Long Range inlier in western Newfoundland (Owen 1987) and equivalent Grenvillian rocks in southern Labrador (Strong and Williams 1972; Strong 1974). Both the dykes (Owen et al. 1989; Greenough and Owen 1992) and "plateau lavas" have tholeiitic continental flood basalt compositions (Strong and Williams 1972; Strong 1974). Stukas and Reynolds (1974) dated the dykes by 40Ar/39Ar methods at 605 Ma. A precise U-Pb zircon and baddeleyite date gave 615 ± 2 Ma (Kamo et al. 1989). The geochemistry and age of the rocks suggest that they are related to continental rifting and opening of the proto-Atlantic (Iapetus) Ocean (Strong and Williams 1972; Strong 1974; Kamo et al. 1989). More recently Puffer (2002) pointed out that the plateau basalts are the most northerly products of a Late Neoproterozoic superplume centered on Sutton Mountain (Quebec) that also yielded basalts as far south as Virginia. Of importance to this study, the rocks at Henley Harbour escaped significant Paleozoic deformation because they lie just west of the "western limit of Appalachian deformation" on the tectonolithofacies map of Williams (1979).
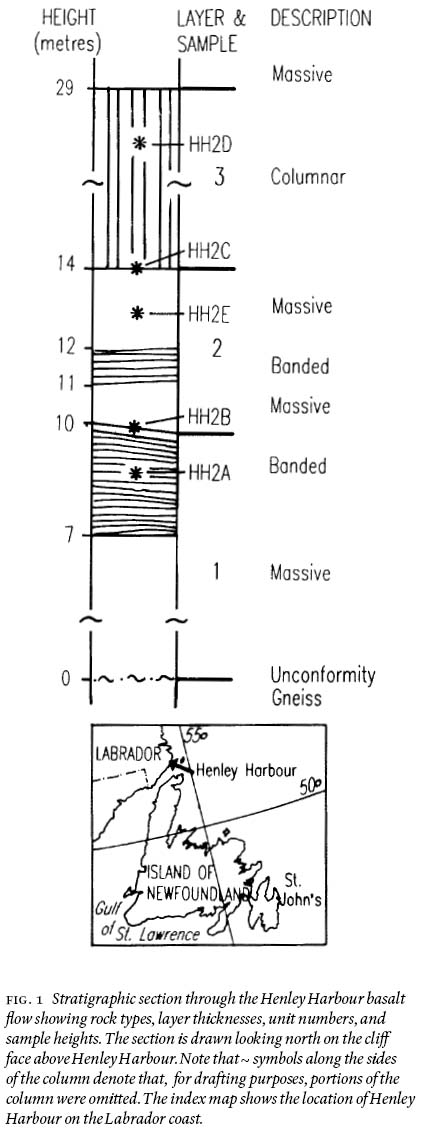
4 Fig. 1 shows the stratigraphy of the accessible portion of the flow on the north shore of Henley Harbour where our samples were colleted. The flow rests unconformably on gneissic rocks. Large-scale (m-scale) layering is apparent from hundreds of metres away, with at least three distinct layers defined by major subhorizontal joints, and traceable across the entire > 100 m wide cliff face (Fig. 2a). Fine-grained, massive, basalt occurs for ~ 7 m above the unconformity. The upper three metres of this ~10 m thick (but variable) lower unit contains basalt with raised (resistant) and indented (eroded) bands laterally traceable for 10's of m. The bands resemble bedding (Fig. 2b). Eroded bands appear thinner than raised bands in the field (Fig. 2b) but laboratory slabs through samples show that both average about 1.5 cm thick. A major subhorizontal "joint" at 10 m separates the lower unit from a second massive unit (~4—5 m thick; Fig. 2b) which thins to the west and shows cm-scale banding ~1 m above its base that resembles banding at the top of layer 1. Another major subhorizontal joint at ~ 14 m marks the beginning of massive basalt ~15 m thick with well developed columnar (vertical) jointing. The upper portions of this unit were inaccessible (Fig. 2a). In the field it is not obvious what the jointing "breaks" between layers 1, 2 and 3 represent, but vesicular layers, irregular (brecciated) surfaces, or quenched basalt indicative of flow tops were not observed. Table 1 contains the height of samples collected to determine the origin of banding, and chemical and genetic relationships between major layers.
Fig. 1 Stratigraphic section through the Henley Harbour basaltfl ow showing rock types, layer thicknesses, unit numbers, and sample heights. The section is drawn looking north on the cliff face above Henley Harbour. Note that ~ symbols along the sidesof the column denote that, for drafting purposes, portions of the column were omitted. The index map shows the location of Henley Harbour on the Labrador coast.ANALYTICAL METHODS
5 Mineral compositions were determined using a JEOL Superprobe 733 with four wavelength dispersive spectrometers and an Oxford Link eXL energy dispersive system at the Department of Earth Sciences, Dalhousie University. All elements were detected using the energy dispersive system with a resolution of 137 eV at 5.9 KeV. Each spectrum was acquired for 40 seconds with an accelerating voltage of 15 keV and a beam current of 15nA. Probe spot size was approximately one micron. The raw data were reduced using Link's ZAF corrections. Precision and accuracy (± 2 %) were monitored with geological and synthetic reference materials.
6 For whole-rock analysis, weathered or altered surfaces were removed from samples prior to crushing and powdering in a tungsten-carbide mill. The major elements were determined by X-ray fluorescence (XRF) on fused glass pellets at Memorial University of Newfoundland. Therefore, the totals in Table 1 reflect volatile-free analyses. Precision and accuracy are ± 2% or better for most samples, although glasses for a few samples cracked repeatedly (up to 7 attempts at fusion) for unknown reasons, resulting in low totals. Trace elements determined by XRF on pressed powder pel-lets following Longerich (1995) were run with geological reference materials indicating precision and accuracy better than ± 5% for Cl, S, Cu, Zn, Ni, Cr, V, Ga, and Nb and ± 12% for Sc. Lithium, Rb, Sr, Ba, Ta, Hf, Zr, Th, U, Y, the rare earth elements (REE), Mo, and Tl were determined using a HF/HNO3 digestion procedure on 0.1 g of sample with solutions analyzed by Inductively Coupled Plasma-Mass Spectrometry (ICP-MS; Jenner et al. 1990). In-run reference materials indicate precision and accuracy better than 5% for all elements except Li and Tl (7%), U (12%) and Mo (18%).
PETROGRAPHY, MINERALOGY, AND SAMPLE DESCRIPTIONS
7 The samples, which are all very similar, contain augite (d 5mm, ~Wo40, En50) and plagioclase (d 4.5mm, d An69) phenocrysts and glomerocrysts (d 2 mm) together comprising less than 5% of the rock (Fig. 3a, 3b & 4). Very fine-grained groundmass phases comprise most of each rock and include augite (~ 0.04 mm), plagioclase (d 0.10 mm), and Fe-Ti oxides (d 0.1 mm) with modal percentages of 41%, 49%, and 4%, respectively, in least-altered samples. High width/length (w/l) ratios for plagioclase phenocrysts distinguish HH2C, D, and E samples (w/l = 0.3) from HH2A and B samples (w/l = 0.1). With the exception of 0.02 mm wide unaltered rims, plagioclase phenocrysts in HH2C, D, and E tend to be sericitised (Fig. 3b). Both eroded and raised "banded" samples (HH2A) show an alignment of feldspar laths (microphenocrysts) parallel to bands (Fig. 3a). The only difference between raised versus eroded bands in HH2A is that very fine-grained alteration minerals (clay minerals?) are olive green to brown in the former (7 modal %) and forest green in the latter bands (16%). The olive green mineral represents the dominant alteration mineral (d 7%) in HH2C, D, and E.
Fig. 2 Photographs of layering in the Henley Harbour fl ow. a) Columnar jointed basalt of layer 3 is shown below unsampled (inaccessible) massive to columnar jointed basalt higher in the cliff with a sharp boundary between the two in the middle of the photograph. b) Photograph showing the sharp, jointed(?), boundary between banded rocks at the top of layer 1 and the base of more massive basalt of layer 2. Banding in layer 1 (lower portion of photograph) is expressed as sub-parallel, cm-scale, raised and eroded layers.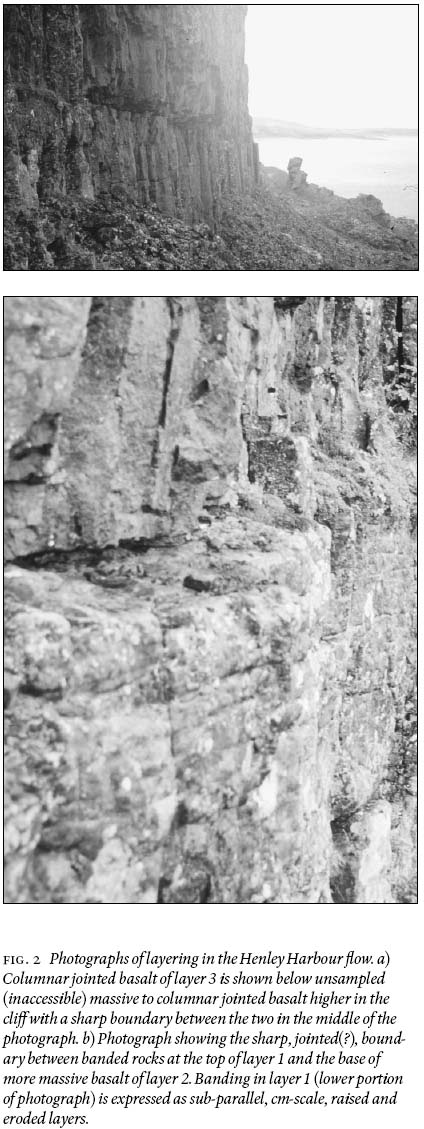
Display large image of Figure 2
WHOLE-ROCK DATA
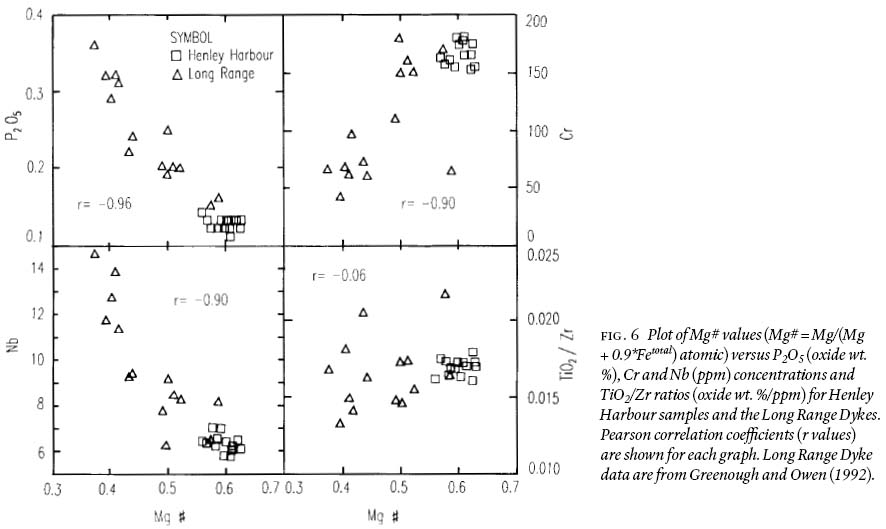
8 Loss on ignition values (LOI, Table 1) range from ~ 1.1 to 2.6 wt. % and show a positive correlation with a number of elements (e.g., MgO, Na2O, Zr; Fig. 5). CIPW norms contain hypersthene (rocks are subalkaline; assuming Fe2O3/FeO = 0.18; Irvine and Baragar 1971) which is consistent with tholeiitic Nb/Y ratios of ~ 0.3 and TiO2 concentrations (~ 1.3 wt. %) within the range of continental tholeiite (Pearce and Cann 1973). Henley Harbour element concentrations plot at the high Mg# (= Mg/(Mg + 0.9*Fetotal) atomic) end of trend lines for the Long Range dykes on variation diagrams, and element ratios such as TiO2/Zr are very similar in both groups of rocks (Fig. 6). Total chemical variation within the flow is small in comparison with variation between the Long Range Dykes (Fig. 6). Trend lines are apparent for some elements on variation diagrams (e.g., Y), but for other elements they are only poorly defined (e.g., TiO2; Fig. 7). Further, samples that were obviously distinguishable in the field (e.g., Layer 1 Eroded and Raised samples) do not appear chemically distinguishable (Fig. 7).
STATISTICAL METHODS
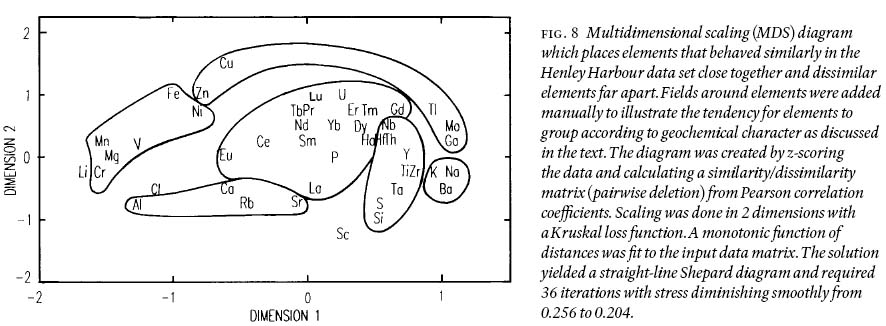
9 As elaborated on in the Discussion, the possibility of alteration effects on the geochemistry, and the limited range of chemical variability among samples complicates the interpretation of the data set in terms of igneous processes. One potential way to overcome these problems is to look for data patterns using all analytical data simultaneously. Multidimensional scaling (MDS) is an exploratory statistical technique with an ability to represent measurements of similarity (or dissimilarity) between "objects" in a small number of dimensions (Borg and Groenen 1997, pp. 1—14). It is a method well known to social scientists (ibid.) but we have discovered that it is also remarkably efficient at uncovering patterns in large geochemical data sets. For example, it can be used to illustrate overall geochemical similarities and differences between chemical elements in a two-dimensional space using all data (Table 1) from all samples (Fig. 8). Elements that behave in a similar way (i.e. when one element increases in a sample, an element behaving similarly would also increase) plot close together on the MDS diagram, whereas chemically dissimilar elements fall far apart (Fig. 8). Data processing used SYSTAT statistical software (Wilkinson et al. 1992, pp. 109—131). Distances between elements were determined from a matrix of Pearson correlation coefficients calculated for all possible element pairs (e.g., Rb:Zr) using standardized data (all elements were put on the same scale using z-scoring). Manually added fields in Fig. 8 bear no calculated statistical significance but emphasize that elements with known geochemical similarities occur close to one another. For example, the REE plot together and close to a second group that includes most high-field-strength elements (Nb, Zr etc.; Fig. 8). Other calculation and processing details appear in the caption for Fig. 8.
Fig. 5 Plot of LOI (loss on ignition) versus selected major element oxides (MgO and Na2O in wt. %) and trace elements (Zr and Cl in ppm). Pearson correlation coeffi cients, r, are shown for each plot along with the + and — 1 s error bars on the data.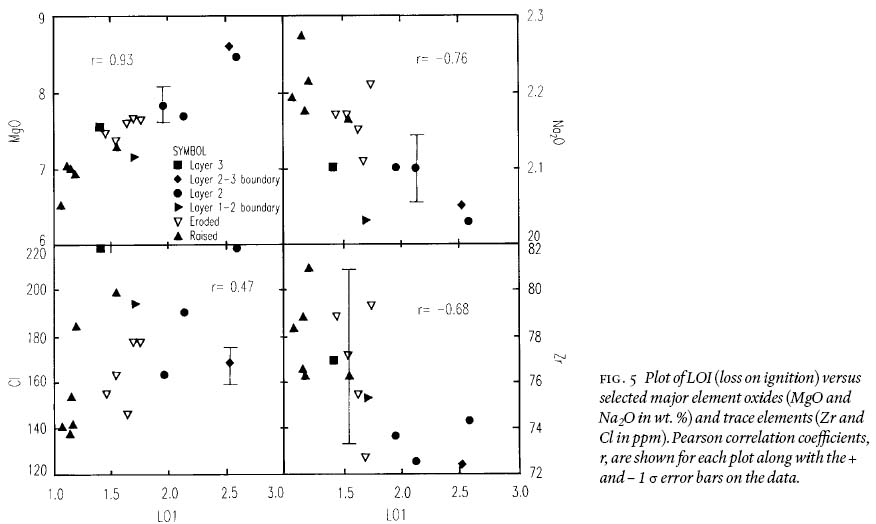
Display large image of Figure 5
Display large image of Figure 6
Table 1: Major element and trace element analyses of Henley Harbour basalt.
Display large image of Table 1
Table 1 (cond.)
Display large image of Table 2
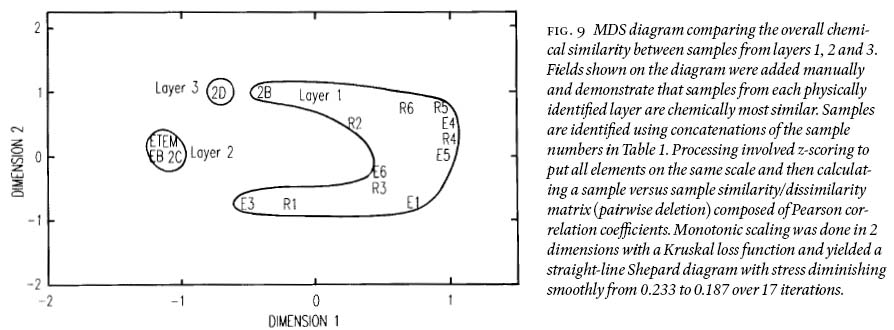
10 Multidimensional scaling can also be used to examine relationships between samples (Fig. 9). As for Fig. 8, all elements in the data set were put on the same scale using z-scoring, but in this case the data matrix was then inverted and concentrations in each sample compared to the concentrations in other samples creating a sample-versus-sample matrix of Pearson correlation coefficients. Details of the calculations appear in the caption for Fig. 9. Manually added fields show that Layer 1 samples are apparently chemically distinct from layer 2 samples. The layer 3 sample (Fig. 1) is intermediate between layer 1 and layer 2 samples but most similar to layer 1. Data were also processed in other ways to confirm that these conclusions are not dependent on the type of similarity/dissimilarity measure utilized (e.g., Euclidean distances versus the Pearson correlation coefficients used) or the MDS calculation procedure (e.g., Kruskal versus Guttman loss function; monotonic versus linear distance function). Large-scale physical/textural layering in the flow clearly has a chemical signature (Fig. 9).
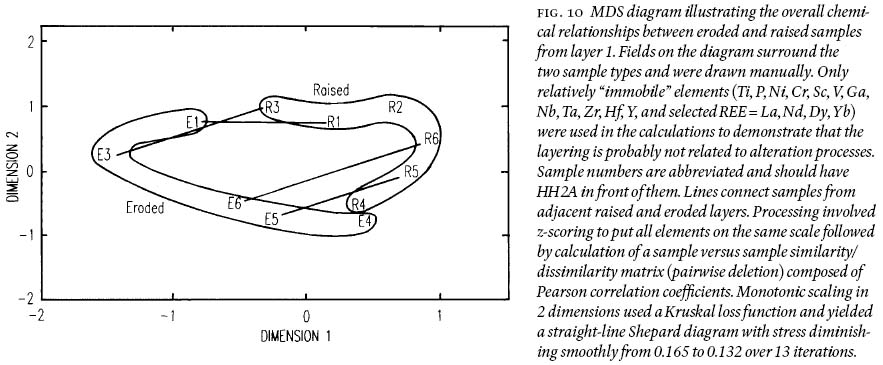
11 Fig. 10 uses multidimensional scaling to examine relationships between a subset of samples, the "banded" samples from layer 1. To ensure that uncovered patterns are not due to alteration effects, a subset of elements known to be "immobile" during low-grade metamorphism (Ti, P, Ni, Cr, Sc, V, Ga, Nb, Ta, Zr, Hf, Y, and selected REE = La, Nd, Dy, Yb) was used in processing. In other respects the calculation procedures were the same as for Fig. 9. Manually added fields show that eroded samples are distinct from raised samples. Further, lines connecting contiguous raised and eroded samples demonstrate that there is "pairing" between spatially associated layers (Fig. 10). Thus Dimension 1 in the diagram separates samples according to whether they are raised or lowered whereas Dimension 2 gives a measure of how close samples were to one another in the stratigraphy. Note that the use of all elements instead of just "immobile" elements yields an analogous MDS diagram.
Fig. 7. Plot of Zr concentrations (ppm) versus selected major element oxides (wt. %) and trace elements (ppm) with a variety of geochemical characteristics. Data on the graphs have Pearson correlation coeffi cients (r values) as shown. The two lower graphs provide examples of the + and — 1 s error bars on data. See text for discussion.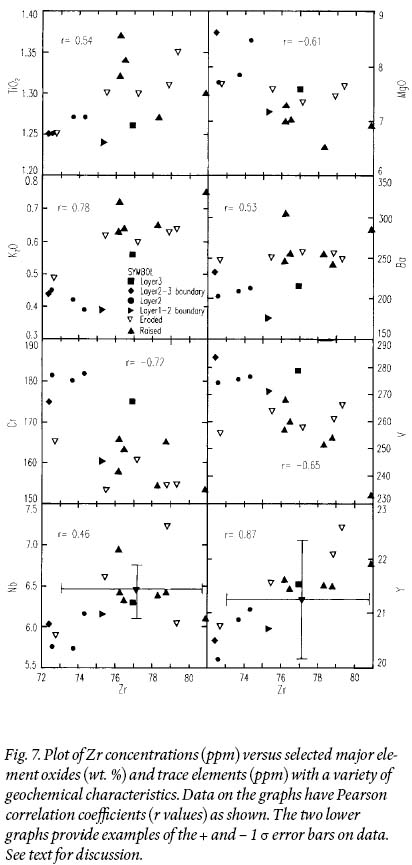
Display large image of Figure 7
Display large image of Figure 8
DISCUSSION
Alteration
12 High percentages of igneous plagioclase and augite in all samples attest to excellent preservation for Late Proterozoic rocks. Similarly, LOI values are low (Table 1). However, MgO and LOI show the strongest correlation of any analyses in the data set with a correlation coefficient (r) of 0.93. This correlation may reflect the greater probability of chlorite formation (and water addition) in high MgO samples. This process also explains other correlations with LOI. For example, the moderately strong Zr-LOI correlation (r = —0.68) is inconsistent with the randomizing effect of alteration processes and the immobile nature of Zr. In fact, most correlations between elements (Fig. 7), though weak, suggest igneous controls on data patterns. Nevertheless, it is not possible to prove using this approach that secondary processes have not affected some element concentrations (e.g., Cl) in the basalt.
13 The problem with interpreting chemical differences among these samples is that total concentration variations for many elements approach the limits for analytical uncertainty as shown by the + and — 1 s error bars on Fig. 5 and Fig. 7. For example, the total range in Zr concentrations is 72.6 to 80.9 ppm with a median value of 76.8 (Fig. 7; Table 1). If analytical uncertainty is as poor as ± 5%, the 1 s error bars around the median represent 93% of the total range of values observed. To help interpret chemical variation within the flow in terms of either primary or secondary processes some method of filtering out analytical uncertainty is required. The discussion below suggests that multidimensional scaling may be extremely useful.
14 Fig. 8 shows relationships between all elements in all samples using multidimensional scaling techniques. Manually added fields illustrate that the REE plot together and close to a second group that includes most high-field-strength elements (Nb, Zr etc.; Fig. 8). Elements associated with the ferromagnesian minerals also occur together. Those elements controlled by feldspars form two separate groups. The association of Ca, Sr and Al makes sense because high Ca concentrations in plagioclase are accompanied by elevated Al concentrations effecting charge balance. Strontium partitioning coefficients tend to be greater than unity in plagioclase (Philpotts, J.A., and Schnetzler 1970). These elements plot close to the relatively immobile element Eu, which in the 2+ state can partition into plagioclase (Drake and Weill 1975). Sodium (K and Ba) are separated from the first feldspar-related group because as Ca goes up Na goes down in plagioclase. Similarly, mass balance dictates that samples slightly enriched in Ca-rich plagioclase phenocrysts would be depleted in Na, K, and Ba due to displacement of residual liquid by the phenocrysts. Samples slightly enriched in residual liquid would be enriched in these elements which tend to be incorporated in late-forming feldspars. Although Rb plots with elements associated with feldspars, it would be more reasonable to see it with the alkali metals, Na and K. The anomalous locations of Li and Sc could reflect lower analytical precision for these elements than most others. In summary, with the exception of a few elements (Li, Rb, Cl, S, and Sc) most chemical data in Fig. 8 associate as would be predicted for the minerals in unaltered basaltic rocks. Natural chemical systems that have been disturbed by human activities (Mallory-Greenough et al. 1998) or the randomizing (disequilibrium) effects of partial alteration would not be expected to show such regular behaviour of elements on the MDS diagram.
Relationships between layering and chemical variation
15 Henley Harbour geochemical data plot at the high Mg# end of variation diagram trend lines for the Long Range Dykes (Fig. 6). This observation is consistent with the conclusions of Strong and Williams (1972) and Strong (1974) that the basalts are extrusive equivalents of the dykes. They are primitive (higher Mg# and Cr as well as lower incompatible element concentrations) compared to the dykes and exhibit an extremely limited range of compositions. More chemical variation occurs across an individual Long Range Dyke than in all basalt samples from Henley Harbour. For example TiO2 ranges from 1.2 to 1.4 wt. % at Henley Harbour, but concentrations in dyke 622 vary between 2.8 and 3.5 wt. % (Table 1 in Greenough and Owen 1992). This observation suggests, but certainly does not prove, that a single flow exists at Henley Harbour.
16 The chemical argument for a single flow is supported by field information. Although the basalt is clearly "layered" (Fig. 1), there is no evidence for variations in vesicle percentages, grain size differences, oxidation, or surface irregularities between units that might indicate a flow top in the studied portion of the flow (Fig. 1).
17 Are there chemical variations at Henley Harbour that reflect the layering observed in outcrop? Multidimensional scaling confirms that the subtle chemical variations portrayed in Fig. 7 are associated with overall chemical variations within the flow (Fig. 9) and that the large-scale (m-scale) layers observed in the field have distinct chemical signatures. Chemical variations among eroded and raised bands are even more subtle than between the large-scale layers (Fig. 7) and it is not clear from Table 1 whether they have chemical significance or simply textural significance. The band-parallel fabric exhibited by feldspar microphenocrysts and the observation that eroded and raised bands are traceable for metres across the outcrop face strongly suggests that these features are not related to alteration processes. The MDS plot for the fine-scale banded samples alone demonstrates that raised layers are distinct from eroded layers (Fig. 10). The plot even reproduces the hand sample-scale stratigraphy shown by raised and eroded samples. Remarkably, these chemical - textural - strati-graphic relationships in banded samples are not apparent from the variation diagrams (Fig. 7), emphasizing the power of MDS to identify subtle similarities and differences between chemically similar samples.
The origin and significance of banding in layer one
18 The fine-scale banding is expressed on weathered outcrop surfaces as cm-scale raised and eroded layers that superficially resemble some interlayered basalt- (eroded layers) segregation veins (raised) reported from basaltic flows (Anderson et al. 1984; Helz 1980, 1987; Greenough and Dostal 1992; Puffer and Horter 1993; Goff 1996; Rogan et al. 1996; Greenough et al. 1999; Puffer and Volkert 2001). However, Henley Harbour "bands" are probably not segregation veins because they are too fine-grained. Other features such as their stratigraphic regularity, location in the flow (lower portion), and lack of vesicles, although not individually inconsistent with a segregation vein model, together suggest some other origin.
19 The banded rocks show an alignment of plagioclase micro-phenocrysts, possibly resembling compacted plagioclase chain networks associated with melt expulsion in the colonnade of thick basaltic lava flows (Philpotts et al. 1996, 1999; Philpotts and Dickson 2000; Puffer and Volkert 2001). However, compaction has not been found associated with cm-scale, regular banding and the Henley Harbour banded rocks are very fine-grained with small percentages of high-aspect-ratio plagioclase laths (Fig. 3a), features that are texturally distinct from what has been described for collapsed and compacted colonnade basalts.
20 Banding and plagioclase alignment macroscopically and microscopically resemble features observed in multiply injected basaltic dykes. Thin sections show that the Henley Harbour banding is expressed as differences in the quantity and composition-related pleochroism of extremely fine-grained interstitial secondary clay(?) minerals, apparently replacing glass. The plagioclase microlites are aligned parallel to the bands. Greenough and Hodych (1990) reported repeating bands of quenched glass and very fine-grained basalt near the contacts of a Mesozoic dyke in Atlantic Canada. These features, which are on a similar scale to the banding at Henley Harbour, were related to magma pulsing, or multiple magma injection through the basaltic dyke. Feldspar alignment in these rocks made it possible to infer the direction of magma movement through the dyke because numerous observations and experiments have related the long axis of phenocrysts in fine-grained (non-cumulus) mafic rocks with flow directions (e.g., Clark 1952; Bhattacharji 1967; Ross 1986). The textural features reported by Greenough and Hodych (1990) are thus very similar to those at Henley Harbour and suggest that variations in the percentage of interstitial glass and alignment of plagioclase microlites reflect pulsing of magma through a conduit or lava flow.
21 The multidimensional scaling diagram (Fig. 10) and Table 1 averages suggest that, along with textural differences between raised and eroded bands, there are chemical differences. If feldspar alignment resulted from episodic magma movement along the floor of the flow, it is possible that compositional variations reflect repeated (pulse-related), compaction with Bernoulli-effect extraction of interstitial liquid out of eroded (residue) bands, and into overlying, moving magma (Fig. 11). In other words, as magma pulsed through the flow, it repeatedly and regularly caused residual liquid extraction, from an advancing, semi-solidified crystallization front at the base of the flow. It is unlikely that variations in the composition between raised and eroded bands can simply be ascribed to variations in phenocryst percentages for two reasons. First, there is no petrographic evidence that raised and eroded samples have significantly different phenocryst contents. Secondly, mass balance calculations (Bryan et al. 1969) indicate that phenocryst accumulation may not be able to account for differences in composition between raised and eroded bands. Calculations used the augite and plagioclase analyses portrayed in Fig. 4. The average of eroded samples HH2AE1, HH2AE4, HH2AE5, and HH2AE6 represented "parent" and the average of the associated raised samples (HH2AE1, HH2AE4, HH2AE5, and HH2AE6) acted as "daughter". The calculations produced low r2 values (0.2; sum of squared residuals) only if the most Fe-rich augite and Na-rich plagioclase compositions available were used and the latter almost certainly do not reflect the average composition of plagioclase phenocrysts in the samples. If a residual liquid was extracted it must represent liquid extracted from around groundmass phases. Mass balance calculations in the following section provide further support for the hypothesis that variations in composition between raised and eroded bands are due to movement of evolved interstitial residual liquid.
22 Banding similar to that at Henley Harbour has apparently not been previously reported. It has been argued here that the chemistry of the bands reflects primary processes, in particular small differences in the percentage of residual interstitial liquid (glass). However, without the secondary alteration which facilitated differential weathering, it is not obvious that this type of banding would be visible for sampling in totally unaltered and unweathered rocks. In this respect it may resemble segregation vein layering in a dacite lava flow at Kelowna, British Columbia, Canada, that would be very difficult to detect in a fresh flow due to minuscule chemical differences between the segregation veins and associated dacite (Greenough and Owen 1998).
The origin and significance of large-scale layering
23 The lack of samples from the inaccessible portions of the Henley Harbour flow makes it difficult to mass balance chemical compositions and create a quantitative model for element distributions and large scale layering such as done, for example, with Kilauea Iki (Helz et al. 1989). Nevertheless, models can be semi-quantitatively evaluated. In terms of MgO content, layer 1 is slightly more evolved than layer 3, and layer 2 is the most primitive (Table 1). It is possible that the base of the flow represents foundered crust. Helz et al. (1989) reported that foundered crust at the base of Kilauea Iki Lava Lake has highly variable composition. However, the foundered crust appears more primitive (higher MgO) than the average composition of the lava lake because of high olivine phenocryst abundances. Although it is possible that layer 1 represents foundered crust that was less primitive than layer 2, it has already been pointed out that there is no evidence for variations in vesicle percentages, grain size differences, oxidation, or surface irregularities between units that might indicate a flow top and foundered crust.
24 Chemical variation between layers 1 and 2 could also reflect changes in the composition of magma during eruption. For example, changes in magma composition have been documented for the 1959 eruption of Kilauea Iki Lava Lake (Wright 1973) although pre-eruptive heterogeneity was largely eliminated during eruption due to early mixing in the lava lake (Helz et al. 1989). Possibly the flow at Henley Harbour was not thick enough to effect thorough mixing and homogenization. Increasing evidence suggests that large continental flood basalt flows form due to prolonged (months to years) eruption of magma causing flow inflation over time (Hon et al. 1994; Self et al. 1996). Obviously there is the potential for chemical zoning in a flow if magma composition changes. Certainly large variations in composition occur across individual Long Range Dykes that far exceed variation in the flow at Henley Harbour (Greenough and Owen 1992). Similar chemical variability in other continental dykes has been related to the tendency for increasingly evolved magma to move through dyke conduits over time (days to weeks; Greenough et al. 1989). Possibly the first magma extruded at Henley Harbour was more evolved than what later formed layer 2. This model also requires that magma compositions fortuitously returned to more evolved, layer 1-like compositions, to form layer 3.
Fig. 11. Schematic diagrams showing the formation of banding a) and creation of large-scale chemical variation in the fl ow b). In a) high-density stippling denotes "raised" bands ~ 3 cm apart which are high in quenched glass whereas bands with low stippling form "eroded" bands in weathered outcrop and represent areas where un-quenched residual liquid has been, or is in the process of being, extracted. Thus the top of the column at time l shows moving magma eroding, and extracting interstitial liquid from fi ne-grained crystal mush. Like air passing over a plane's wing, magma movement causes a low-pressure zone immediately above the mush due to the Bernoulli effect, causing the extraction of interstitial liquid. When magma movement stops between pulses such as at time m (right-hand column), a new quench (raised) layer forms and the crystallization front moves further into the fl ow. Diagram b) shows the lower 1 to 2 metres of layer 2 forming, with low-density, residual liquid creating buoyant plumes that rise from the magma - lower crystal mush interface. In this diagram the amount of stippling refl ects the degree of crystallinity (temperature below the liquidus) which increases (temperature decreases) away from the crystallization front.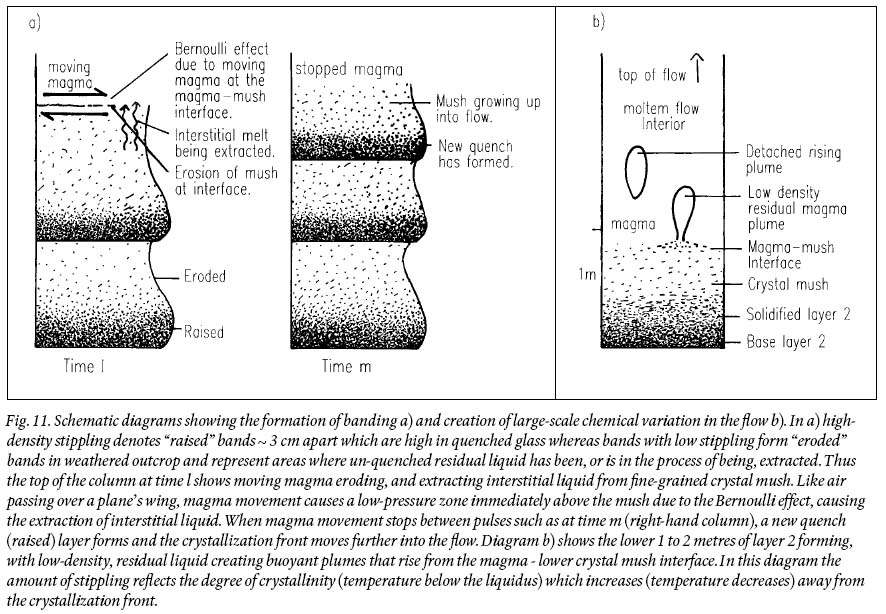
Display large image of Figure 11
25 Another possibility is that layer 1 reflects the initial magma composition whereas layer 2 is more mafic due to phenocryst accumulation. Obviously the chemical change between layers 1 and 2 is small but it is not clear that layer 2 is appreciably more phenocryst rich. As with the chemical variation between bands in layer 1, attempts to use observed phenocryst compositions to explain chemical differences between average layer 2 (parent) and an average of the raised bands from layer 1 were not satisfactory.
26 The best mass balance solutions required the most Fe-rich augite and Na-rich plagioclase phenocryst compositions measured, which seems unreasonable. Even then the lowest r2 values were quite high (0.7) given how similar the two rocks are.
27 Possibly layer 2 experienced the removal of interstitial melt through the diapiric rise of low density Fe-depleted residual magma "blebs" formed by the crystallization of an Fe-rich phase (e.g., Fe-Ti oxides, olivine, or pyroxene) at the lower crystallization front. Such a model, using re-equilibrated olivine to remove Fe, elegantly accounts for incompatible element enrichments and Fe depletion high in Kilauea Iki Lava Lake and complimentary depletions/Fe enrichment lower in the lake (Helz et al. 1989). Alternatively, mass transfer through the formation of low-density vesicle cylinders, an apparently common process in basaltic lava flows (Helz et al. 1989; Greenough et al. 1999), could remove residual liquid from layer 2 and move it higher in the flow. Either of these models helps explain why both sets of mass balance calculations (banding and inter-layer calculations) require removal of Na-rich plagioclase and Mg-poor augite not seen in phenocrysts. The right combination of such phases would approximate the composition of a removed residual liquid.
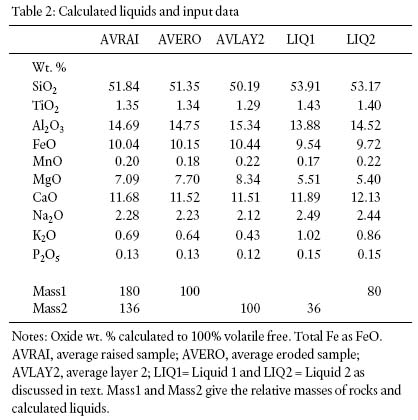
28 As argued above, mass balance calculations indicate that compositional variations between bands in layer 1 and between large-scale layers in the flow cannot be explained by removal or accumulation of observed phenocryst compositions. If, however, chemical variation is related to mass movement of residual liquids from a single parent magma, and the liquids were extracted with varying efficiency after the same percentage of crystallization, then mass balance calculations to ascertain the composition of these liquids, using different rocks from the flow, should yield similar evolved liquid compositions. To test this model, calculations used the average of the most evolved (lowest MgO) rock composition in the flow (average raised sample) and the two more "primitive" compositions (average eroded sample and average layer 2). Note that the "primitive" rocks represent samples that lost different amounts of a residual liquid. The compositions of the two theoretical evolved liquids were calculated according to the following equations:
- Average Layer 2 + Liquid 1 = Average Raised Sample
- Average Eroded Sample + Liquid 2 = Average Raised Sample
29 Beginning with a crudely interpolated composition for each liquid, the mass balance calculations were performed repeatedly, each time modifying the liquid composition until the sum of squared residuals equalled zero. Calculation results together with the average starting rock compositions appear in Table 2. Despite using the two most extreme cases possible, the small chemical differences between the average eroded and average raised samples, and the large differences between the average raised sample and average layer 2, the calculated compositions of liquids 1 and 2 are remarkably similar (Table 2). Further, the liquids have the requisite characteristics of a residual liquid: higher SiO2 and incompatible element (TiO2, Na2O, and K2O) concentrations and lower MgO. A smaller amount of liquid is required to explain the differences between average eroded and average raised samples (36 g per 100 g of average eroded sample), than between the other pair of samples (80 g per 100 g of average layer 2; Table 2). The similarity of these calculated liquids may be fortuitous, but it suggests that movement of residual liquid on a cm- and m-scale is a viable method of explaining chemical variation within the flow. This model, summarized in Fig. 11, suggests that eroded bands of layer 1 appear more "primitive" than raised samples because evolved interstitial liquid was removed from the former. During the crystallization of layer 2, similar residual liquids formed buoyant plumes that rose from the magma-crystal mush interface, leaving layer 2 depleted in residual liquid (Fig. 11).
SUMMARY AND CONCLUSIONS
30 The lack of textural evidence for flow tops in the stratigraphic section examined, and similarity of all samples collected at Henley Harbour, indicates that large-scale layering does not reflect the existence of multiple flows. Chemical similarities to the Long Range Dykes confirm that the flow represents the surficial expression of dyke magmatism (Fig. 6). The chemical similarity among samples approaches analytical uncertainty and complicates interpretation of chemical data (Fig. 5, 7). Multidimensional scaling (MDS) improves effective precision by allowing simultaneous evaluation of the entire data set. It shows that, in general, element behaviour in the data set is consistent with igneous processes controlling overall chemical variability (Fig. 8). MDS also suggests that large scale layering apparent in outcrop has a chemical fingerprint (Fig. 9). Averages (Table 1) indicate that layer 1 (bottom) is less primitive than layer 2, and the single layer 3 sample lies compositionally in between, but closer to layer 1 (Fig. 9). Mass balance calculations show that chemical variability between layers cannot be explained by phenocryst accumulation or removal because unreasonable (more-evolved) mineral compositions are required to effect low r2 values. Chemical variation may reflect changes in the composition of extruded magma during formation of an inflated flow. However, our preferred model, supported by mass balance calculations, attributes variability to the convective redistribution of evolved residual liquid formed from a single parental magma (Fig. 11). Analogies with other thick flows suggest that redistribution was effected by low density vesicle plumes, or Fe-depleted residual magma plumes, that rose from the lower, advancing crystallization front to higher levels in the flow.
31 MDS confirms that cm-scale banding expressed as 10's of m-long raised and eroded bands in outcrop also show a chemical signature (Fig. 10). As with the large scale layering, observed phenocryst compositions cannot account for the chemical variation between bands. However, mass balance calculations indicate that variations in composition between bands, like variations between large-scale layers in the flow, can be accounted for by movement of chemically evolved residual liquids that closely resembled one another in composition. Alignment of microlites in the bands and variations in the quantity of interstitial alteration minerals now replacing glass suggest that the cm-scale banding is related to magma movement during extrusion/emplacement of the flow (Fig. 11). Banding (layering) of this type may be common in basaltic lava flows, but field identification could require the combined subtle effects of glass alteration accentuated by weathering. The use of geochemistry to identify this type of layering is complicated by the fact that bands are so chemically similar that it takes very powerful statistical methods, such as multidimensional scaling, to recognize it.
Table 2: Calculated liquids and input data
ACKNOWLEDGMENTS
C. Gower and the NF Dept. of Mines provided Red Bay accommodation. John and Lorraine Stone kindly took us in during our stay at Henley Harbour. H. Muggeridge prepared diagrams. L. Mallory-Greenough commented on the manuscript. P. King, P. Horan, and M. Tubrett at the Memorial University Geochemical labs persevered with the whole-rock chemical analyses. R. Mackay (Dalhousie Electron Microprobe Facility) helped with mineral analyses. The manuscript benefited from critical reviews by J. Puffer and an anonymous Atlantic Geology reviewer. Helpful comments by the editor (S. Barr) are also acknowledged. This research was supported by NSERC grants to both authors.REFERENCES
Anderson, A.T., Swihart, G.H., Artioli, G., & Geiger, C.A. 1984. Segregation vesicles, gas filter-pressing, and igneous differentiation. Journal of Geology, v. 92, pp. 55—72
Bhattacharji, S. 1967. Mechanics of flow differentiation in ultra-mafic and mafic sills. Journal of Geology, v. 75, pp. 101—112.
Borg, I., & Groenen, P. 1997. Modern Multidimensional Scaling, Theory and Applications. Springer-Verlag, New York, 471 p.
Bryan, W.B., Finger, L.W., & Chayes, F. 1969. Estimating propor tions in petrographic mixing equations by least-squares approximation. Science, v. 163, pp. 926—927
Caroff, M., Ambrics, C., Maury, R.C., Cotten, J. 1997.From alkali basalt to phonolite in hand-sized samples: vapor-differentiation effects in the Bouzent`lava flow (Cantal, France). Journal of Volcanology and Geothermal Research, v. 79, pp. 47—61.
Clark, R.H. 1952. The significance of flow structure in microporphyritic ophitic basalts of Arthurs Seat. Edinburgh Geological Society Transactions, v. 15, pp. 69—83.
Drake, M.J., & Weill, D.F. 1975. Partition of Sr, Ba, Ca, Y, Eu2+, Eu3+ and other REE between plagioclase feldspar and magmatic liquid: an experimental study. Geochimica et Cosmochimica Acta, v. 39, pp. 689—712.
Goff, F. 1996. Vesicle cylinders in vapor-differentiated basalt flows. Journal of Volcanology and Geothermal Research, v. 71, pp. 167—185
Greenough, J.D., & Dostal, J. 1992. Cooling history and differentiation of a thick North Mountain Basalt flow (Nova Scotia, Canada). Bulletin of Volcanology, v. 55, pp. 63—73.
Greenough, J.D., & Hodych, J.P. 1990. Evidence for lateral magma injection in the Early Mesozoic dykes of Eastern North America. In Mafic Dykes and Emplacement Mechanisms. Edited by A.J. Parker, P.C. Rickwood, and D.H. Tucker. Proceedings of the Second International Dyke Conference. Balkema, Rotterdam, pp. 35—46.
Greenough, J.D., & Owen, J.V. 1992. Platinum group element geochemistry of continental tholeiites: analysis of the Long Range Dyke swarm, Newfoundland, Canada. Chemical Geology, v. 98, pp. 203—219.
Greenough, J.D., & Owen, J.V. 1998. Igneous layering in a dacite: On the origin and significance of Layer Cake Mountain, Kelowna, B.C., Canada. Mineralogical Magazine, v. 62, pp. 731—742.
Greenough, J.D., Jones, L.M., & Mossman, D. 1989. The Sr isotopic composition of early Jurassic mafic rocks of Atlantic Canada: Implications for assimilation and injection mechanisms affecting mafic dykes. Chemical Geology (Isotope Geoscience Section) v. 80, pp. 17—26.
Greenough, J.D., Lee, C.-Y., & Fryer, B.J. 1999. Evidence for volatile-influenced differentiation in a layered alkali basalt flow, Penghu Islands, Taiwan. Bulletin of Volcanology, v. 60, pp. 412—424.
Helz, R.T. 1980. Crystallization history of Kilauea Iki lava lake as seen in drill core recovered in 1967—1979. Bulletin of Volcanology, v. 43, pp. 675—701.
Helz, R.T. 1987. Differentiation behaviour of Kilauea Iki lava lake, Kilauea Volcano, Hawaii: an overview of past and current work. Geochemical Society, Special Publication 1, pp. 241—258.
Helz, R.T., Kirschenbaum, H., & Marinenko, J.W. 1989. Diapiric transfer of melt in Kilauea Iki Lava Lake, Hawaii: a quick, efficient process of igneous differentiation. Geological Society of America Bulletin, v. 101, pp. 578—594.
Hon, K., Kauahikaua, J., Denlinger, R., & MacKay, K. 1994. Emplacement and inflation of pahoehoe sheet flows: observations and measurements of active lava flows on Kilauea Volcano, Hawaii. Geological Society of America Bulletin, v. 106, pp. 351—370.
Irvine T.N., & Baragar W.R.A. 1971. A guide to the chemical classification of the common volcanic rocks. Canadian Journal of Earth Sciences, v. 8, pp. 523—548.
Jenner, G.A., Longerich, H.P., Jackson, S.E., & Fryer, B.J. 1990. ICP-MS; a powerful tool for high-precision trace-element analysis in earth sciences; evidence from analysis of selected U.S.G.S. reference samples. Chemical Geology, v. 83, pp. 133—148.
Kamo, S.L., Gower, C.F., & Krogh, T.E. 1989. Birthdate for the Iapetus Ocean? A precise U-Pb zircon and baddeleyite age for the Long Range dikes, southeast Labrador. Geology, v. 17, pp. 602—605.
Longerich, H.P. (1995) Analysis of pressed pellets of geological samples using wavelength-dispersive X-ray fluorescence spec-trometry. X-Ray Spectrometry, v. 24, pp. 123—136.
Mallory-Greenough, L.M., Greenough, J.D., & Owen, J.V. 1998. New data for old pots: Trace element characterization of ancient Egyptian pottery using ICP-MS. Journal of Archaeo-logical Science, v. 25, pp. 85—97.
Owen, J.V. 1987. Geology of the central part of the Long Range Inlier, western Newfoundland. Geological Survey of Canada Open File Report 1505.
Owen, J.V., & Greenough, J.D. 2000. Les Chateaux in the mist: A cartographic and navigational landmark on the Labrador coast. Mercator's World, v. 5, no. 1, pp. 26—33.
Owen, J.V., Greenough, J.D., & Bellefontaine, K.A. 1989. Preservation of primary geochemical signatures in poly-meta-morphosed tholeiite: The Long Range dyke swarm, Newfoundland, Canada. Lithos, v. 24, pp. 55—64.
Pearce, J.A., & Cann, J.R. 1973. Tectonic setting of basic volcanic rocks determined using trace element analyses. Earth and Planetary Science Letters, v. 19, pp. 290—300.
Philpotts, A.R., Carroll, M., & Hill, J.M. 1996. Crystal-mush compaction and the origin of pegmatitic segregation sheets in a thick flood-basalt flow in the Mesozoic Hartford Basin Connecticut. Journal of Petrology, v. 37, pp. 811—836.
Philpotts, A.R., Brustman, C.M., Shi, J., Carlson, W.D., & Denison, C. 1999. Plagioclase-chain networks in slowly cooled basaltic magma. American Mineralogist, v. 84, pp. 1819—1829.
Philpotts, A.R., & Dickson, L.D. 2000. The formation of plagioclase chains during convective transfer in basaltic magma. Nature, v. 406, pp. 59—61.
Philpotts, J.A., & Schnetzler, C.C. 1970. Phenocryst-matrix partitioning coefficients for K, Rb, Sr and Ba with applications to anorthosite and basalt genesis. Geochimica et Cosmochi-mica Acta, v. 34, pp. 307—322.
Puffer, J.H. 2002. A Late Neoproterozoic Eastern Laurentian superplume: location, size, chemical composition, and environmental impact. American Journal of Science, v. 302, pp. 1—27.
Puffer, J.H., & Horter, D.L. 1993. Origin of pegmatitic segregation veins within flood basalts. Geological Society of America Bulletin, v. 105, pp. 738—748.
Puffer, J.H., & Volkert, R.A. 2001. Pegmatoid and gabbroid layers in Jurassic Preakness and Hook Mountain basalts, Newark Basin, New Jersey. Journal of Geology, v. 109, pp. 585—601.
Rogan, W., Blake, S., & Smith, I. 1996. In-situ chemical fractionation in thin basaltic lava flows: examples from the Auckland volcanic field, New Zealand and a general physical model. Journal of Volcanology and Geothermal Research, v. 74, pp. 89—99.
Ross, M.E. 1986. Flow differentiation, phenocryst alignment, and compositional trends within a dolerite dike at Rockport, Massachusetts: Geological Society of America Bulletin, v. 97, pp. 232—240.
Self, S., Thordarson, T., Keszthelyi, L., Walker, G.P.L., Hon, K., Murphy, M.T., Long, P., & Finnemore, S. 1996. A new model for the emplacement of Columbia River Basalts as large, inflated pahoehoe lava flow fields. Geophysical Research Letters, v. 23, pp. 2689—2692.
Strong, D.F. 1974. Plateau lavas and diabase dikes from northwestern Newfoundland. Geological Magazine, v. 111, pp. 501—514.
Strong, D.F., & Williams, H. 1972. Early Paleozoic flood basalts of northwestern Newfoundland: their petrology and tectonic significance. Proceedings of the Geological Association of Canada, v. 24, pp. 43—53.
Stukas, V., & Reynolds, P.H. 1974. 40Ar/39Ar dating of the Long Range dikes, Newfoundland. Earth and Planetary Science Letters, v. 22, pp. 256—266.
Wilkinson, L., Hill, M., Welna, J.P., & Birkenbeuel, G.K., 1992. "SYSTAT for Windows: Statistics, Version 5 Edition", SYSTAT Inc., Evanston, IL.
Williams, H. 1979. Appalachian Orogen in Canada. Canadian Journal of Earth Sciences, v. 16, pp. 792—807.
Wright, T.L. 1973. Magma mixing as illustrated by the 1959 eruption, Kilauea volcano, Hawaii. Geological Society of America Bulletin, v. 84, pp. 849—858.
Editorial responsibility: Sandra M. Barr
