Boats, Trains, and Immunity:
The Spread of the Spanish Flu on the Island of Newfoundland
Craig T. PalmerUniversity of Missouri-Columbia
Lisa Sattenspiel
University of Missouri-Columbia
Chris Cassidy
University of Reading
1 THE SPANISH INFLUENZA OF 1918 and 1919 was the most deadly pandemic in human history. It was a true pandemic in every sense of the word — nearly every country in the world was affected by the epidemic and experienced unusually high morbidity and mortality as a consequence. In this paper we describe the general patterns of spread of the 1918 flu on the island of Newfoundland. We use a variety of sources of information to address the following questions:
- How, when, and where did this influenza enter the island?
- What modes of transportation may have spread the epidemic from one community to another, and when did these movements take place?
- What factors might account for the varying numbers of cases and deaths in different areas of the island?
In order to provide a backdrop with which to understand Newfoundland’s epidemic, we first give a brief overview of worldwide experiences with the epidemic. We then describe the overall patterns of Newfoundland’s mortality from the epidemic, both for the island as a whole and for the different districts on the island and discuss where and how the disease may have entered the island. We conclude with a discussion of three possible explanations for the observed mortality patterns during the second and most serious wave of the epidemic: the role of shipping and other boat travel, the role of railroad travel, and the possibility that exposure to the pathogen during the first and less severe wave may have resulted in immunity to the virus and spared some regions from the ravages of the second wave. Analyses to date suggest that factors related to differences in travel and interaction (including both conscious decisions and chance events) likely account for most of the observed temporal and geographic patterns of spread of the epidemic, but that immunity may have played a role in some areas.
THE GLOBAL IMPACT OF THE SPANISH FLU
2 When the Spanish Flu began sweeping the globe in the waning months of World War I few could have imagined that nearly one-third of the world’s population would become infected and that it would kill many more people than the War itself (Burnet and Clark 1942; Barry 2004; Taubenberger and Morens 2006). The pandemic was a truly global phenomenon that touched nearly every country of the world (see Phillips and Killingray [2003] for examples of experiences with the epidemic in a variety of places). Estimates of the overall mortality from the flu vary widely, but a recent comprehensive review of the data places the level at 50 million or more (Johnson and Mueller 2002). It is unlikely that the actual number of deaths will ever be certain because many regions known to have experienced the epidemic did not keep adequate records of births, deaths, illness, and other vital statistics. This problem is also complicated by the fact that at the time of the epidemic, doctors were not obligated to report influenza to the health authorities in either the United States (Crosby 1989) or most other parts of the world. Furthermore, the epidemic was so severe in many places that it was probably difficult for medical staff to keep up with the recordkeeping needed to ensure accuracy.
3 Taking into account data uncertainties as much as possible, Johnson and Mueller (2002) estimate that the worldwide mortality rate averaged 2.5-5 deaths per thousand population (0.25-0.5%), although this average obscures substantial heterogeneity across regions and even communities. For example, estimates of death rates in the Americas range from 1.2 per thousand in Argentina to 39.2 per thousand in Guatemala, Australia experienced an estimated death rate of only 2.7 per thousand, while the death rate in Fiji has been estimated at 54.9 per thousand. Significant heterogeneity was also apparent at the community level. Analysis of the data to be described below suggests that the overall death rate in Newfoundland and Labrador was only about 5 per thousand, a level similar to the worldwide average, but two communities in Northern Labrador, Hebron and Okak, experienced 68 percent and 78 percent (680 and 780 per thousand) mortality, respectively (Markham 1986). The situation in Okak was so severe that the community was completely abandoned following the epidemic.
4 Where the flu originated and how it spanned the globe remain matters of debate, although numerous studies have documented that its worldwide spread was clearly associated with the movement of military troops during the last few months of World War I (see, for example, Pettigrew 1983; Crosby 1989; Zylberman 2003; Smallman-Raynor and Cliff 2004). Most scholars who have studied the epidemic believe that it arose in the United States in the early spring of 1918, with the most common scenario being that it began in Kansas (Vaughan 1921; Burnet and Clark 1942; Crosby 1989).
5 Scholars also generally agree that there were three separate waves of Spanish Flu in most places and in some areas there appeared to be an "echo" wave in 1920. It is important to note, however, that although the pandemic is usually characterized by three waves, there was much geographic heterogeneity in its local expression, with some regions experiencing three distinct waves and others experiencing only two or even just one wave (Vaughan 1921; Jordan 1927; Pyle 1986; Crosby 1989; Potter 2001). In addition, there is some evidence for multiple peaks within individual waves in some places (Vaughan 1921).
6 The first wave of the epidemic is usually considered to cover the time from its apparent arrival in March or April of 1918 until the end of July 1918. From its likely origin in the midwestern United States, the epidemic spread to military bases in several midwestern and southeastern US states. American soldiers probably carried the flu to France in early April from which it spread to other parts of Europe. There is some uncertainty about the US origin, however, because China, Japan, and France all reported some cases of flu in March 1918 (Jordan 1927; Pyle 1986; Taubenberger et al. 2001). The epidemic reached Portugal and Spain, as well as India in May, and the rest of western Europe, Australia, New Zealand, and Indonesia by June (Vaughan 1921; Jordan 1927; Burnet and Clark 1942; Shope 1944, 1958; Pyle 1986; Crosby 1989; Patterson and Pyle 1991; Barry 2004). It was carried to Canada by troops returning home from Europe in June and July 1918 (MacDougall 1985). This wave apparently did not reach Russia or sub-Saharan Africa, and it waned in most parts of the world by the end of the summer (Patterson and Pyle 1991).
7 A recent reanalysis of data from New York City suggests that the virus may have been circulating in that city as early as February 1918 (Olson et al. 2005). This hypothesis was originally proposed at the time of the epidemic (Frost 1919), but was later forgotten in light of the consensus view that the virus emerged in the rural midwest United States (Olson et al. 2005). A further view about the origin of the virus has been promoted by John Oxford and colleagues, who resurrected an early hypothesis that a small, localized epidemic of a severe pus-discharging bronchitis that appeared in France, perhaps as early as 1916, was actually caused by the 1918 flu strain (Oxford 2000, 2001; Oxford et al. 2002; see also Vaughan 1921 for a detailed and critical discussion of this idea). It has also been suggested that, in common with many recent flu strains, the 1918 virus originated in birds in Asia before adapting to humans (Shortridge 1999). Recent reconstructions of the viral genome do support an avian origin for the 1918 strain, but they do not provide clear evidence for any specific geographic origin because the 1918 strain is genetically unlike any influenza virus that has been examined since the time of the epidemic (Reid et al. 2004; Taubenberger et al. 2005; Taubenberger and Morens 2006). Thus, it is clear that both the epidemiological and genetic data do not resolve the question of the geographic origin of the 1918 flu strain.
8 Cases associated with the second and most deadly wave began appearing near the end of August 1918 and continued through the early winter of 1919; the third wave followed soon after during the spring of 1919. During the second wave Spanish Flu appears to have changed its character and unusually virulent epidemics were reported nearly simultaneously in three port cities — Freetown, Sierra Leone; Brest, France; and Boston, Massachusetts — that were located at some distance from each other (Vaughan 1921; Jordan 1927; Patterson and Pyle 1983, 1991; Crosby 1989). As Langford (2002) points out, however, influenza is known for suddenly appearing in widely separated places around the world. Nonetheless, the fact remains that by the end of August Spanish Flu had become a ferocious killer, the likes of which had never before been seen.
9 From its early epicentres in Brest, Boston, and Freetown, the second wave spread quickly to the rest of the world, with very few countries spared. Because of the quickness of its spread and its seemingly simultaneous appearance in widely dispersed locations, it will probably never be possible to determine exactly when and where the virulent form arose. But according to Patterson and Pyle (1991), it appears to have been carried from Sierra Leone to England, spreading from there to Scotland and Scandinavia. From the epicentre in France, the virus spread throughout Italy and then to the Greek islands. Spain was attacked both from Portugal and from the Pyrenees to the north. The advance into Germany and central Europe appears to have been slightly delayed because of barriers put up by land mines and trenches. The disease also spread from Boston to nearly every region of the United States, although the specific patterns of spread within the US are complicated (Shope 1958).
10 Most parts of Canada were also hit very hard by the epidemic, especially the second wave, which spread throughout the country beginning in September. Nearly all students in a Quebec school of over 400 students were reported to be sick on 8 September; 350 students were sent home, with the result that the virus was effectively dispersed throughout the province (MacDougall 1985). Overall, Quebec experienced 530,000 cases of flu and 14,000 deaths. In fact, there were almost 3,500 deaths in Montreal alone and at the height of the epidemic a death occurred every 9 minutes (Fahrni 2004). The first death was recorded in Toronto at the end of September, and within a week the epidemic exploded. It remained a major problem all through October and did not begin to ease until the beginning of November (MacDougall 2006). Detailed information on the spread of the epidemic is also known for Winnipeg, which first experienced the epidemic at the end of September. The city experienced two major waves of the disease — a severe epidemic with high mortality in October-December with a late November peak, and a milder outbreak in February-April 1919 (Jones 2002, 2005). Several communities in the hinterlands north of Winnipeg were also affected by the epidemic, with one, Norway House, experiencing almost 20 percent mortality (Herring 1994; Sattenspiel and Herring 1998; Herring and Sattenspiel 2003). The epidemic reached British Columbia in early October and resulted in a death rate of 6.21 per thousand people in the non-Native population. But as in Manitoba, the toll among First Nations peoples was much higher, with an overall death rate of 46 per thousand people (Kelm 1999).
11 The second wave was a true pandemic that reached almost every part of the world, but there were a few exceptions. For example, the virus was brought to New Zealand in October, but the spread to Australia was delayed until January 1919 because of an extensive and vigorous quarantine effort (Patterson and Pyle 1991; McCracken and Curson 2003). Relative isolation and strong quarantine efforts protected northern and eastern Iceland as well (Cliff et al. 1986), and although Western Samoa was hit extremely hard by the epidemic, American Samoa was largely spared (Herda 2000). As will be discussed in more detail below, significant parts of Newfoundland were also spared the ravages of the second wave.
12 The brutality of the virus responsible for the epidemic cannot be debated. In the United States alone, life expectancy for both males and females was roughly twelve years lower in 1918 than it was in 1917 and 1919 (Noymer and Garenne 2003). In common with other flu epidemics, the Spanish Flu was characterized by high morbidity and low mortality, although its case fatality rate (number of deaths divided by number of cases) of 2.5 percent made it 25 times more deadly than the average influenza outbreak (Dull and Dowdle 1980). It was so virulent that many doctors at the time were reluctant to call it influenza, believing it to be a new, and more horrible, disease (Shope 1944).
13 The age-specific mortality curve for 1918 reflects the relatively high impact of the Spanish Flu on the young and healthy, an unusual and defining characteristic. Typically influenza epidemics prey on the very old, the very young, and the infirm, even when a newly evolved strain makes its way through a population. This generates an age-specific mortality curve that takes a U-shape, with high levels of mortality in the oldest and youngest and low levels in between. Mortality during the Spanish Flu epidemic was characterized by a W-shaped curve, with high death rates for the young and old, but in addition, a clear peak at ages 15-45. The absolute mortality rates for the youngest and oldest individuals were still significantly higher than the rates for ages 15-45, but the excess mortality (the difference between the 1918 epidemic and other flu epidemics) was truly astounding for the young adults (Luk et al. 2001; Olson et al. 2005).
14 In many areas little attention was given to the first wave because it was not significantly different from typical annual outbreaks of flu. While it made its victims ill for about three days with a fever and chills, the mortality rates were not unusually high for outbreaks of flu. Although it could be "astonishingly contagious" (Crosby 1989, 25), it only became distinctive in retrospect when physicians experienced with the rapid progression from uncomplicated influenza to fatal pneumonia (the unusual and characteristic feature of the Spanish influenza strain observed during later waves) recognized that this pattern was also present, though much less frequently, during the first wave (Taubenberger and Morens 2006).
15 Death from the 1918 flu was not pretty. Flu victims, often young, healthy people, fell ill and died within days (sometimes hours) as they drowned on a frothy, bloody fluid that filled their lungs. The stricken suffered a general weakness usually comprised of sore muscles and aches in their heads and backs combined with fevers of up to 105 degrees (Crosby 1989). They also endured respiratory distress, each breath a struggle, with their faces and limbs eventually turning grey then blue/purple from lack of oxygen. "And the sound of this gasping — loud, hoarse, rapid, unbelievable, filling the whole room, and orchestrating every moment in it — gave to the scene its final note of horror," was writer Thomas Wolfe’s loosely fictionalized account of his own brother’s death (Kolata 2005, 25). Many of these deaths were not due to influenza itself, however, but were a consequence of secondary bacterial infections, the most common of which were pneumonias (Burnet and Clark 1942).
16 Some evidence suggests that a significant proportion of victims of the first wave may have developed immunity to the virus that protected them from the much more deadly second wave. This apparent protection was observed in troops in the United States Army and Navy, the British Navy, and the French Army who experienced significant flu outbreaks during Wave I (Jordan 1927; Burnet and Clark 1942; Shope 1944, 1958) as well as in civilians in Baltimore (Frost 1919). Vaughan (1919) reported that cases during Wave II at one military camp were largely confined to troops who entered the camp after Wave I had passed, while the men who had experienced the epidemic during Wave I and were still at the camp were largely untouched by Wave II.
17 This evidence, although suggestive, was not conclusive as formal studies were not done to verify the accuracy of these observations (Schoenbaum 2003). In addition, other studies failed to observe similar results (Burnet and Clark 1942). Recognizing the value of information about prior immunity for understanding the nature of epidemic spread, however, in the immediate aftermath of the epidemic, US Public Health Service Officers decided to undertake epidemiological studies of influenza in rural communities whenever such opportunities were presented.
18 One such study, conducted by Armstrong and Hopkins (1921), focused on a 1920 epidemic on an isolated island in Lake Erie, Ohio. This study showed that individuals with prior exposure to the virus could clearly develop immunity that would protect them in the future, although it was probably not complete. Armstrong and Hopkins determined every case of clinical illness that occurred among the 689 persons living on the island during the 1920 epidemic and they also noted which of these 689 persons had been ill in the fall of 1918, when there had been a less severe epidemic. They found that 77.2 percent of those untouched in 1918 became sick in 1920, while 48.2 percent of those who had become ill in 1918 became sick again in 1920. This indicated that infection with the virus circulating during Wave II conferred a protective effectiveness of 37 percent two years after the first flu infection (Schoenbaum 2003). Although this does not guarantee that infection with the virus circulating during Wave I conferred protection during Wave II, the consensus within the field of influenza epidemiology has long been that recovery following infection leads to the development of immunity lasting at least several months, and that recovery from infection during Wave I probably protected individuals from re-infection during Wave II (Shope 1944, 1958).
19 Overall, the Spanish Flu epidemic and the deaths it caused were so sensational that it is almost impossible to understand how and why, until fairly recently, it was seemingly overlooked by much of the world in spite of abundant and detailed documentation. Recent experiences with SARS, avian influenza, and the threat of bio-terrorism have generated widespread renewed interest in this major historical event, however, and have stimulated new studies of the impact of the disease in many different places.
THE STUDY SITE
20 The island of Newfoundland, together with Labrador, forms the easternmost province of Canada. Newfoundland itself is a large, roughly triangular island with a very jagged coastline that conceals numerous small harbours and inlets (Figure 1). The northwestern part of the island is a large peninsula, commonly referred to as the Great Northern Peninsula [GNP]; the southeastern region is another large H-shaped peninsula known as the Avalon Peninsula; numerous other small peninsulas occur throughout the island’s coastal regions.
21 The present-day population of Newfoundland is about half a million. Around 40 percent of the population lives on the Avalon Peninsula in the St. John’s metropolitan area, and almost all of the remaining residents live in a few small cities situated slightly inland or in small fishing villages (called outports) scattered along the coast. The lowest settlement densities occur along the southern coast and on the GNP. In 1911, the nearest census year prior to the Spanish Flu epidemic, the St. John’s district alone comprised about 19 percent of the entire island’s population, while nearly 40 percent of the island’s population lived in the region that roughly corresponds to the present-day St. John’s metropolitan area (the districts of St. John’s, Bay de Verde, Carbonear, Harbour Grace, Port de Grave, and Harbour Main).
Figure 1. Map of Newfoundland showing the administrative districts and major rail lines at the time of the Spanish Flu epidemic.

Display large image of Figure 1
22 At the time of the Spanish Flu epidemic, long-distance travel on the island was largely limited to boat and rail. The railroad system consisted of a main rail line extending from St. John’s in the east to Deer Lake and Port-aux-Basques in the west, as well as several branch lines linking the main rail line with the coastal boats (see Figure 1). Although well over 100 communities were located along the railroad, the proportion of communities served by railroad was fairly small outside of the Avalon Peninsula. In areas away from the railroad, the majority of the outport population travelled by coastal steamers, small boats, horse-drawn carts, and walking during the summer, and by dog teams or horse-pulled sleighs during the winter (Firestone 1967). The island is divided into a number of administrative districts, although the boundaries and number of these districts have changed somewhat over time. Districts existing at the time of the Spanish Flu are shown in Figure 1, and they serve as the basis of the analyses described below.
METHODS
23 Data for this project were gathered during the summers of 2005 and 2006. Sources of data include death records recorded at the provincial archives in St. John’s [PANL], hospital and death records from the Charles S. Curtis Memorial Hospital in St. Anthony, in-depth interviews with island residents, census data and other vital statistics from throughout the island, records of international shipping, newspaper accounts of the epidemic and boat movements during the epidemic, information held at local museums from throughout the island, and a variety of historical manuscripts and government correspondence and reports relating to the epidemic.
24 Death records available at PANL (Reels 32 and 33) provide names, date of death, district where the death was originally recorded, place of death, cause of death, sex, age, and, in many cases, place of birth, religion, occupation, and other personal information. Pertinent information was recorded for all deaths on the island due to a variety of respiratory illnesses, especially influenza, pneumonia, and related conditions between 1918 and 1920, but also bronchitis and related conditions. As a time-saving measure, deaths from bronchitis during 1920 were not collected, because it was determined before data collection was completed that, unlike deaths from pneumonia, which tracked the influenza death pattern quite closely, the temporal pattern of mortality from bronchitis was quite different from that observed for influenza.
25 Deaths during the years 1918-1920 were recorded for 1,229 individuals who died from influenzal illnesses and 825 individuals who died from pneumonia and related illnesses. Deaths occurring outside of the province and deaths occurring in Labrador were omitted from the analyses. The latter group was omitted because it was clear that there was significant under-enumeration in the provincial records, not only of deaths from influenza and pneumonia, but also of deaths from all other causes. The remaining data used for the analyses below included 1,128 deaths attributed to influenza and related conditions and 773 deaths attributed to pneumonia-related illnesses other than "influenzal pneumonia" or "influenza and pneumonia" (the latter two causes were included in the influenza tally). At least some deaths from both influenza and pneumonia were recorded from every district on the island.
26 Hospital records from 1915 to 1920 were examined at the Charles S. Curtis Memorial Hospital in St. Anthony, Newfoundland. Detailed information was collected on all cases of influenza and pneumonia, including date of admission to the hospital and whether the patient survived the illness. Confidentiality concerns limit the use of most of these data to overall case numbers and locations of cases, but they nonetheless provide some information on individuals who survived the epidemic to supplement our data on those who died. In addition, the larger sample resulting from the inclusion of individuals who did not die provides additional information on which particular communities in the region were hit by the epidemic.
27 During the summer of 2005, 18 interviews were conducted with residents of the GNP. Information from these interviews and initial observations of the death records at PANL were used to identify particular regions in which to conduct other interviews. These regions included those areas that were hardest hit by the epidemic and the area of the GNP covered by the Grenfell Mission. A total of 133 interviews were performed across the island. The interviews included questions related to the Spanish Flu and other aspects of life around the time of the epidemic, including social visiting patterns within communities, travel between communities, general health care, social organization, marriage patterns, and religion.
28 Data relevant to the entrance of the Spanish Flu via international shipping were collected by examining Lloyd’s List of Overseas Shipping Intelligence, January through December 1918 at the Maritime History Archives at Memorial University. This source provided names of ships, location and date of arrivals and departures, and ship’s numbers. This detailed information on ships’ movements was supplemented by newspaper listings giving daily coastal boat movements, train movements, and many other forms of relevant information.
RESULTS
General Characteristics of the Spanish Flu Epidemic on the Island of Newfoundland
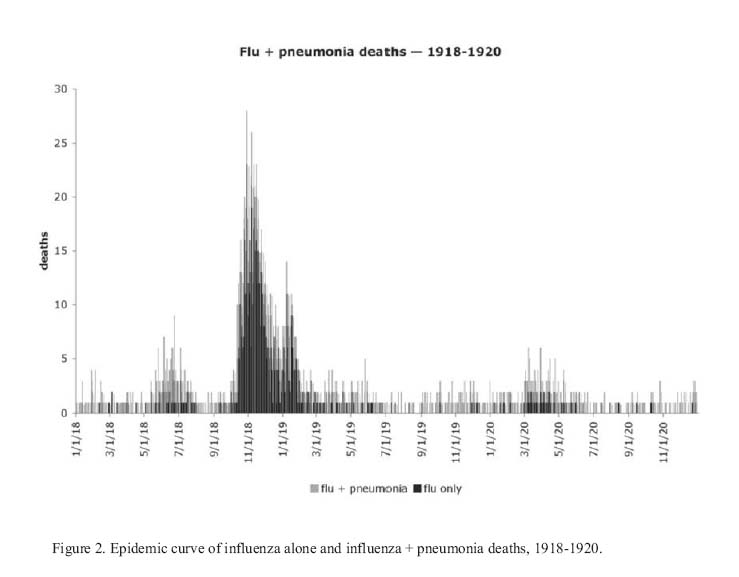
29 As is common in many other places, the Spanish Flu visited Newfoundland in several waves. Figure 2 shows the epidemic curve for influenza cases and for influenza plus pneumonia occurring between 1918 and 1920. This figure indicates a somewhat ambiguous series of waves. As recognized in other locations worldwide, there is clearly a small "first wave" during the summer of 1918. This is followed by a much larger "second wave" during the fall of 1918. There is a decline in deaths during December 1918, followed by a moderate increase in January before a gradual decline that lasted through June 1919.
30 It is possible that this pattern signifies the end of Wave II in December of 1918 followed by the arrival of a "third wave" in January that corresponds to Crosby’s Wave III (Crosby 1989); however, the wave Crosby observed in US data occurred in March and April, significantly later than the second Newfoundland Wave II peak. The onsets of both Wave I and Wave II on the island were significantly delayed relative to the United States and Western Europe (recall from our discussion above that in these regions Wave I spread in April and May 1918 and Wave II in September and October 1918), probably in large part because of the relatively remote location of Newfoundland. Thus, it is more likely that the entire period from September through June represents Wave II, and that this wave exhibited a bimodal and elongated pattern in Newfoundland. Specific reasons for the bimodal distribution of Newfoundland’s Wave II may become apparent when our present aggregate level analysis is supplemented by analyses at the sub-district and community levels.
31 Initial analyses of within-district epidemics indicate that in some districts the flu returned in April, May, and June 1919 after disappearing for a few months. This later outbreak is barely noticeable in Figure 2, however, and was much smaller than either Wave I or the 1920 outbreak; nonetheless, it may indicate some presence on the island of the "third wave" noted by Crosby (1989). Finally, the last (1920) wave apparent in Figure 2 clearly corresponds to an "echo" epidemic that also hit other parts of the world in 1920.
32 The predominance of Wave II is also reflected in our interview data. Although there were some areas where residents had extensive knowledge about Wave II (see below), we did not interview anyone who was aware that there had been more than one wave.
33 Figure 2 also clearly shows a strong relationship between influenza and pneumonia deaths. This problem was well known during the epidemic itself as indicated by the US Census Department’s annual report on mortality statistics for 1918:it is not believed to be best to study separately influenza and the various forms of pneumonia, bronchitis, and the respiratory diseases, for doubtless many cases were returned as influenza when the deaths were caused by pneumonia, and vice versa. The best method therefore seems to be to study as one group deaths from influenza and pneumonia (all forms), disregarding deaths from the other respiratory diseases, which were comparatively few. (U.S. Bureau of the Census 1920, 27)
Figure 2. Epidemic curve of influenza alone + pneumonia deaths, 1918-1920.
Display large image of Figure 2
34 As is consistent with even modern CDC and WHO practices, because of the confounding of influenza and pneumonia, in most of the analyses presented below we combine deaths from these and related causes. It should be noted, however, that although this is standard practice, combining deaths recorded as either pneumonia or influenza can introduce other problems, because pneumonia is always a relatively common cause of death during the winter, and, in almost all cases, it is impossible to determine from written death records whether a person who died from pneumonia had also been infected with influenza or whether the death was due to pneumonia alone.
Wave I
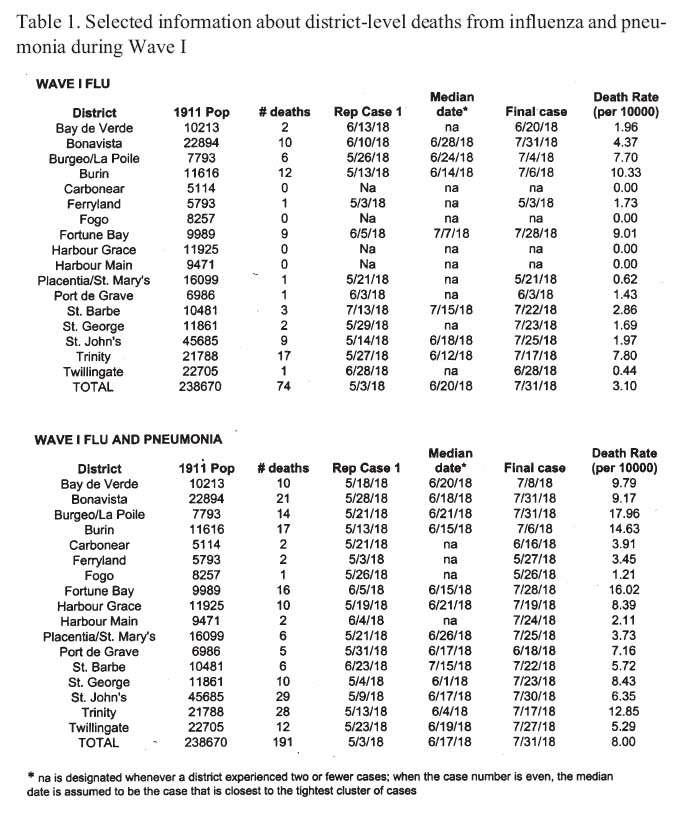
35 As in most regions of the world, Wave I in Newfoundland was fairly mild. As Figure 2 shows, it is difficult to determine exactly when the epidemic began since there are scattered flu and pneumonia deaths throughout the early part of 1918. The onset of Wave I was somewhat arbitrarily set at 1 May 1918, largely because there is a short period before this during which flu deaths were absent and they were dispersed in time throughout the first four months of 1918. The end of Wave I was set at 31 July 1918 because there is a break in recorded influenza deaths from that date until 10 September 1918. During Wave I, a total of 74 influenza deaths and 117 pneumonia deaths were recorded. Influenza deaths were recorded in all districts except Carbonear, Fogo, Harbour Grace, and Harbour Main. Pneumonia deaths were recorded in all districts, although Carbonear, Ferryland, Fogo, and Harbour Main experienced fewer than five deaths from influenza and pneumonia combined. The Trinity, Burin, and Bonavista districts recorded the highest number of deaths from influenza, but after standardization for differences in population size, Burin, Fortune Bay, and Trinity were highest. When pneumonia deaths were considered in addition to influenza deaths, St. John’s, Trinity, and Bonavista had the highest numbers of deaths, but Burgeo/La Poile, Fortune Bay, and Burin had the highest standardized rates of death (see Table 1).
36 It is impossible to know exactly when and where Wave I entered the island. The low rates of mortality during this wave meant that it may have been causing illnesses in various parts of the island well before the first death was recorded. Further, the locations of the first deaths are widely distributed across the island. Even if only flu deaths are examined, the first seven deaths after 2 May 1918 occur in four different districts — Ferryland (5/3), Burin (5/13, 5/13, 5/20, 5/23), St. John’s (5/14), and Placentia/St. Mary’s (5/21). When pneumonia deaths are included, the epidemic is even more widely distributed; during the same period seventeen deaths from pneumonia occurred in nine districts (seven of which did not record influenza deaths) — St. George (5/4, 5/6, 5/21), St. John’s (5/9, 5/11, 5/14, 5/20), Trinity (5/13, 5/16, 5/17), Bay de Verde (5/18, 5/22), Harbour Grace (5/19), Burgeo/La Poile (5/21), Carbonear (5/21), Placentia/St. Mary’s (5/23), and Twillingate (5/23). In addition, most of the remaining districts recorded their first influenza and/or pneumonia deaths only a short time later. The primary exception to this is the GNP — it is clear from both influenza alone and the combined data, that Wave I did not reach this area (a sub-district of St. Barbe) until either June or July 1918, significantly later than in the rest of the island.
Table 1. Selected information about district-level deaths from influenza and pneumonia during Wave I
Display large image of Table 1
37 According to an article in the 29 May 1918 edition of the Evening Advocate,a daily newspaper published in St. John’s, in late May 1918 a substantial outbreak occurred on the western coast of the island with "a great many people ... suffering from this ailment and several deaths" (4). The article also reported that "Hundreds of people here in the city [St. John’s] are at present laid up with La Grippe and in one firm 16 out of 20 employees are indisposed." On 30 May 1918, the Western Star, a weekly paper published in Birchy Cove, near Corner Brook on the western side of the island, noted a large outbreak of influenza with much illness but little death that affected both the coastal steamers Kyle and Fogota and the towns of Channel and Port-aux-Basques.
38 These articles confirm that the epidemic, like all influenza outbreaks, was much larger than the death records would indicate. This is also evident from the hospital records in St. Anthony. A diagnosis of influenza or related illnesses (e.g., influenzal pneumonia) was given for fourteen patients and one other had a note to indicate that he had experienced the illness during the summer of 1918 (possibly in Labrador) before he entered the hospital for other reasons. Of these fifteen patients, only four died (although one of these four was not recorded in the provincial death records and two were listed as dying from other causes, specifically meningitis and pneumonia). These hospital records only represent those individuals who were ill enough to require hospitalization — the total number of individuals sickened during the outbreak was undoubtedly substantially higher. Nonetheless, it is clear from Figure 2 that the impact of Wave I was miniscule compared to that of Wave II, to which we now turn.
Wave II
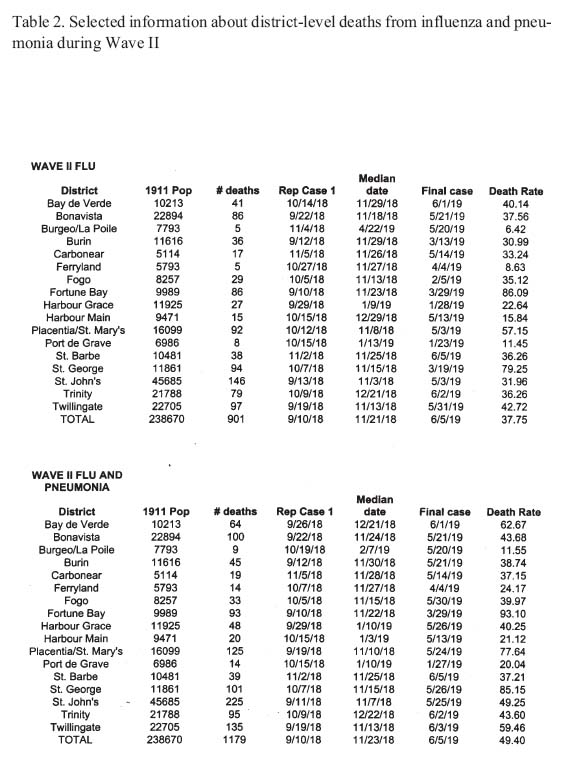
39 For the sake of simplicity, we will usually refer to the period from 10 September 1918 through 5 June 1919 as Wave II, although this period may have contained both a second and third wave in some districts. The date of 10 September 1918 was chosen for the start of Wave II because it marks the first influenza death following the end of Wave I (several pneumonia deaths were recorded in the interim between Wave I and Wave II, however). The end of Wave II was chosen to coincide with the last official government report of influenza cases and deaths during the epidemic.1 A total of 901 influenza deaths and 278 pneumonia deaths were recorded in the provincial death records during this period, representing 80 percent of all influenza deaths recorded during the three-year period from 1918 to 1920 and 62 percent of influenza and pneumonia deaths combined. The drop in percentage of pneumonia deaths when pneumonia and influenza are combined may simply be the result of a constant rate of pneumonia deaths during the times when more flu deaths are occurring. It is possible, however, that this pattern was partially a result of how causes of death were assigned — at the height of the epidemic when health authorities all over the island were well aware that an epidemic of flu was occurring, the cause of death from any respiratory illness may have been more likely to be attributed to influenza.
40 Nearly every district on the island experienced a major outbreak during Wave II. Only two districts, Burgeo/La Poile and Ferryland, recorded influenza death rates under 10 per 10,000 population; only Burgeo/La Poile recorded a death rate under 20 per 10,000 population for combined deaths from influenza and pneumonia (Table 2). The highest Wave II death rates for both influenza alone (> 80 per 10,000 population) and for influenza and pneumonia combined (> 90 per 10,000 population) were recorded in the districts of Placentia/St. Mary’s, St. George, and Fortune Bay.
41 A distinct clustering of deaths was observed between the middle of October and the end of January in all districts except Burgeo/La Poile, Ferryland, and Harbour Main. Deaths occurring in Burgeo/La Poile and Ferryland were too limited in number to generate significant clusters; deaths occurring in Harbour Main were scattered throughout the extent of Wave II and did not produce well-defined clusters. Most of the other districts recorded distinct clusters in October and November, with some experiencing second, usually smaller, clusters in December and/or January. Port de Grave was unusual in that the October/November cluster of deaths did not occur there — the only observed cluster occurred in the second half of January. Almost all districts continued to record sporadic deaths from influenza and/or pneumonia between February and June.
42 Determining when and where Wave II began in Newfoundland is a complicated task. Because there was a break in recorded influenza deaths between 31 July and 10 September 1918, it is tempting to assume that the epidemic disappeared from the island at the end of Wave I and re-entered to begin Wave II. It is important to keep in mind, however, that this midsummer break occurs only in the influenza deaths — pneumonia deaths are recorded throughout the interim period (see Figure 2). Given the confounding of pneumonia and influenza noted by the US Bureau of the Census (1920, 27) during this epidemic, it is not certain that the Spanish Flu disappeared from Newfoundland at the end of Wave I.
43 Nonetheless, in Newfoundland as well as the rest of the world, Wave II resulted in a much higher rate of severe complications and mortality than Wave I, leading Crosby (1989) to hypothesize that a mutant form of the virus arose in the interim between Wave I and Wave II. Consequently, attempts have been made to trace the Wave II "introduction" of the epidemic.
44 Several possible clues to how the second wave may have entered the island are found in an article published in the Evening Advocate on 30 September 1918:A steamer is anchored on quarantine with the yellow flag at her foremast. The censorship regulations [related to the war] prevent us from saying anything as to the port. Three of the crew were removed to hospital this a.m. and Dr. Campbell, the port physician, is enforcing the strictest regulations. In Boston and other American cities this deadly disease is now raging and many deaths have occurred. A schooner which arrived here some time ago also had several of the crew sick with what is believed to be the same sickness. (4)
45 Parsons (1992) states that "the next day, the Daily News [another local newspaper] reported that two cases from the schooner Ariceen of Twillingate were taken to hospital." The Evening Advocate of 1 October 1918 reports that the mate of the Ariceen "died early today, attacked on way from Twillingate to this port [St. John’s]" (4).
46 Our evidence suggests, however, that these cases were not likely to be the first introductions of Wave II to the island. Although nearly all influenza deaths recorded in St. John’s occurred in October or later, there was a flu death recorded there on 13 September and four pneumonia deaths were reported in the latter half of September, casting suspicion on the purported role of the boats and their sailors as presented in these newspaper accounts.
47 As is the case with Wave I, we will probably never be able to determine exactly where and when Wave II appeared on the island, especially since nonfatal cases may have been present for weeks before producing the first death. Furthermore, given the fact that most deaths from the flu were ultimately due to co-infection with pneumonia, it is also possible or even probable that at least some of the known pneumonia deaths recorded in August and early September were ultimately due to an initial influenza infection.
48 Official deaths recorded in the provincial death registers include a total of seven influenza deaths recorded during the month of September. Those deaths occurred in the districts of Bonavista, Burin, Fortune Bay, Harbour Grace, St. John’s, and Twillingate. All of these districts except Twillingate also recorded deaths from pneumonia in September and/or the last week of August. In addition, Bay de Verde, Placentia, and Trinity recorded pneumonia deaths during this time, although they did not report any influenza deaths. Given the uncertainties in diagnosis of flu as a cause of death, any of these nine districts could have been the location of the first Wave II case.
49 Where else might we be able to glean evidence related to the introduction of the second wave? The most likely mechanism by which diseases such as influenza entered Newfoundland during the early twentieth century was through interactions with sailing ships visiting the island. Consequently, the arrivals of international vessels listed in the Lloyd’s List of Overseas Shipping Intelligence have been examined to see if they can help in determining the island’s most likely influenza foci early in the second wave.
50 The vessels arriving in Newfoundland in the month between 23 August and 22 September include the following:
- August 23 — the Cascapedia arrived in St. John’s from Halifax
- August 24 — the Rijabergen arrived in St. John’s from England
- August 24 — the Faraday arrived in St. John’s from unknown location
- August 29 — the Bluenose arrived in St. John’s from Cadiz [Spain]
- August 30 — the Evelyn arrived in St. John’s from Cadiz
- August 31 — the Terra Nova arrived in St. John’s from Seville [Spain]
- August 31 — the Svalen arrived in St. John’s from Iceland
- August 31 — the Wellington arrived in St. John’s from Cadiz
- September 1 — the Mackay Bennett arrived in St. John’s from unknown location (probably local)
- September1—the Solburg arrived in St. John’s from Christiansund [Norway]
- September1—the Stella II arrived in St. John’s from Cadiz
- September2—the Freedom arrived in St. John’s from Cadiz
- September2—the Viola May arrived in St. Jacques from Oporto [Portugal]
- September2—the Gigantic arrived in Harbour Buffet from Gibraltar
- September2—the Elsie L. Corkum arrived in Burgeo from Oporto
- September 5 — the R. Fabricius arrived in St. John’s from the Faroe Islands [North Atlantic]
- September5—the Andres Roca arrived in St. John’s from Cadiz
- September4—the Jennie E. Ritcey arrived in St. Anthony from Gibraltar
- September 6 — the Robert J. Dale arrived in St. John’s from Pernambuco [Brazil]
- September 6 — the Carrie and Nellie arrived in Burin from unknown location
- September 11 — the Success arrived in Marystown from Oporto
- September 11 — the Nita M. Conrad arrived in Burin from Oporto
- September 13 — the Prospero arrived in St. John’s from Philadelphia
- September 13 — the Eskason arrived in St. John’s from Halifax
- September 16 — the Fritz arrived in St. John’s from Iceland
- September 16 — the Ludvig arrived in St. John’s from Iceland
- September 20 — the Hebe arrived in St. John’s from Iceland
- September 22 — the Cascapedia arrived in St. John’s from Halifax
- September 22 — the Sunset Glow arrived in St. John’s from Barbados
- September 22 — the Emily E. Selig arrived in Burin from Oporto
- September 22 — the Burleigh arrived in Burin from Oporto
51 As this list shows, most international ships entered Newfoundland at St. John’s, but there were a number of arrivals at other ports during early September. With one exception (the Jennie E. Ritcey that arrived in St. Anthony on the Northern Peninsula), ships arriving at ports other than St. John’s docked at towns on the southern coast — St. Jacques is in the Fortune Bay district, Harbour Buffet was at the northern end of Placentia Bay in the Placentia/St. Mary’s district, Burgeo is on the south central coast in the district of the same name, and Burin and Marystown are located on the eastern side of the Burin Peninsula in the Burin district (see Figure 1). This list suggests that if the epidemic did arrive by sea, it most likely entered the island at St. John’s, although other points of entry, especially the Burin Peninsula, are also possible.
52 What do we know about the occurrence of the epidemic in the ports from which these ships set sail? Unfortunately, examination of the epidemic experiences in these ports does not clarify the picture much. Only two ports can be removed from consideration — Iceland, which did not get the second wave until mid-October (Cliff et al. 1986) and Barbados, which remained unaffected by Wave II until late December (Killingray 1994). In addition, the timing of the second wave in the Faroe Islands and in Nova Scotia is not known. There is evidence, however, that Wave II reached Spain, Portugal, and possibly Brazil in late August (Pyle 1986; Patterson and Pyle 1991; Echeverria 2003), and during September it made its way to England, Norway, Philadelphia (Pyle 1986; Patterson and Pyle 1991), and Gibraltar (Sawchuk, pers. comm). Any one of the nineteen ships derived from these ports could have brought the second wave to the island during the critical time period.
53 International vessels were not the only vessels sailing to and from the island, however — other boats that do not appear on the Lloyd’s List might have brought the second wave to other ports, including those on the north and northeast coast of Newfoundland. These initial analyses make it clear that shipping lists, although informative, are not sufficient to pin down the epidemic’s source. Additional information to indicate whether ships’ crew members were experiencing flu-like illnesses may be available in ship’s logs and other marine archives.
54 What can we say about the overall patterns of spread once Wave II took a firm hold on the island? In general, as is typical of most infectious disease epidemics, the second wave started relatively slowly, but towards the end of the second week of October, the epidemic exploded and it became clear that this was not an ordinary influenza outbreak. Judging from the date when well-defined clusters of deaths began to be recorded, the earliest district-level epidemics occurred in St. John’s, St. George, Placentia/St. Mary’s, Twillingate, and Harbour Grace, which all showed evidence of death clusters in early to mid-October 1918. Influenza deaths did not cluster significantly in Bay de Verde district until the third week of October, but there were several pneumonia deaths in the second week of October; so if pneumonia and influenza are both considered, this district would join the group with early clusters. Deaths in Bonavista did not begin to cluster significantly until the third week of October, but rose to a peak almost immediately. Outbreaks in Placentia/St. Mary’s, St. John’s, and Twillingate also began to peak around the beginning of the third week of October. During the week of 15-21 October, eighteen deaths from influenza occurred in Placentia/St. Mary’s and fourteen deaths occurred in St. John’s; five and seven additional deaths from pneumonia occurred in Placentia/St. Mary’s and St. John’s, respectively. The following week the influenza deaths rose to 33 in St. John’s, with fifteen additional deaths from pneumonia. Twillingate recorded nineteen deaths from influenza and three deaths from pneumonia over the two-week period, and Bonavista recorded seven influenza deaths from 15-28 October, as well as another seven on 29 October. The St. George death cluster began around the same time as in St. John’s, Placentia/St. Mary’s, and Twillingate, but it did not peak until early November. Harbour Grace experienced only a very small cluster at this time.
55 Observations of the geographic locations of these districts make it clear that identifying the early foci of the epidemic will not be possible at the district level — by the middle of October Wave II was strongly affecting all regions except for long stretches of the south coast and the GNP. Future research will include analysis of the temporal and spatial distribution of deaths within districts, and it is possible that this analysis will better enable us to determine the most likely early foci for the epidemic.
56 On the island as a whole, the epidemic reached its primary peak around the middle of November,2 with nearly every district experiencing significant influenza and pneumonia death rates. It was also at this time that the median date of death was recorded for most districts (Table 2), although this corresponds to a well-defined epidemic peak within only a few districts (Fogo, Fortune Bay, St. Barbe, St. George, and Twillingate). As discussed above, there is a drop in incidence in late December, with a moderate rise again in January, but by the beginning of February, the incidence of deaths from influenza settled down to a fairly low level. Several districts contributed to the rise in January, but it was mostly fuelled by delayed epidemics in Harbour Grace and Port de Grave, and moderate increases in deaths recorded in St. John’s and Trinity. Influenza deaths continued to be reported from somewhere on the island sporadically and without breaks of any significant length through mid-summer of 1919, although as discussed above, because of the ending of official reports, deaths from 5 June through mid-summer were included within the interim between Wave II and the 1920 Echo period rather than as part of Wave II itself.
57 Interviews revealed that, as one would expect, the amount of knowledge about the flu was related to the severity with which it hit an area. In areas where no deaths were reported, such as along the Strait of Belle Isle, individuals often reported that the only thing they knew about the Spanish Flu was what they had read about in school or seen on television, and that they had never heard any stories about it being in their communities. Even in areas where a small number of Spanish Flu deaths had occurred it was common for many people to report that they had never heard about the Spanish Flu being in their area. One resident of St. Anthony was surprised to hear that there had been an outbreak in the Grenfell Orphanage because she worked as a tourist guide for the Grenfell Mission and had never heard that the Spanish Flu had been in the community.
58 This level of knowledge made the responses to questions about the Spanish Flu in areas that had major outbreaks all the more striking. In these communities we met many relatives of Spanish Flu victims, and these relatives provided many details about topics such as who had died, how the sick were cared for, and how people thought the disease had entered the community. For example, individuals in Lark Harbour (near the southern entrance to the Bay of Islands) were able to tell us about individuals who had been ill with the flu before the first resident had died, as well as detailed descriptions of the difficulty of keeping up with the burials of victims during the worst part of the epidemic. In most cases, this information would be in the form of stories passed down through the generations, but in a few cases residents were able to retell first-hand accounts from their childhood. One resident in Bonne Bay who had lived through the epidemic gave us details on how his father had travelled from house to house helping to feed and care for victims. He also reported that at the time people said the epidemic had been brought to the area by a sick sailor on a schooner from Boston.
Table 2. Selected information about district-level deaths from influenza and pneumonia during Wave II
EXPLAINING ASPECTS OF THE WAVE II PATTERNS
59 The movement of people is obviously a key to explaining the spread of the flu. Interviews revealed significant differences in the means and frequency of travel in different regions during the time of the Spanish Flu. These differences are primarily the result of proximity to the railroad, geography, and climatic variations between the northern and southern parts of the island. For example, along the northeast coast, individuals living in communities near the heads of bays (e.g., Harbour Main) reported frequent travel to St. John’s on the train. In contrast, residents living near the tips of peninsulas (e.g., Bay de Verde, Grate’s Harbour) reported that people at the time would have been more likely to take schooners to St. John’s than to travel by train, even in communities serviced by branch lines of the railroad during the time period in question. Residents on the peninsulas also emphasized that there was often more travel by boat "across the bay" than along their own coast by foot or horse cart. Residents living along the route of the main railroad did report frequent travel by train, despite also reporting how unreliable the train was during the early twentieth century.
60 Boat travel also dominated much of the travel between communities further north on the northeast coast during the fall and early winter, followed by dog-sled travel until late spring. For example, in order to visit patients during the year before the epidemic, the doctor at Pilley’s Island (west of Twillingate) was reported to have said he travelled over 5,000 miles by motor boat during the late summer and fall before the ocean froze over (Pilley’s Island Historical Center). Travel by boat was also reported to dominate the travel between communities around Bonne Bay, and along the communities on the south coast of the island.
61 Residents along the Burin Peninsula reported the use of an extensive system of walking trails interconnecting the communities on the peninsula both along the coast and across the peninsula, These trails would have been used in addition to boat travel at the time of the epidemic, with the latter being a less dominant force than in other regions. Walking between communities was also reported to have occurred between communities on the west coast of the Northern Peninsula. However, it is clear that along much of this coast the great distance between communities limited the frequency of this form of travel. This idea that walking between communities along much of the coast was a relatively rare activity was reinforced by stories told of heroic treks from one community to another to deliver medicine or otherwise avert some disaster.
62 Although the second wave devastated most areas of Newfoundland, there are two notable exceptions to this pattern. Aside from small, scattered outbreaks, the Burgeo/La Poile district on the southern coast was spared, as was the GNP (the northern part of the St. Barbe district). Why did the flu not devastate these two regions? Low population density almost certainly plays a role in this, but we have examined the potential role of three other factors as well. These factors are: 1) high levels of immunity resulting from widespread exposure to flu during Wave I, 2) a disruption in normal patterns of coastal boat traffic, and 3) proximity to the island’s rail lines. No doubt other factors played some part as well, especially given the seasonality of activities in Newfoundland’s northern climate. These three factors, however, are potentially the most important in determining how and when Wave II spread to different parts of the island.
Immunity from Wave I
63 One possibility for the low impact of Wave II on the GNP and Burgeo/La Poile regions is that these regions experienced widespread outbreaks of flu during Wave I, which led to the development of immunity to influenza that protected residents from the more severe Wave II epidemic. As discussed above, the hypothesis that immunity resulting from exposure to Wave I might help explain Wave II patterns was first proposed in the immediate aftermath of the epidemic itself (Frost 1919; Vaughan 1919; Jordan 1927; Burnet and Clark 1942; Shope 1944, 1958). Our analyses so far, however, indicate that first wave immunity is unlikely to account for the observed variations in death rates at the district level, and is also less likely to be a major explanation for the small outbreaks in the GNP and in the Burgeo/La Poile district than other potential influences.
64 The immunity hypothesis was stimulated by our analysis of in-patient hospital records from the Charles S. Curtis Memorial Hospital in St. Anthony. Unfortunately, we have not been able to uncover comparable records from the Burgeo/La Poile district or elsewhere on the island, so our discussion of this hypothesis will consider only the situation in the GNP. Analysis of the St. Anthony hospital records confirmed the conclusion from study of the provincial death records that the outbreak of Spanish Flu in the GNP was very small. Only 26 individuals were treated in the hospital for influenza during 1918 and 1919, eight of whom died from influenza or complications of influenza such as meningitis or pneumonia (in the latter cases, influenza was mentioned in the diagnosis). One significant feature of these influenza cases is that 2/3 of the 26 recorded cases and four of the eight deaths occurred in the summer of 1918, not in the fall of 1918 when the rest of the island was hardest hit. One of the remaining deaths resulted from complications of influenza contracted in May 1919, leaving only three deaths during the fall epidemic. Because the summer cases resided in nearly a dozen different GNP communities, these results suggest that St. Anthony and other communities on the GNP may have experienced a sizable flu outbreak during Wave I, especially since hospital cases and deaths almost certainly represented only a small proportion of existing cases. We have, however, no reported cases of either wave of flu in some areas of the GNP.
65 It is surprising that the proportion of hospital cases occurring during Wave I was so much higher than that occurring in Wave II, especially since in most places, both in Newfoundland and worldwide, Wave II was much more severe in its impact. This lower Wave II proportion is also surprising because we know that this wave did reach the region. Not only do we have the Wave II cases and deaths indicated in the hospital records and provincial death records, but we also know that there was a very localized severe outbreak of flu at the St. Anthony Orphanage in November 1918. This outbreak was noted in the official orphanage report for 1918 and indicated that 34 of the 37 children at the Orphanage came down with the flu at that time, although only one of those children died (Spalding 1920). That death is recorded in the hospital records, but very few of the cases in children (at most one or two) appear in those records. Additional orphanage records indicate that there were no cases of flu in these children during the summer of 1918 when there were other cases recorded in the hospital records from St. Anthony.
66 These data merely indicate the presence of the epidemic in the region during Wave II; they do not inform us about the extent of the Wave I outbreak. It is important to note, however, that both the absence of flu in the Orphanage during Wave I and the relatively minor presence of flu in the region during Wave II suggest only limited interactions between the orphanage residents and the general public. Nonetheless, even if such interactions were limited, there were individuals working at the Orphanage who lived in the community and provided a potential conduit for flu to spread from the Orphanage to the town. That this did not happen to any great degree is one of the confusing aspects of the Spanish Flu experience in St. Anthony.
67 It is unfortunate that the existing data are not sufficient to determine whether the summer outbreak was of sufficient scope to generate the level of immunity needed to protect the region from the later wave. Data on overall case numbers, including individuals who did not seek medical care, are not available for any community on the GNP, and comparable hospital data are not available for other parts of the island, so we have no knowledge of potential case rates for Wave I in any other part of the island. Further, when death data are aggregated at the district level, in many areas presence of the first wave was followed by major outbreaks of the second wave. It is possible that stronger evidence for the role of immunity will be uncovered with a finer level of geographic analysis (i.e., by comparing locations of Wave I and Wave II deaths at the community level), but it is also possible that this evidence will further weaken the immunity hypothesis. A definitive answer to this question, if it can be found, must wait for future research.
Boat Traffic
68 Interviews throughout the island revealed that many people saw boat travel as a major means by which contagious diseases had been spread in the past. For example, in Bay Roberts several people told us of a story, whose details were vague, about three sailors who arrived at the port dying of disease and were buried somewhere in the vicinity in an unmarked grave. The association between boats and the spreading of disease is also clearly reflected in the many newspaper articles about boats being held in port and/or being placed in quarantine during the time of the Spanish Flu. Such concern is justified because the movement of ships internationally and along the coast of the island of Newfoundland almost certainly did play an important role in determining patterns of spread of the Spanish Flu epidemic.
69 As indicated in the list of international arrivals given above, ships coming to the island from international ports only rarely docked in the southern and western ports, and coastal boat traffic was heaviest in those areas hardest hit by the epidemic, including the northeast coast from St. John’s to the Baie Verte peninsula and the coastal regions of the Placentia/St. Mary’s and Fortune Bay districts. Both daily newspaper reports on coastal boat movements and interview data collected during the summer 2006 field season indicated that in a typical week during the early part of the twentieth century approximately half a dozen coastal boats would move between communities along the northeast coast, and about half that number travelled along the southern coast from Placentia through Fortune Bay. Rates of travel were lower elsewhere — typically only two boats per week travelled along the rest of the south coast, and only one boat regularly travelled along the west coast of the GNP. The inconsistency between the low coastal boat traffic along the three west coast bays (St. George’s Bay, Bay of Islands, and Bonne Bay) and the high number of flu deaths recorded from those areas is likely due to nearby railway lines (see below).
70 Because of the large role coastal boats likely played in the spread of the second wave, we collected data on all of their movements during that time period. Daily reports of coastal boat movements and other local news related to the flu were published in the Evening Advocate, and these reports have made it possible to identify several specific ways that the flu may have moved, and may have been prevented from moving.
71 Coastal boat travel between the island of Newfoundland and communities in Northern Labrador has been definitively shown by Budgell (1996) to have carried the Spanish Flu to Labrador. The vessel most strongly implicated in this was the Harmony, which left St. John’s on 20 October on its way to the Northern Labrador coast. Two other vessels, the Seal and the Sagona, also made similar trips and may have been responsible for the epidemic making it to other Labrador communities. The important thing about these ships for our purpose is that they made stops in Newfoundland ports while on their travels between Newfoundland and Labrador. For example, on 28 October 1918, the Evening Advocate carried this report from the Seal, which was attempting to return from Labrador to St. John’s:October 28 [the Seal] detained on way south from Labrador at Catalina, Port de Grave, Hr. Grace, Bay Roberts, and other points landing crews brought from various ports on Labrador. Crew not allowed in any of ports. Heavy snows bring winter to Labrador. (6)
72 The Evening Advocate published a regular column called "Reid’s Ships and Trains" that appeared in nearly every edition. According to these reports, the Sagona made two trips back and forth to Labrador during Wave II and so could have carried the flu from St. John’s to the northeast coast of Newfoundland and to Labrador . The Sagona left St. John’s on 18 September on her way to Trinity, left Trinity on 19 September going north, left Wesleyville on 20 September, and was reported to be north of Twillingate on 23 and 24 September, before she sailed north of St. Anthony to Labrador on 25 September. On 7 October, the paper reported that the ship was on her return from Labrador to St. John’s. On 15 October the Sagona once again left St. John’s and sailed for Labrador. Ports of call along the way included Trinity, Catalina, and St. Anthony. On 30 October it was reported that the ship would be returning to St. John’s the evening of 31 October after going as far north as Hopedale, Labrador, and that she had been in St. Anthony again on 29 October on her way back to St. John’s. On 16 November the Sagona set sail again, this time for Burin. She returned to St. John’s on 19 November carrying reports of eight flu deaths in Harbour Breton and Sagona Island. There is no clear evidence that the ship carried the flu on its travels from either Labrador or Harbour Breton/Sagona Island, but it is possible.
73 In addition to the Harmony, Seal, and Sagona, other coastal boats that might have spread the flu along the northeast coast include the Dundee, Earl of Devon, Clyde, Susu, Petrel, and Home. Reports in the Evening Advocate during the autumn of 1918 describe how two of these six boats, the Petrel and the Home, were detained along the way because they were carrying people sick with the flu. Besides the Sagona, boats that travelled regularly along the south coast included the Fogota, Argyle, and Portia. Both the Fogota and the Argyle experienced disruptions in their service because of the flu. Illness was not reported on the Fogota, but this vessel was prevented from making its normal stop at Placentia on 25 October because of the flu, and the Argyle was held at Placentia for nearly two weeks in November due to flu in that community.
74 While the rest of the island was serviced by multiple vessels, the long west coast of the GNP was only regularly serviced by one coastal boat, the Ethie. Reports about the Ethie in the Evening Advocate during this period highlight the potential impact this relative lack of coastal boat traffic had on epidemic spread. Although such newspaper reports were commonplace at the time, hindsight imbues these particular reports with life or death drama. On 23 October the newspaper reported that the Ethie was about to leave Humbermouth in the influenza-ravaged Bay of Islands (St. George district) for the Strait of Belle Isle in the northern half of the St. Barbe district, and the start of this trip was confirmed the following day. However, the 25 October edition reports, "The SS Ethie has been hung up at Curling [in the Bay of Islands] the past three or four days owing to the difficulty in getting a crew because of the ‘flu’ epidemic" (8). On 29 October, the newspaper reported that the Ethie was back at Humbermouth because the influenza was so common in that area that they were unable to replace the sick crew. On 1 November the Ethie travelled from Humbermouth to Curling where it was stopped again because most of the crew were ill. Eventually the coastal boat, the Diana, was sent to replace the Ethie and on 1 November she was reported ready to travel northward to the Strait of Belle Isle on 2 November. The Ethie continued to be detained at Humbermouth until all of its crew recovered. It finally headed northward to the Strait of Belle Isle on 15 November.
75 If the Ethie had not been delayed in the Bay of Islands due to the sick crew, the pattern of the Spanish Flu on the island of Newfoundland might have been very different. A hint of the potential impact of Ethie’s postponed sailing is eerily noted in the Evening Advocate on 29 November. Upon the ship’s return back to Bay of Islands after finally making the trip northward, the crew is reported commenting that they feared the dire consequences of a Spanish Influenza outbreak in the Strait of Belle Isle because "In the Straits there is no medical service, and we would draw the attention of the authorities to this condition and trust an effort will be made to relieve the situation at once" (8). That such a feared epidemic never developed in the Straits may be due to the postponement of the Ethie’s voyage to the Strait of Belle Isle at a crucial time.
Railway Traffic
76 When asked about the possibility of the spread of the Spanish Flu by railroad travel, residents acknowledged this possibility. In contrast to boat travel, however, they only rarely brought up the idea that the train would have transported the Spanish Flu. This relative unconcern about railroad traffic in spreading the Spanish Flu is also seen in newspaper articles from the time period. While regularly presenting stories about ships being held up due to sick crew and/or being put under quarantine, the only attention given to trains was the reporting of their daily travel back and forth across the island from St. John’s to Port-aux-Basques, and along the spurs to Carbonear (west of St. John’s) and Placentia (the southern shore). This lack of concern about trains spreading the disease was even apparent when train travel was mentioned in a story about a recent outbreak of influenza. For example, in an article entitled "That Sickness at Port au Basques" the reporter states that "We also interviewed parties who came in from there by last evening’s express train, and were told that what is supposed to be a very severe type of influenza is prevalent at both Channel and Port au Basques, and many people are down with it." The article gives no indication of concern that these passengers may have just transported the disease, however (Western Star, 30 May 1918).
77 The apparent lack of concern is interesting because railroad travel was clearly of importance in the spread of the second wave through the island. The major rail line linked St. John’s in the northeast corner of the island to Deer Lake, Corner Brook, and Port-aux-Basques in the west. Branch lines led from the main line to most of the Avalon Peninsula, the Bonavista Peninsula, and Fortune Bay (see Figure 1). Interview data and newspaper reports both indicate that there was daily railway traffic throughout the northeast area of the island and from Placentia to St. John’s. There was also daily travel in both directions from Port-aux-Basques to St. John’s, and information collected in interviews during the summer of 2006 suggests that this travel probably directly contributed to the large epidemic that hit the St. George’s Bay area during Wave II. Interview data also indicate that train travel may have contributed indirectly to the epidemic at Bonne Bay in the southern St. Barbe district, because people would often travel by train to the Bay of Islands in the St. George district and then by boat to Bonne Bay.
78 The role of train travel in spreading the flu across the island, and to communities that might have otherwise escaped Wave II, is also supported by interview data and by the occurrence of deaths in a string of inland towns along its route (e.g., South Branch, Spruce Brook). For example, the Western Star reported that "Up to Saturday night there had been fourteen deaths from the influenza epidemic between Deer Lake and Spruce Brook, not including those at Lark Hr., and since several more deaths have been reported" (6 November 1918).
CONCLUSIONS
79 These analyses of data gathered during 2005 and 2006 provide a detailed picture at the district level of the timing and location of recorded deaths from the Spanish Flu on the island of Newfoundland. They also provide some information on the manner in which the first and second waves may have travelled around the island. Future analyses of the data are planned to improve our knowledge about these events. The death records are available not only by district, but also by specific place of death (PANL, Reels 32 and 33), and we are currently performing a finer grained analysis that will enable us to localize outbreaks within districts. This analysis will be especially useful for districts such as St. Barbe, where significant heterogeneity exists between the northern and southern parts of the district. Combining the community-level data with the daily movements of the coastal boats and trains will greatly increase our ability to identify the most likely mechanisms for spread of the epidemic around the island, since we may be able to tie outbreaks in individual communities to known visits of boats and trains. We have also obtained copies of official reports of cases and deaths occurring in different communities during the epidemic. The Acting Medical Officer prepared these reports for the Colonial Secretary and they are available from mid-November 1918 through the beginning of June 1919 (PANL, GN 2/5, Special File 352-A). Although the accuracy of these reports is questionable (see n. 1), as long as they are treated cautiously, they can provide us with additional information on illness levels that can supplement the information on nonfatal cases collected at the Charles S. Curtis Memorial Hospital in St. Anthony.
80 The research presented here is useful not only for understanding the impact of the 1918-1919 flu epidemic, but also for understanding the potential for infectious disease spread in modern times. The predominant modes of travel in Newfoundland have changed during the last century — the railroads are gone and have been replaced by automobiles, coastal boat travel is much less important in most parts of the island, and the average person travels much more frequently and over longer distances. But many of the modern highways still follow much the same route as the railroads once did and vast stretches of the southern coast are still dependent on coastal boats. Furthermore, although the frequency and modes of travel are somewhat different, they still serve to carry people from one place to another and thus set the stage for disease spread across space. Understanding in some detail how such activities influenced an historical epidemic at a time when life was somewhat simpler provides an important base from which to understand the impact of such activities in modern times. We still do not fully understand why some parts of the island were affected by the Spanish Flu pandemic more severely than others, but the insights we gain from trying to understand these patterns can be brought to bear on the question of how future epidemics may spread, and may help us to develop more effective strategies for prevention and control of epidemics to come.
Acknowledgements
This research was supported by grants from the Government of Canada-Canada Studies Faculty Research Grant Program, from the University of Missouri Research Board, from the University of Missouri-Columbia Research Council, and from the University of Missouri Anthropology Department. We would like to thank the over 200 people across the island of Newfoundland who made our research possible by taking time out of their days to speak with us, making introductions, assisting us with the archives, and inviting us in for tea. Special thanks go to Dr. Peter Sinclair for sharing his hospitality and knowledge, to Amber Palmer for her tremendous assistance in the collection of interview and archival data, to Gary Newell, Barbara Blake, and Kweku Dankwa and others at the Grenfell Regional Health Services for facilitating the collection of hospital records and records pertaining to the activities of the Grenfell Mission in St. Anthony, to Melanie Tucker for assistance at The Rooms in St. John’s, and to Steve and Stephanie Tanner for their invaluable help in collecting archival data in St. Anthony and St. John’s. palmerct@missouri.edu sattenspiell@missouri.edu c.l.cassidy@gmail.comReferences Cited
Armstrong C, Hopkins R. 1921. An epidemiological study of the 1920 epidemic of influenza in an isolated rural community. Public Health Reports 36:1671-1702.
Barry JM. 2004. The Great Influenza: The Epic Story of the Deadliest Plague in History. New York: Viking.
Budgell A. 1996. The Spanish Influenza of 1918 in Okak and Hebron, Labrador. Paper presented at the Inuit Studies Conference, St. John’s, Newfoundland, August 1996.
Burnet FM, Clark E. 1942. Influenza: A Survey of the Last 50 Years in the Light of Modern Work on the Virus of Epidemic Influenza. London: Macmillan.
Cliff AD, Haggett P, Ord JK. 1986. Spatial Aspects of Influenza Epidemics. London: Pion.
Crosby AW. 1989. America’s Forgotten Pandemic: The Influenza of 1918. Cambridge: University of Cambridge Press.
Dull HB, Dowdle WR. 1980. Influenza. In Maxcy-Rosenau Preventive Medicine and Public Health. Last J. (ed.) New York: Appleton-Century-Crofts, 110-121.
Echeverria B. 2003. Spanish influenza seen from Spain. In The Spanish Influenza Pandemic of 1918-19. H. Phillips and D. Killingray (eds.) London: Routledge, 173-190.
Fahrni M. 2004. "Elles sont partout ..." — les femmes et la ville en temps d’épidémie, Montréal, 1918-1920. Revue Histoire Amérique Française 58(1):67-85.
Firestone M. 1967. Brothers and Rivals: Patrilocality in Savage Cove. Newfoundland Social and Economic Studies, ARDA Project No. 1016, No. 5. St. John’s, Newfoundland: Memorial University of Newfoundland.
Frost WH. 1919. The epidemiology of influenza. Public Health Reports 34:1823-1861.
Herda PS. 2000. Disease and the colonial narrative: the 1918 influenza pandemic in western Polynesia. New Zealand Journal of History 34(1):133-144.
Herring DA. 1994. "There were young people and old people and babies dying every week": the 1918-1919 influenza pandemic at Norway House. Ethnohistory 41:73-105.
Herring DA, Sattenspiel L. 2003. Death in winter: Spanish flu in the Canadian subarctic. In The Spanish Influenza Pandemic of 1918-19. H. Phillips and D. Killingray (eds.) London: Routledge, 156-172.
Johnson NPAS, Mueller J. 2002. Updating the accounts: global mortality of the 1918-1920 ‘Spanish’ influenza pandemic. Bulletin of the History of Medicine 76:105-115.
Jones EW. 2002. Contact across a diseased boundary: urban space and social interaction during Winnipeg’s influenza epidemic, 1918-1919. Journal of the Canadian Historical Association NS 13:119-139.
Jones EW. 2005. "Co-operation in all human endeavour": quarantine and immigrant disease vectors in the 1918-1919 influenza pandemic in Winnipeg. Canadian Bulletin of Medical History 22(1):57-82.
Jordan EO. 1927. Epidemic Influenza: A Survey. Chicago: American Medical Association.
Kelm ME. 2000. British Columbia First Nations and the influenza pandemic of 1918-19. BC Studies 122:23-47.
Killingray D. 1994. The influenza pandemic of 1918-1919 in the British Caribbean. Social History of Medicine 7(1):59-87.
Kolata G. 2005. Flu: The Story of the Great Influenza Pandemic of 1918 and the Search for the Virus that Caused it. New York: Touchstone.
Langford C. 2002. The age pattern of mortality in the 1918-19 influenza pandemic: an attempted explanation based on data for England and Wales. Medical History 46:1-20.
Lloyd’s List of Overseas Shipping Intelligence, January-December 1918. Maritime History Archive. St. John’s Newfoundland, Memorial University.
Luk J, Gross P, Thompson WW. 2001. Observations on mortality during the 1918 influenza pandemic. Clinical Infectious Diseases 33:1375-1378.
MacDougall H. 1985. The fatal flu. Horizon Canada 8:2089-2095.
MacDougall H. 2006. Toronto’s health department in action: influenza in 1918 and SARS in 2003. Journal of the History of Medicine and Allied Sciences 62(1):56-89.
Markham N. 1986. The north coast of Labrador and the Spanish influenza of 1918. Them Days 11(3):3-4.
McCracken K, Curson P. 2003. Flu downunder: a demographic and geographic analysis of the 1919 epidemic in Sydney, Australia. In The Spanish Influenza Pandemic of 1918-19. H. Phillips and D. Killingray (eds.) London: Routledge, 110-131.
Noymer A, Garenne M. 2003. Long-term effects of the 1918 ‘Spanish’ influenza epidemic on sex differentials of mortality in the USA: exploratory findings from historical data. In The Spanish Influenza Pandemic of 1918-19. H. Phillips and D. Killingray (eds.) London: Routledge, 202-217.
Olson DR, Simonsen L, Edelson PJ, Morse SS. 2005. Epidemiological evidence of an early wave of the 1918 influenza pandemic in New York City. Proceedings of the National Academy of Sciences USA 102:11059-11063.
Oxford JS. 2000. Influenza A pandemics of the 20th century with special reference to 1918: virology, pathology and epidemiology. Reviews in Medical Virology 10:119-133.
Oxford JS. 2001. The so-called Great Spanish Influenza Pandemic of 1918 may have originated in France in 1916. Philosopical Transactions of the Royal Society of London Series B—Biological Sciences 356:1857-1859.
Oxford JS, Sefton A, Jackson R, Innes W, Daniels RS, Johnson NPAS. 2002. World War I may have allowed the emergence of "Spanish" influenza. The Lancet Infectious Diseases 2:111-114.
Parsons WD. 1992. The Spanish Lady and the Newfoundland Regiment. Paper presented to the St. John’s Medical History Society, May 1992. http://www.vlib.us/medical/parsons.htm, updated 1 May 2006, accessed 5 November 2006.
Patterson KD, Pyle GF. 1983. The diffusion of influenza in sub-Saharan Africa during the 1918-1919 pandemic. Social Science and Medicine 17(17):1299-1307.
Patterson KD, Pyle GF. 1991. The geography and mortality of the 1918 influenza pandemic. Bulletin of the History of Medicine 65:4-21.
Pettigrew E. 1983. The Silent Enemy. Canada and the Deadly Flu of 1918. Saskatoon: Western Producer Prairie Books.
Phillips H, Killingray D. (eds.) 2003. The Spanish Influenza Pandemic of 1918-19. London: Routledge.
Potter CW. 2001. A history of influenza. Journal of Applied Microbiology 91:572-579.
Provincial Archives of Newfoundland and Labrador [PANL]. Death Records 1918-1919. Reels 32 and 33.
Provincial Archives of Newfoundland and Labrador [PANL]. GN 2/5. Special File 352-A, Colonial Secretary’s Department. "Correspondence Re: Outbreak of Epidemic Spanish Influenza in Newfoundland." November 1918-June 1919.
Pyle GF. 1986. The Diffusion of Influenza: Patterns and Paradigms. Totowa, NJ: Rowman & Littlefield.
Reid AH, Taubenberger JK, Fanning TG. 2004. Evidence of an absence: the genetic origins of the 1918 pandemic influenza virus. Nature Reviews Microbiology 2:909-914.
Sattenspiel L, Herring DA. 1998. Structured epidemic models and the spread of influenza in the Norway House District of Manitoba, Canada. Human Biology 70:91-115.
Schoenbaum SC. 2003. Transmission of, and protection against, influenza: epidemiologic observations beginning with the 1918 pandemic and their implications. In The Spanish Influenza Pandemic of 1918-19. H. Phillips and D. Killingray (eds.) London: Routledge, 241-251.
Shope RE. 1944. Old, intermediate, and contemporary contributions to our knowledge of pandemic influenza. Medicine 23:422-423.
Shope RE. 1958. Influenza: history, epidemiology, and speculation. Public Health Reports 73:165-178.
Shortridge KF. 1999. Pandemic influenza: a zoonosis? Seminars in Respiratory Infections 7:11-25.
Smallman-Raynor MR, Cliff AD. 2004. Impact of infectious diseases on war. Infectious Disease Clinics of North America 18:341-368.
Spalding K. 1920. Report of the orphanage. Among the Deep Sea Fishers 17(4).
Taubenberger JK, Morens DM. 2006. 1918 influenza: the mother of all pandemics. Emerging Infectious Diseases 12(1):15-22.
Taubenberger JK, Reid AH, Fanning TG. 2005. Capturing a killer virus. Scientific American 292(1):48-57.
Taubenberger JK, Reid AH, Janczewski TA, Fanning TG. 2001. Integrating historical, clinical and molecular genetic data in order to explain the origin and virulence of the 1918 Spanish influenza virus. Philosophical Transactions of the Royal Society of London Series B—Biological Sciences 356:1-10.
U.S. Bureau of the Census. 1920. Mortality Statistics, 1918. Washington, DC: Government Printing Office.
Vaughan VC. 1919. "Discussion of a paper by F.C. Gram, ‘The influenza epidemic and its after-effects in the city of Buffalo’." Journal of the American Medical Association 73:890-891.
Vaughan WT. 1921. Influenza: an epidemiologic study. American Journal of Hygiene Monograph Series No 1.
Zylberman P. 2003. A holocaust in a holocaust: the Great War and the 1918 ‘Spanish’ influenza epidemic in France. In The Spanish Influenza Pandemic of 1918-19. H. Phillips and D. Killingray (eds.) London: Routledge, 191-201.
Notes