Articles
Comparing Ceramic Assemblages in Terms of Expenditure:
A Case Study from Lower Fort Garry*
Abstract
Economic evaluations of ceramics have traditionally been made by using experience and intuition. The results of these methods may be accurate, but are nevertheless, unquantifiable and unverifiable. A more rigorous method has been used to study the archaeologically retrieved ceramics from several structures at Lower Fort Garry, Manitoba.
Objects were assigned values derived by indexing prices from nineteenth century invoices and price lists. Two different sets of values or indices were generated: those based on differences in the cost of decoration, and those based on differences in the cost of shape. The average value of the objects in an assemblage could then be compared with that from any other structure. Whereas intuitive methods of evaluating the ceramic assemblages from Lower Fort Garry had earlier found no distinguishable differences among them, the methods described in the paper reveal statistically significant differences in the average cost of ceramic items in the assemblages.
Résumé
D'habitude, on évalue la valeur des pièces en céramique en faisant appela l'expérience et à l'intuition. Les résultats obtenus sont peut-être exacts, mais rien ne permet de les vérifier ni de les quantifier. Dans cet article, l'auteur utilise une méthode plus rigoureuse pour établir la valeur des pièces en céramique trouvées lors de fouilles archéologiques à Lower Fort Garry au Manitoba.
Les pièces sont évaluées en indexant les coûts figurant sur les factures et les listes de prix du XIXe siècle. L'auteur établit deux séries de valeurs ou d'indices: l'une basée sur les coûts établis à partir de différentes décorations de pièces et l'autre fondée sur les coûts établis à partir des diverses formes de pièces. La valeur moyenne d'un ensmble d'objets peut ensuite être comparée à celle de tout ensemble provenant d'une autre source. Alors que les méthodes intuitives d'évaluation des ensembles de pièces en céramique de Lower Fort Garry n'ont jamais permis d'établir de différences notables de coûts, les méthodes ici décrites révèlent des différences importantes en ce qui a trait au coût moyen des diverses pièces faisant partie d'ensembles.
1 The ceramics from Lower Fort Garry form a large, well-identified collection from structures that are completely excavated. In view of this, it was disappointing not to discern obvious differences in the ceramic assemblages of the various structures, which indeed served widely different functions (Chism 1972). Even the dwellings — the governor's residence, the farmer's house, the miller's house, and the troop barracks/canteen — were occupied by those of presumably unequal social class. The distribution of the ceramics at the site appeared remarkably "democratic."
2 The ceramics were evidently bought at the fort store which was supplied from 1835 until the twentieth century by the Staffordshire pottery of Spode/Copeland. The Spode/Copeland material, with few exceptions, was transfer-printed, white earthenware of good quality. Although a few shell-edge plates and sponged or stamped tea ware articles were retrieved, there were no concentrations of these cheaper articles. Similarily, the occasional porcelain object or expensive serving piece was found in most of the structures (Sussman 1972, 1979).
3 It was thought that a statistical analysis of the distribution of ceramic traits such as fabric, decorative method, pattern, and function might bring to light differences in trait distribution and that these differences might relate to social or economic factors. Two major problems arose in attempting to use such distribution for social interpretation: (1) the artifact traits by themselves had no measurable social or economic meaning; and (2) even if a trait could be measured in terms of value, there were too few of these traits per structure for a high level of statistical significance.
4 Both difficulties were overcome by employing a concept introduced by George L. Miller of Parks Canada. In his paper, "Classification and economic scaling of 19th century ceramics," Miller (1980) translated the cost of certain ceramic objects into indices based on the cheapest object available in that category. For instance, in the Staffordshire price fixing agreement of 1846, the least expensive type of bowl is plain white or cream-coloured earthenware (called in the trade CC). The price of this bowl is given an index of 1. The type of bowl next in price, dipped or slip-decorated earthenware, is 1.20 times as expensive as the CC bowl, so its index is 1.20; and so on.
5 Although Miller restricted his comparisons between contexts to the occurrence of a particular category of objects, such as the cups or the bowls or plates, by using an index it is possible to combine the various objects and compare assemblages because the index number no longer represents an object. It now represents a decision to spend a certain amount above the cheapest available. In fact, there is no reason to restrict the assemblages to ceramics. Any commodity may be included if there are price lists available.
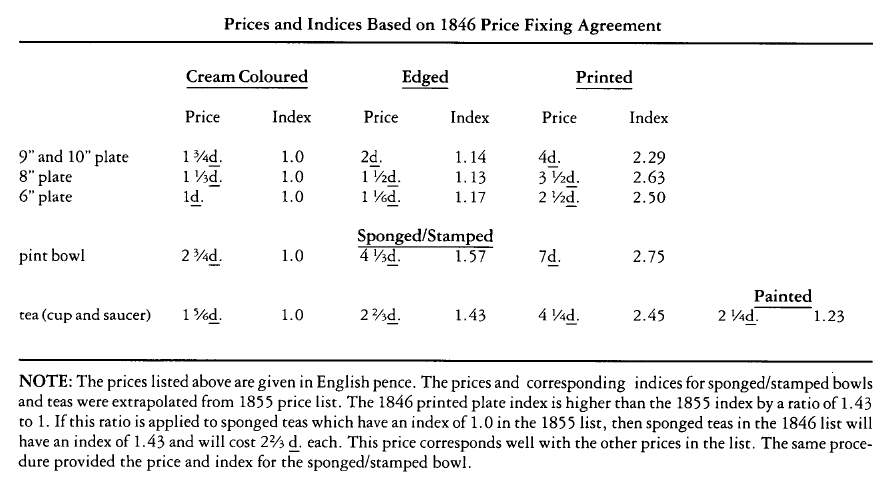
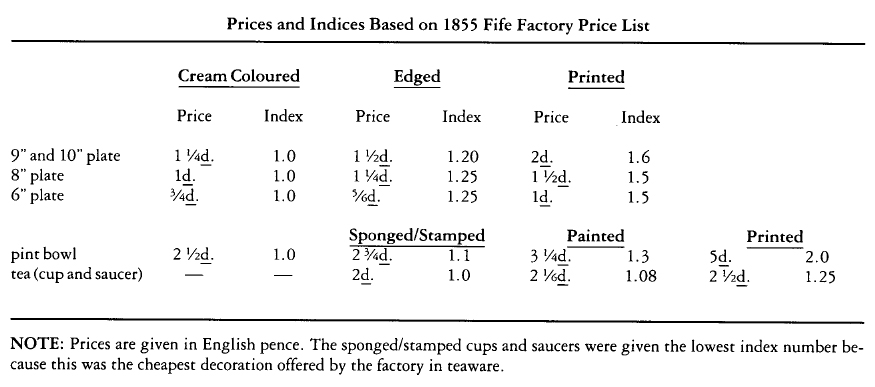
6 Prices used must coincide in date with the objects being compared. For the Lower Fort Garry ceramics, I used a Staffordshire Potteries price fixing agreement for 1846 (Mountford 1975) and an 1855 price list for the Fife Pottery, Scotland (Finlayson 1972). The indices generated by these prices are listed in appendices A and B. A set of indices for the 1860s would also have been applicable; however, no post-185 5 price lists have been found to date that include prices for transfer-printed ceramics.
7 Difference in price for a particular object is almost invariably based on the method used to decorate it. This makes decoration a reliable trait for ceramic comparisons. Because there was so little variety in the ceramics from Lower Fort Garry, however, it was felt that comparisons of assemblages using decorative method alone would not clearly illustrate economic differences. The decision to purchase an object with a particular function is an economic as well as simply a functional decision. Shapes such as serving dishes, platters, tureens, pitchers, teapots, chamber pots, and ewers are not strictly required for eating and drinking and cost four to forty times as much as the basic shapes: plate, cup and saucer, and bowl.
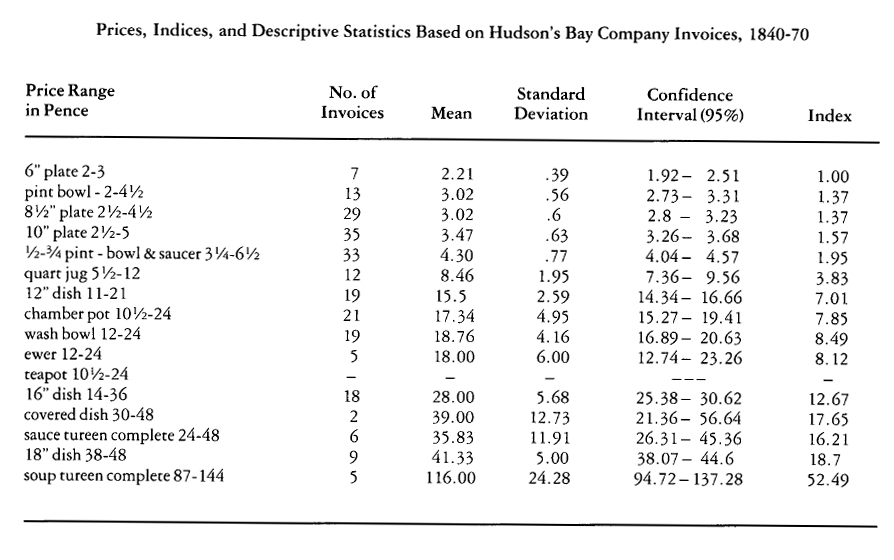
8 It was decided to compare the ceramics from various structures using indices based on the cost of the shapes found. The shape prices were extracted from detailed invoices of shipment from the Copeland firm to the Hudson's Bay Company from 1840 through 1870 (Hudson's Bay Company Archives). Using these yearly invoices gave the advantage of a price list that actually corresponded to the objects on the site. However, it was not possible to match particular artifacts with any particular year's invoice. Only a few of the patterns found on the site were specifically named in the invoices, and these patterns were generally listed in several years' invoices, some patterns being shipped every year for twenty-one years! For this reason, indices were generated using the mean price of each shape. Appendix C is a list of the shapes, descriptive statistics of the prices of these shapes including range, mean, standard deviation, and confidence interval, and the indices generated.
Methodology
9 Four structures were selected from the site for comparison. They yielded similar numbers of ceramic artifacts and were dissimilar in function and social class. They are the Big House which served as residence for the governor and later other administrators (fifty objects), the fort store (ninety-three objects), the farmer's house (forty-three objects), and the troop canteen and barracks (forty-six objects).
10 Only earthenware tableware and toilet ware were selected for comparison. Price lists for other ceramic types, such as porcelain tableware, crocks, flowerpots, and toys are not yet available. For the same reason, all ceramics dating after 1870 were eliminated. In the selection of cups and saucers, only one of the pairs was selected, since cups and saucers are sold as a unit in all price lists. The numbers of objects listed above refer to the selected samples.
11 A résumé of the steps taken to this point may be helpful. All the ceramic artifacts have been identified and dated. Selections have been made of those artifacts to be compared. Each object has been matched with three different prices, and each price has been translated into an index number.
12 When the data is entered into the computer each record constitutes one object and each object is described by four pieces of numerical information: (1) the context number, an arbitrary number given to each of the site structures; (2) decoration index number based on the 1846 price list; (3) decoration index number based on the 1855 price list; (4) shape index number based on the Hudson's Bay Company invoices, 1840-70. The following standard statistical tests were then applied to the data:
- One-way analysis of variance. This test was applied to determine whether or not there were any statistically significant differences between the mean index values of any of the contexts (Snedecor and Cochran 1967).
- Least significant difference. This test was applied to discover where the differences occurred (Ibid).
Results
13 In interpreting the results of these tests, we chose to apply a level of significance of 95 per cent. Thus, "statistically significant differences" means that there is at least a 95 per cent probability that the differences between assemblages were not caused by chance.
Comparison of Contexts Using Decoration Index from 1846 Price List
14 Analysis of Variance Test:
15 Least Significant Difference Test:
16 From highest to lowest, the mean index values were Big House (2.384), fort store (2.354), farmer's house (2.232), and troop canteen (2.208).
Comparison of Contexts Using Decoration Index from 1855 Price List
17 Analysis of Variance Test:
18 Least Significant Difference Test:
19 From highest to lowest, the mean index values were Big House (1.511), fort store (1.392), farmer's house ( 1.384), and troop canteen (1.305).
Comparison of Contexts Using Shape Index, 1840-70
20 Analysis of Variance Test:
21 Least Significant Difference Test:
22 From highest to lowest, the mean index values were Big House (3-759), troop canteen (2.375), fort store (1.9), and farmer's house (1.852).
Summary of Results
23 The results of comparisons using decoration indices from two price lists are similar. The order of the contexts, from highest to lowest average expenditure per object, is the same. The relationships between the fort store, farmer's house, and troop canteen are the same. The only difference is rank of ceramics from the Big House. When the 1855 price list was used, the ceramics from the Big House had a significantly higher average price than those from any other context, whereas with the 1846 price list its ceramics were not significantly higher priced than those from the fort store.
24 It was not necessarily expected that the results of comparisons using shape indices would be the same as those using decoration indices. A household which selects ceramics with more costly decoration may or may not select ceramics with more costly shapes. The Big House residents selected both more expensively decorated objects and objects in more expensive shapes. The difference between the ceramics from the Big House and those from the other contexts is more marked using shape than using decoration indices. The Big House mean ceramic index is 58 per cent higher than the mean index next in rank, and over 102 per cent higher than the lowest mean index. Using decoration, the largest difference between the Big House and any other context was 15 per cent.
25 The economic ranking among the other three structures was less clear-cut. When considering shapes, the troop canteen, fort store, and farmer's house had the same average expenditure per ceramic object. When considering decoration, the mean ceramic index of the fort store's assemblage was significantly higher than that of the troop canteen.
Conclusions
26 The aim of this project was to discover economic differences among the ceramic assemblages from various structures at Lower Fort Garry. The project was also an experiment in using two types of price indices to achieve this end. The results demonstrate that economic differences can be discovered using these tools.
27 I would advocate caution, however, in interpreting the differences. Three sets of price indices were used, and the results were somewhat different in all three cases. If the decoration index from the 1846 price list had been the only one used, the Big House ceramics would not have been differentiated from the ceramics from the fort store. If the decoration index from the 1855 price list had been the only one used, the Big House ceramics would have been differentiated. What interpretation can one make using both lists? Since the ranking from highest to lowest was the same using both sets of decoration indices, and since the test using shape index indicated clearly that the average price of the Big House ceramics was higher than that from any other context, I would, with some reservation, acknowledge the Big House assemblage as distinct from that of the fort store. It is evident that more price lists are required if we are to use with confidence indices based on decoration as indicators of economic decisions. The lack of adequate price lists in the 1860s is a particular weakness. Researchers such as George Miller of Parks Canada and Ian Kenyon of the Ontario Ministry of Culture and Recreation are currently engaged in collecting nineteenth- and twentieth-century price information.
28 The test using indices based on the prices of shapes was devised for three reasons. From 1840 through 1870, the ceramic tableware offered for sale at the fort store was, according to the Hudson's Bay Company invoices of shipment, limited almost exclusively to transfer-printed earthenware. The acquisition of tableware with this decoration did not, therefore, reflect a simple economic decision to pay more for articles of this type rather than cheaper equivalents. The cheaper equivalents were not available at the fort store. Although shell edge, stamped, sponged, and undecorated wares could have been, and obviously were, acquired elsewhere, one should not expect the proportion of transfer-print to more cheaply decorated wares to be a reliable reflection of choice among the residents at Lower Fort Garry.
29 The second reason also stems from the nature of the site and from the Hudson's Bay Company invoices of shipment. One of the major problems in using price lists to interpret archaeological material is the strong possibility that the articles described and given prices in the written document may not be equivalent to the excavated objects. For example, the 1846 price fixing agreement used in this project specified the minimum price to be charged for ceramic items. There were no restrictions on maximum price. Different patterns produced by the same decorative method were often priced differently, according to the popularity of the pattern, the amount of decoration, or the skill required to apply it. By using only one price list to evaluate excavated material, one risks ignoring actual differences in the prices of objects which share the same method of decoration. This problem did not arise in using the Hudson's Bay Company invoices. The articles listed were sold at the fort store, purchased by the residents of Lower Fort Garry, and retrieved in excavation of the site. Moreover, articles decorated with transfer-print were priced the same, regardless of pattern or colour. It seemed absurd to ignore such a complete and relevant price list when trying to discern economic differences among assemblages of the very material described in the list.
30 The final, and most important reason for applying the test was simply to discover what, if any, economic differences would come to light by using the occurrence of differently priced shapes as a basis for comparing ceramic assemblages. The fact that the average price of shapes from the Big House was so much higher than that from any other structure, while the assemblages from the remaining three structures were not significantly different from one another strengthened two previously held suppositions: (1) a certain repertoire of ceramic shapes is basic to a household and is not sensitive to economic choice; and (2) if a ceramic assemblage does contain shapes outside this repertoire, the high cost of most of these shapes will cause a large jump in the average cost per item in the assemblage.
31 In the case of the Big House, the test revealed a large economic difference that would not have been discovered by testing with decoration prices. On the other hand, the tests using decoration prices revealed economic differences among the farmer's house, fort store and troop canteen ceramics that were unapparent when using shape prices.
32 Any interpretation of the economic status of occupants of a site will not, of course, rely solely on the costliness of the ceramics they used. The testing procedures outlined in this paper are applicable to material culture other than ceramics and to data gathered from sources other than archaeologically retrieved artifacts. If assemblages of table glass, food (based on faunal remains), furniture, etc., were ranked using price indices, a more complete picture of the economic status and spending habits of the people associated with the assemblage would emerge.
APPENDIX A
APPENDIX B
APPENDIX C
 Display large image of Table 3
* For his assistance with the statistical tests and his guidance in and around the computer, I wish to thank Jason Henderson of Parks Canada. I also wish to express my gratitude to George Miller, also of Parks Canada, for laying the groundwork for this project and for his advice and interest.