Refereed Articles
Population Change and Population Health:
A Spatio-temporal Analysis of New Brunswick Communities
This paper considers population change in small areas of New Brunswick in relation to community-level population health indicators. Population forecasts developed via regionally constrained models are presented in conjunction with health indicators data for health zones and health council communities. Temporal and spatial variation in health indicators is discussed in relation to where population growth is forecasted to occur, and where there will be continued population decline. The results show that population growth is forecasted only for the areas surrounding Fredericton, Moncton, and Saint John, with most other areas predicted to experience continued population decline, even if the province as a whole does not. These forecasts are within a context where communities with declining population are also those with lower values across a range of non-medical determinants of health. These results present an opportunity to focus provincial strategies based on the combination of observed trends of population change and geographic inequalities of population health.
Le présent document porte sur l’évolution démographique dans des petites régions du Nouveau-Brunswick relativement aux indicateurs de santé de la population au niveau communautaire. Les prévisions démographiques élaborées à partir de modèles à contraintes régionales sont présentées en même temps que les données sur les indicateurs de santé pour les zones de santé et les collectivités du Conseil de la santé. On aborde la variation temporelle et spatiale des indicateurs de santé par rapport aux endroits où l’on prévoit une croissance démographique et aux endroits où l’on s’attend à un déclin démographique continu. Les résultats montrent que l’on prévoit seulement une croissance démographique dans les environs de Fredericton, de Moncton et de Saint John et que l’on s’attend à ce que la plupart des autres régions subissent un déclin démographique continu, même si tel n’est pas le cas pour l’ensemble de la province. Ces prévisions s’inscrivent dans un contexte où les collectivités dont la population est en baisse sont aussi celles qui ont des valeurs inférieures dans une gamme de déterminants de la santé « non médicaux ». Ces résultats permettent de mettre l’accent sur des stratégies provinciales basées sur la combinaison des tendances observées du changement de la population et des inégalités géographiques de la santé de la population.
Introduction
1 Health indicators are foundational statistics that provide a basis for comparing the factors that affect the health of a population (Wolfson; Parrish). They allow for the measurement, monitoring, and comparison of key factors that influence the health of a population and the health care system. Using health indicators, it is possible to compare geographic areas, population groups, time periods, and the quality of health services. Indicators are tools that can show communities, governments, health care organizations, and providers where they’ve been, where they’re headed, and where they need to improve. At the national level, a core set of health indicators has been produced since 2003 by Statistics Canada and the Canadian Institute for Health Information (Statistics Canada, “Health Indicators”; Canadian Institute for Health Information). Provincially, the New Brunswick Health Council (NBHC) produces a collection of health indicators that are roughly comparable at the health region and health council community level (New Brunswick Health Council, Recognizing and Focusing). This paper uses select health indicators to examine the nature of population health and population change in New Brunswick at multiple geographic levels. While data on population health and population change are presented regularly by Statistics Canada and by the New Brunswick Health Council, they have not yet been compiled and analysed in depth across multiple periods.
2 The population of New Brunswick has the dubious distinction of being one of the unhealthiest in Canada compared to other provinces (New Brunswick Health Council, Recognizing and Focusing; Office of the Chief Medical Officer of Health). The overall view of health within New Brunswick is low, with only 52 per cent of the population perceiving their overall health as very good or excellent, compared to 59 per cent in all of Canada (Statistics Canada, “Health Indicator Profile”). For mental health, only 64 per cent of New Brunswickers indicate that their mental health is very good or excellent, compared to 71 per cent overall in Canada. These differences are also evident for health status indicators, where 61 per cent of the New Brunswick population is overweight or obese compared to 52 per cent in Canada. Similar differences are present in non-medical determinants of health, health system performance, and community and health system characteristics.
3 Concurrently, the population of New Brunswick has been undergoing profound demographic shifts over the past decades (Peters, New Brunswick Population Snapshot). Much of the province has experienced prolonged real decline in total population numbers, with high levels of out-migration in the younger age groups and negligible in-migration. This has resulted in an aging population that is declining below the rate of replacement across most of the province. Population growth in New Brunswick is concentrated in only a few core areas, namely, the cities of Fredericton, Moncton, and the communities outside of Saint John. Growth in these areas has been largely due to internal migration, with low rates of interprovincial in-migration and immigration. In recent years, the rate of international immigration has begun to increase, with new arrivals focused in and around the three primary cities. The objective of this paper is to use a community-level population health approach to examine health indicators for New Brunswick communities alongside processes of population change and scenarios for future population growth. In this approach, health is a capacity or resource rather than a state of being, akin to being able to pursue one’s goals, to acquire skills and education, and to grow. This generalized definition recognizes a range of social, economic, and environmental factors that contribute to health (Public Health Agency of Canada). This concept of health has been articulated as “the capacity of people to adapt to, respond to, or control life’s challenges and changes” (Frankish et al. 6). Furthermore, a population health perspective is concerned with the social structural nature of health influences and, although health outcomes are ultimately experienced by individuals, the sphere of influence that shapes health experiences goes beyond the characteristics of the individual (Dunn and Hayes).
4 The geographic patterns of health inequalities and demographic change in New Brunswick are similar, with regions measuring lowest in key population health indicators also experiencing the largest population decreases. The observed combination of lower health measures in a context of regional population decline in many areas of the province points to the potential need for policy intervention, whether it be in terms of population growth or community health. While the causal relationship between health outcomes and demographic change are complex, the correlation of these elements can provide insight for communities and policy-makers to support local populations in areas undergoing negative population change in the face of lower health outcomes.
Background
5 A community-based population health approach is useful for linking the overall well-being of a population and population change. At a basic level, the definition of population health combines the concept of population (groups of individuals, organized into different units of analysis, including common characteristics or geographies) and health (the state of complete physical, mental, and social well-being, and not merely the absence of disease or infirmity) (Kindig). Communities can be thought of similarly to populations, as a group of people that can be defined by location, race, ethnicity, or other common bonds, particularly those with shared geography (Turnock). Thus population health is a framework for thinking about why some populations are healthier than others, as well as the policy development, research agenda, and resource allocation that flow from it (Young). Approaching the health of communities in this manner allows for the study of how policies and interventions at the individual and social level could be related to patterns of health determinants over the life course and health outcomes and distribution within a population (Kindig and Stoddart). A goal for this paper is to examine the inequalities of health indicators at the community level in relation to historic and forecasted population change.
6 Health inequalities simply refer to measurable differences between individuals, groups, or communities. In contrast, health inequities are systematic differences in health status and outcomes between groups, where in general the more socially disadvantaged experience poorer health (Kindig). Inequities are rooted in economic and social structures and are persistent throughout the life course and across generations. Inequities affect people from all social groups and profoundly shape the public health and health-care system. The selected health indicators presented here provide a community-level view of health inequalities, where the spatial variation of selected indicators is presented across New Brunswick. Given the descriptive nature of this paper, it is not possible to determine to what extent observed differences are systematic and linked to economic and social structures. However, identification of geographic areas where observed values are low across multiple indicators can help target policies and community-based interventions.
7 New Brunswick’s changing population is often the focus of public debate in the province. The last decades have seen a variety of studies, policies, and workshops to discuss the rate of population growth, levels of out-migration, population aging, labour force change, skills shortages, and rising immigration, among others (Population Growth Secretariat, It’s Time to Act; Be Our Future; Government of New Brunswick, New Brunswick Population Growth Strategy 2014–2017; We Are All in This Together; Be Independent; Economic and Social Inclusion Corporation). The population growth rate in New Brunswick has been one of the lowest in Canada, with the population increasing from 516,000 in 1951 to 751,000 in 2011. Since 1971, the growth rate has been high variable, with a peak of 1.85 per cent per annum in 1975 to a low of -0.33 per cent per annum in 2006. Growth years occurred in 1975, 1983, 1991, and 2009. Times of lowest growth were in 1981, 1986, 1998, 2006, and 2013.
8 The population shifts were largely due to changing interprovincial migration rates, which are highly variable in New Brunswick. Interprovincial migration rates in New Brunswick have been shown to be correlated with labour market changes elsewhere in Canada (Peters, Population Forecasts). New Brunswick’s declining population growth rate has been identified as a key challenge to sustaining and growing the province and its economy, and has been identified as being linked to changing requirements for health services (Peters, Small Area Population Forecasts). New Brunswick has one of the fastest aging populations, lowest number of youths settling in the province, and lowest immigration rates in Canada (Government of New Brunswick, New Brunswick Population Growth Strategy 2013–2018). Given the small size of the province, even a moderate fertility rate does little to increase the total population, as deaths now outnumber births, resulting in population decline, not considering migration. These demographic shifts have significant implications for the labour force, the tax base, health care, long-term care, and social support (Post-Secondary Education, Training, and Labour).
9 Population change and population health are interrelated through a variety of mechanisms. At the most basic level, population change is a function of births, deaths, and migration. The number of births in a region is determined by the age-specific fertility rate, or the number of births that occur in each age group and the number of children born to each individual. The timing, frequency, and fecundity are in turn related to the income, education, and marital status of women. The number of deaths is related to overall health, availability of health services, and age profile. These two components are influenced by migration, with out-migration, in-migration, immigration, and emigration of individuals within the province, between provinces, and internationally.
10 Within a population health framework, however, population change is related to health outcomes through upstream patterns of health determinants over the life course. This is most evident in New Brunswick at the community level, where long-term population decreases and continued out-migration of the working-age population have left communities struggling to provide basic services and maintain existing infrastructure with a smaller tax base. These same communities that are in decline often measure lower across a range of population health indicators, further illustrating inequalities between New Brunswick communities. The Results section of this paper highlights the differences between communities across the province within a context of low or negative population growth, and provides some options for how these inequalities could be addressed by a population health approach.
Data and Methods
11 The analysis presented here combines population health, census, and demographic indicators from multiple sources, for multiple time periods, and at multiple levels of geographic aggregation. The objective is to provide a comprehensive view of population health and population change for New Brunswick communities. To accomplish this, data from several comparable sources were combined: census information, health indicators from Statistics Canada, health indicators from the New Brunswick Health Council, and small-area population forecasts.
Interprovincial and Health Zone Comparisons
Census indicators
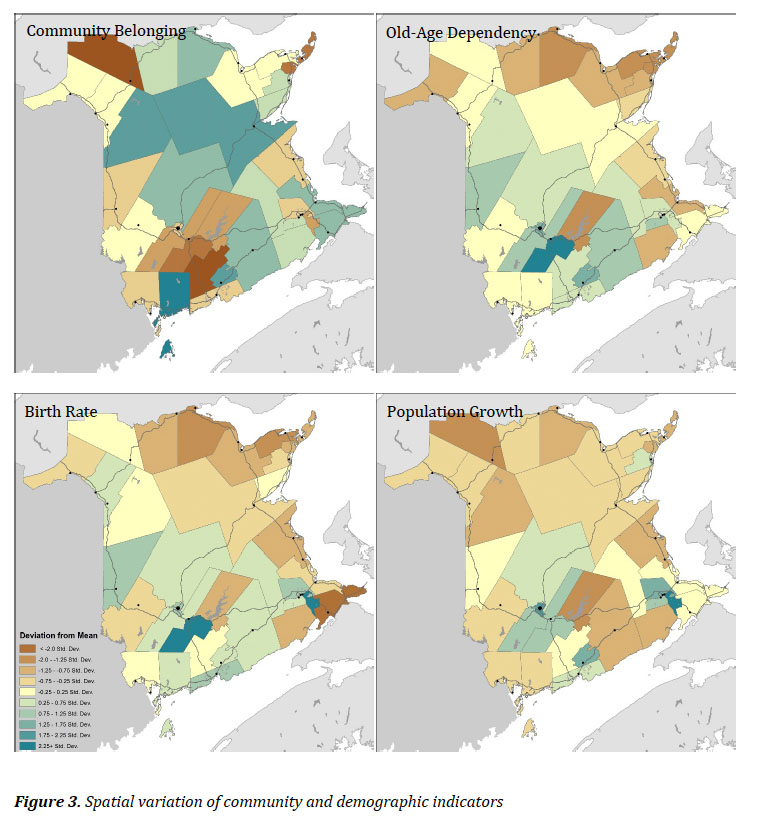
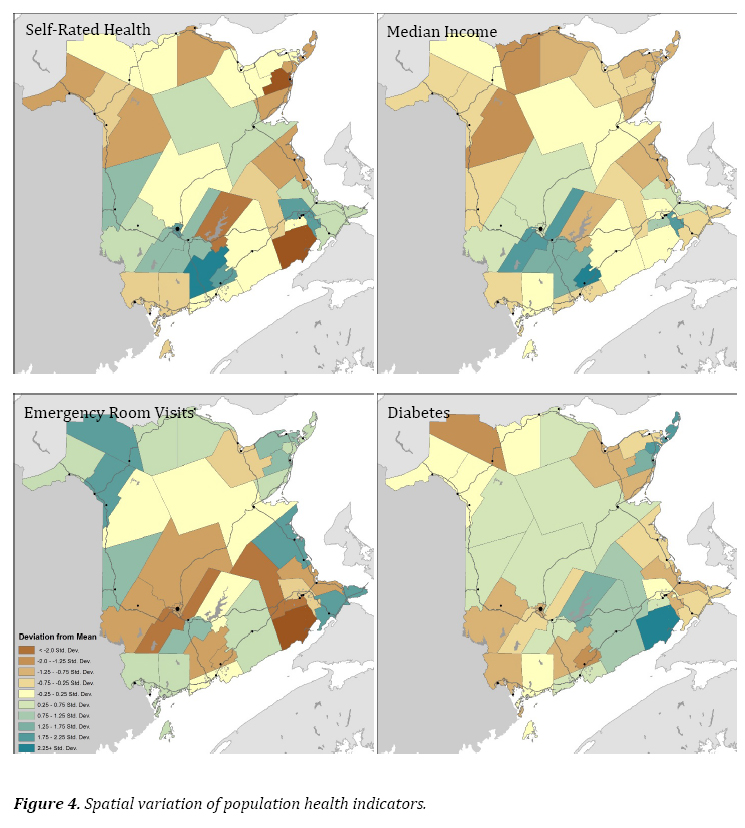
12 Several key census indicators were calculated for New Brunswick using data from the computing in the health and social sciences (CHASS) data server at the University of Toronto, with data available through the Statistics Canada data liberation initiative (DLI). Data were extracted for all of Canada, Newfoundland and Labrador, Prince Edward Island, Nova Scotia, New Brunswick, and for each of the seven health zones in New Brunswick. Data elements were selected where they were available for the 2001 and 2006 Censuses as well as the 2011 National Household Survey (NHS). While there may be some variation in results expected between the 2011 NHS and the 2006 Census, at the provincial level this would be minimal, and for health zones the response rates were sufficient to provide reliable results (Statistics Canada, “National Household Survey”).
13 Six census indicators were included: the proportion of the population fifteen years and over with a post-secondary degree, the long-term unemployment rate (fifteen years and over), the percentage of children living in low-income families, the percentage of renters spending more than 30 per cent of their income on shelter costs, the mean percentage of government transfers as a percentage of total income, and the percentage of lone-parent families. The percentage of the population over fifteen years of age with a post-secondary certificate, diploma, or degree is a common measure of educational attainment and socioeconomic status. Certificates, diplomas, and degrees include those from apprenticeship or trades’ certificates or diplomas; college, CEGEP, and other non-university certificates and diplomas; and university certificates, diplomas, and degrees. The long-term unemployment rate is the number of unemployed persons (persons looking for work) who last worked one year prior to the census day, expressed as a percentage of the labour force. The long-term unemployment rate may extend the susceptibility to poor health over short-term unemployment. The percentage of children living in low-income families is calculated as the population of children aged seventeen and under living in economic families who spend 20 percentage points more than average of their before-tax income on food, shelter, and clothing. This is a common measure of children at risk. Households, especially for renters, are considered to have affordability problems if more than 30 per cent of household income is spent on housing costs, at which point it is likely that inadequate funds will be available for other necessities such as food, clothing, and transportation. The percentage of government transfers as a percentage of total income refers to all cash benefits received from federal, provincial, territorial, and municipal governments during the previous year. The rate of lone-parent families refers to the percentage of all families living in private households that are headed by lone parents. These families may be more susceptible to economic insecurity and poverty.
Demographic indicators
14 Demographic indicators at the provincial and health region level are drawn from the University of Toronto CHASS data server and come from the 2001 Census, 2006 Census, 2011 NHS, and Health Indicators program (Statistics Canada, “National Household Survey”). The indicators selected are as follows: the population growth rate, the percentage of internal migrants in the previous five years, the percentage of immigrants, the old-age dependency ratio, and the age-standardized mortality rate. Included with the demographic indicators is the percentage of the population with high or very high community belonging, available from Statistics Canada (“Health Indicator Profile”).
15 The population growth rate is the number of individuals in an area in the census reference year compared to the prior census. The size and changing nature of a population impacts the health status of a region and its need for health services, in addition to providing the essential denominator for most indicators. Community belonging is the proportion of the population aged twelve and over who reported a sense of belonging to their local community as being very or somewhat strong. There is a high correlation between sense of community belonging with physical and mental health. The proportion of internal migrants in the previous five years refers to the number of people residing in a given area who lived elsewhere five years prior. Migrants include internal migrants who moved to a different city, town, township, village, or reserve within Canada. Communities with a high proportion of migrants may be more unstable than those with a lower proportion. Likewise, communities with little in-migration could be in decline with little replacement of population that is moving out. The proportion of immigrants is the proportion of the total resident population born outside of Canada. Relative to the native-born population, immigrants—particularly non-European ones—generally have a longer life expectancy, lower risk of certain chronic conditions, and lower hospitalization rates (Carrière, Peters, and Sanmartin). The old-age dependency ratio is a common measure of aging, calculated as the population sixty-five years and older divided by the population between fifteen and sixty-four years of age. People aged sixty-five and are more likely to be socially and/or economically dependent on working-age Canadians, and they may also put certain additional demands on health services. Finally, the agestandardized mortality rate is an aggregate measure of population health and one of the primary components of population change. Age-standardized mortality relates to the overall health of the population and is similar to what is measured by life expectancy.
Population health indicators
16 Health indicators at the provincial and health zone level are taken from the Statistics Canada health indicators program (Statistics Canada, “Health Indicator Profile”). Data from a national-level health indicators program have been available for results beginning in 2003, and available annually since 2007. These data are available at the health region level, which in New Brunswick corresponds to the seven health zones. The health indicators program includes data on health status (well-being, health conditions, human function, and deaths), non-medical determinants of health (health behaviours, living and working conditions, personal resources, and environmental factors), health system performance (acceptability, accessibility, appropriateness, continuity, effectiveness, and safety), and community and health system characteristics (community, health system, and resources). Health indicators are drawn from data programs at Statistics Canada and the Canadian Institute for Health Information (CIHI), based on information from the Census, vital statistics, the cancer registry, the Canadian Community Health Survey (CCHS), and hospital discharge abstract databases (DAD), and from crime and labour force data.
17 The measures selected for this analysis include the following: the proportion of the population reporting very good or excellent self-perceived health, the proportion reporting as overweight or obese, the proportion reporting a diagnosis with diabetes, the age-standardized cancer incidence rate, the caesarean section rate, and the rate of ambulatory-care sensitive (ACS) conditions. Self-perceived health is an indicator of overall health status and refers to the perception of a person’s health in general. It can reflect aspects of health not captured in other measures, such as undiagnosed disease, potential severity, positive health status, physiological well-being, and social and mental function. The proportion of the population who are overweight or obese is calculated from the body mass index. People who report being either overweight or obese may be at risk for certain health problems. The diabetes incidence rate refers to the population who report having been diagnosed by a health professional as having diabetes, including women who reported being diagnosed with gestational diabetes. Diabetes may lead to a reduced quality of life and complications from heart, liver, and kidney diseases. The age-standardized incidence rate for cancers includes all new primary sites of malignant neoplasms per 100,000 population. The caesarean section rate—the proportion of women giving birth by means of caesarean section—is a measure of the appropriateness of health services. Rates that are above the recommended rate of 25 per cent may indicate a lack of appropriate prenatal services. The ACS rate for conditions where appropriate ambulatory care prevents or reduces the need for admission to hospital is calculated per 100,000 under age 75 years. ACS conditions are generally considered to be a measure of access to appropriate primary health care.
Population change and population forecasts
18 Within New Brunswick, a major factor in evaluating community-level population health is the nature of population change. Given the persistent population decreases for many New Brunswick communities, this factor may influence multiple aspects of the population health framework, including living and working conditions, community characteristics, and ability to provide adequate health system resources.
19 To evaluate population change, community-level population forecasts were developed for the same geographic boundaries as the New Brunswick health council communities. The calculated forecasts use a simplified small-area forecasting model that requires only census population counts for three prior census periods and external population forecasts at the provincial level (Wilson). The model selected was the variable share of growth model, with forecasts calculated from 2011 to 2031. Population counts at the community level were calculated using 1991, 2001, and 2011 geographic attribute files, aggregated at the community level. Correspondence between enumeration area (EA) or dissemination area (DA) identifiers from geographic attribute files and community identifiers were calculated in ArcGIS 10.4 using a point-in-polygon approach.
 Display large image of Table 1
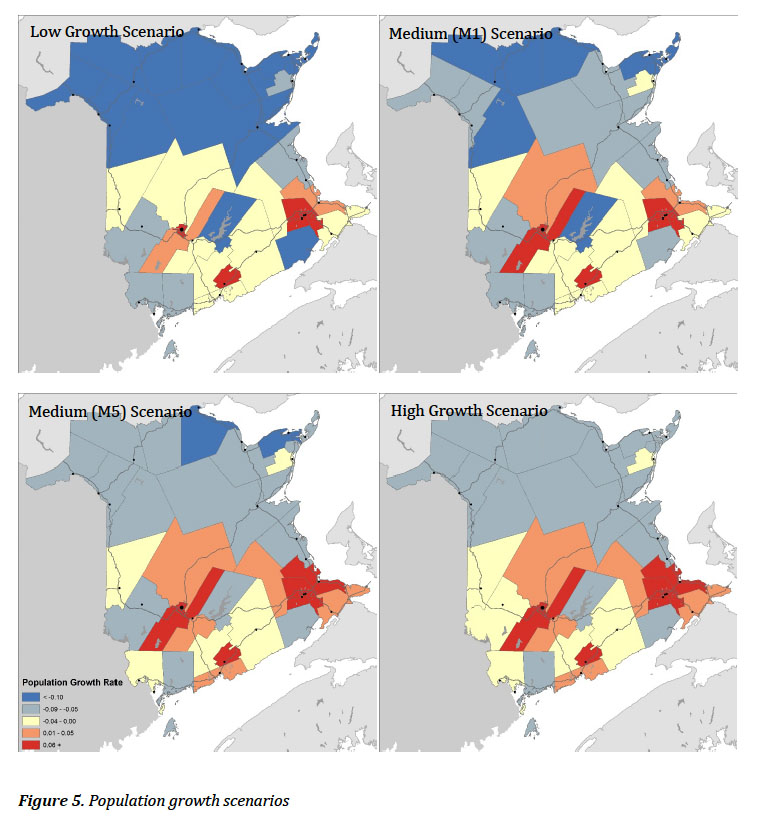
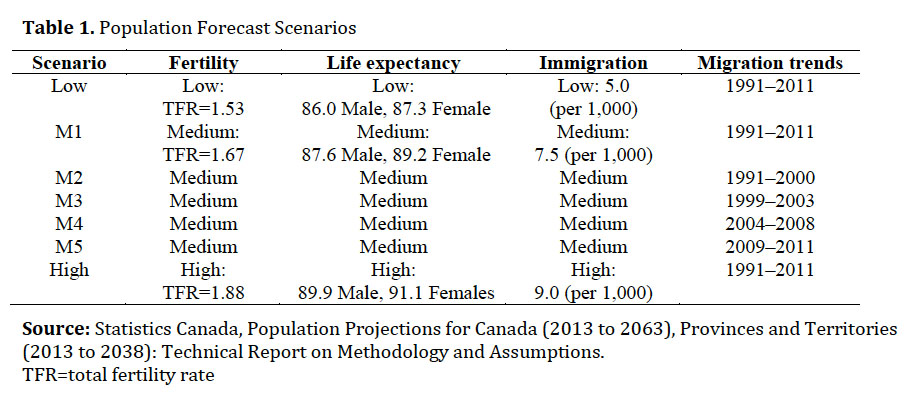
20 External population forecasts at the provincial level were used to constrain overall population growth to a range of scenarios developed using the full range of demographic components. Statistics Canada produces population forecasts following each census period, and the 2013 population forecasts were used here to constrain overall provincial growth to selected scenarios, where the growth in each community was allowed to vary independently (Statistics Canada, Population Projections). Table 1 shows the different scenarios developed by Statistics Canada. For this analysis, the low-growth, M1, M5, and high-growth scenarios are presented. The low-growth scenario uses low fertility, low life expectancy, low immigration, and migration trends from 1991–2011. The M1 scenario uses medium fertility, medium life expectancy, medium immigration, and migration trends from 1991–2001. The M5 scenario differs from the M1 scenario in that it uses the most recent migration trends from 2009–2011, which was a period of higher in-migration and lower out-migration following the 2008 financial crisis. The high-growth scenario uses high fertility, high life expectancy, and high immigration, and migration trends from 1991–2011.
21 For selected indicators described above, the spatial variation by New Brunswick Health Council community boundaries was also calculated and mapped. First, community and demographic indicators including community belonging, old-age dependency ratio, birth rate, and population growth rate (2001– 2011) are compared. Second, the spatial variation of population health indicators was calculated, including self-rated health, median income, emergency room visits, and the self-reported diabetes incidence rate. These indicators correspond to those calculated at the health zone level, but are recalculated and presented for health council communities by the New Brunswick Health Council (Community Profiles 2014). Each of the above indicators was mapped by standard deviation, between −2 standard deviations and +2.25 standard deviations from the mean.
Results
22 Table 2 shows a selection of key population indicators drawn from the Census between 2001 and 2011, for Canada, the Atlantic provinces, and New Brunswick health zones. As is evident from these measures, New Brunswick and Atlantic Canada fare worse than the Canadian average on most indicators. For the proportion of the population with a university degree, New Brunswick is markedly lower than the rest of Canada and the lowest in Atlantic Canada. In 2011 the long-term unemployment rate was lower in New Brunswick than in other Atlantic provinces, but was higher than Canada as a whole. The proportion of children in low-income households was below the national figure for all three periods, but higher than PEI. The proportion of renters spending more than 30 per cent of their income on shelter was lower than in Canada as a whole, reflective of the generally lower rents across Atlantic Canada in 2011. However, the proportion of income from government transfers is higher in Atlantic Canada than nationally, with 16.5 per cent of income in New Brunswick coming from government transfers. The proportion of lone-parent families in New Brunswick was higher in New Brunswick than in Canada as a whole in 2001, although lower than in Nova Scotia and PEI. By 2011, the proportion of lone-parent families in Canada had risen to 16.3 per cent, but in New Brunswick it had remained stable at 16.1 per cent.
23 Within New Brunswick health zones, the census results are more variable than between the Atlantic provinces. For most indicators, the Fredericton and Moncton health zones have the strongest results, with Campbellton and Miramichi health zones being the poorest off. In the Fredericton and Moncton zones, the proportion of university graduates is near the Canadian average. However, in the Edmundston zone, the proportion was at 38.9 per cent for 2001 and increases only to 53.0 per cent by 2011. In the Miramichi zone, long-term unemployment was persistently high across all three census periods, with 11.2 per cent unemployment in the 2011 census compared to 4.9 per cent in the Saint John zone. At a provincial level, the proportion of children living in low-income families was about the same as the Canadian average; however, in all three periods the Campbellton health zone has the highest values, where 23.5 per cent of children lived in low-income families in 2011. The highest proportion of renters spending more than 30 per cent of their income on shelter was in Campbellton, although this was not excessively higher than the national average. The areas with the highest proportion of income coming from government transfers were in Campbellton and Bathurst, at 24.5 per cent. There are large differences in the proportion of lone-parent families between New Brunswick health zones. The lowest rates were in Fredericton and Edmundston, at 14.5 per cent and 14.0 per cent, respectively. The highest rates were in Campbellton, Bathurst, and Miramichi.
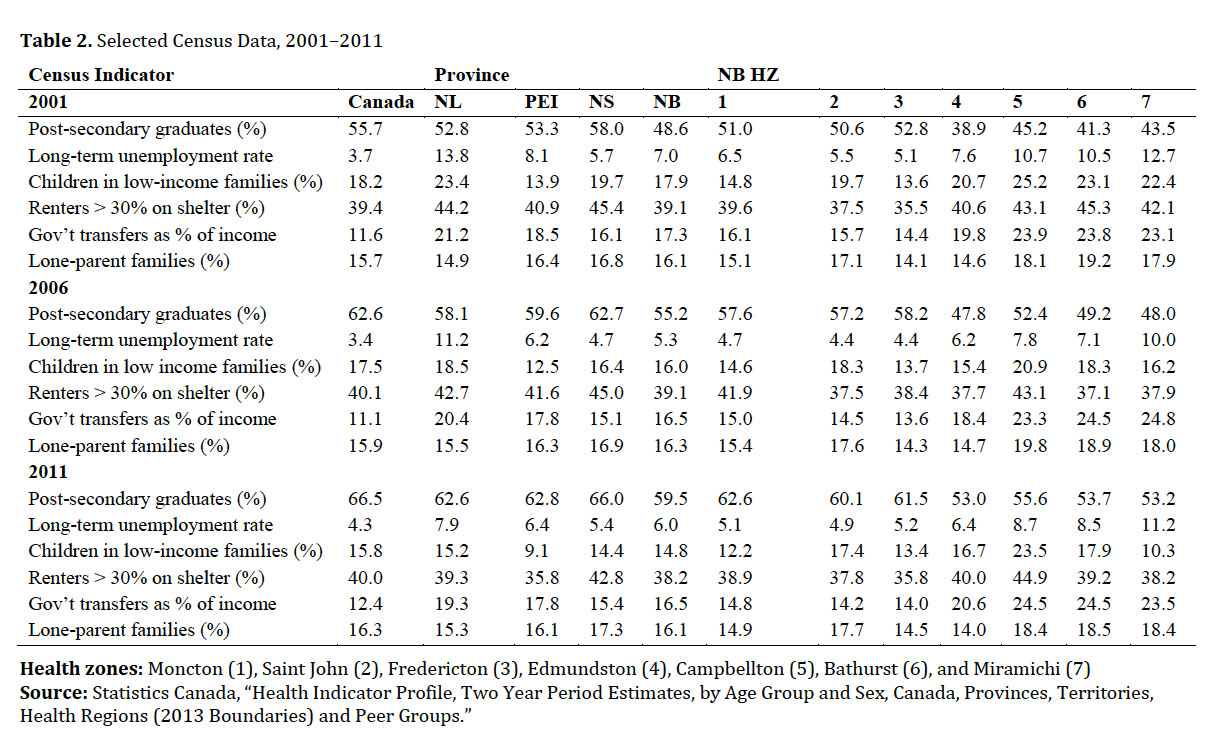 Display large image of Table 2Health zones: Moncton (1), Saint John (2), Fredericton (3), Edmundston (4), Campbellton (5), Bathurst (6), and Miramichi (7)
24 Table 3 shows key demographic indicators. While the population growth rate in Newfoundland and Labrador was lower in 2001 and 2006, New Brunswick had a lower growth rate in 2011, at only 1.3 per cent. The proportion of the population who indicated strong or very strong community belonging is higher in Atlantic Canada than in Canada as whole, with the highest rates in Newfoundland and Labrador. The rates of internal migrants were lower in Atlantic Canada for 2001 and 2006, owing to high rates of out-migration. However, in 2011 these rates were higher than Canada as a whole due to high rates of return migration following the 2008 financial crisis. Immigration within Atlantic Canada is noticeably lower than in the rest of Canada. While 20.6 per cent of the population in Canada were immigrants in 2011, only 3.9 per cent of the population in New Brunswick were immigrants. The above figures are within a context of an aging population: the old-age dependency ratio in New Brunswick, at 16.2, is one of the highest in Canada. Aging is coincident with decreasing mortality rates and longer life expectancies, with New Brunswick having the lowest age-standardized mortality rate in Atlantic Canada in 2011, although still higher than in Canada as a whole.
25 As with the census numbers, the indicators for community and demographic change are highly variable within New Brunswick. The lowest growth (highest decrease) is found in the Bathurst health zone, which has had a consistently decreasing population since 1996. The fastest growing area is the Moncton health zone, growing above the national average between 2006 and 2011. The lowest rates of community belonging are in Moncton and Campbellton health zones; however, these are higher than in Canada as a whole. The lowest rates of internal migration are in the Miramichi health zone, and the highest rates in Fredericton. The highest proportion of immigrants are in Fredericton, although at 5.3 per cent it remains well below the national figure of 20.6 per cent. The highest old-age dependency ratio is in Campbellton, at 20.2 compared to 14.4 nationally. Mortality varies considerably between health zones as well, with the Campbellton health zone having the highest mortality in all three periods. The lowest mortality rate was in the Moncton health zone, which was below the national rate in 2001 and 2006, and slightly above the national rate in 2011.
26 Following approximately the same periods as for the census and demographic indicators, Table 4 provides results for selected health indicators for 2003, 2007, and 2012. Self-perceived health was lower in New Brunswick than in Canada as a whole, with 54.6 per cent of New Brunswickers indicating in 2012 that they had very good or excellent overall health. In contrast, the rest of Atlantic Canada had values closer to those of Canada as a whole (59.9%). The proportion of people who reported being overweight or obese was higher in Atlantic Canada than in Canada as a whole, with 60.8 per cent of adults in New Brunswick compared to 52.5 per cent overall in Canada. Not surprisingly, the rate of diabetes was higher in New Brunswick than in Canada as a whole: 7.4 per cent of New Brunswickers reported having diabetes in 2012, compared to the national average of 6.5 per cent. Cancer incidence in Atlantic Canada was only moderately higher than in all of Canada for all three periods examined. However, the caesarean section rate in Atlantic Canada was generally higher than in Canada as a whole, despite having lower overall birth rates. The largest health difference was in ambulatory care sensitive conditions, with substantially higher rates in all Atlantic provinces compared to Canada as a whole: for example, in 2012, New Brunswick had a rate of 425 per 10,000, compared to 289 nationally.
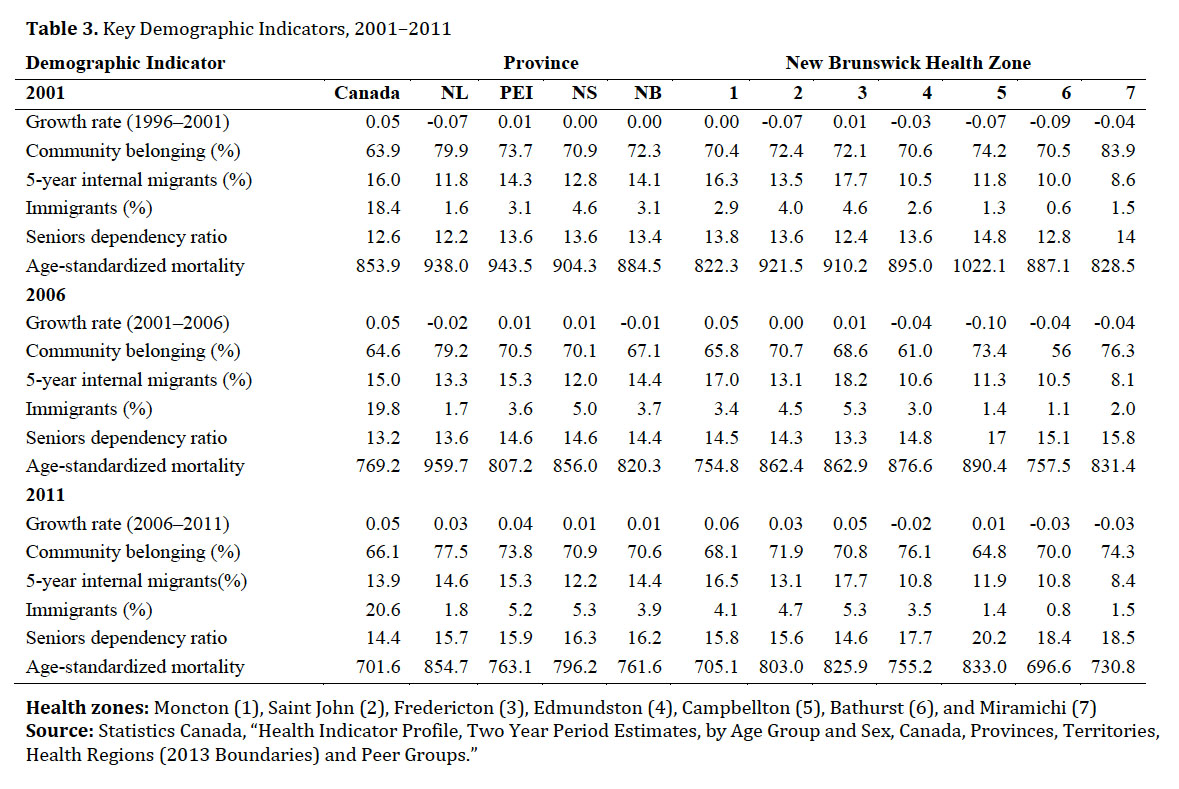 Display large image of Table 3Health zones: Moncton (1), Saint John (2), Fredericton (3), Edmundston (4), Campbellton (5), Bathurst (6), and Miramichi (7)
27 Within New Brunswick at the health zone level, these health indicators showed marked differences in each time period. Self-perceived health in New Brunswick is lower than it is nationally, with health perception in Campbellton and Bathurst markedly lower than the rest of the province, and Fredericton markedly higher. The highest reported rates of overweight and obese are in the Miramichi zone, where 73.0 per cent of adults reported being overweight or obese in 2012 as compared to 56.1 per cent in the Moncton health zone. Similarly, the rate of adults reporting a diabetes diagnosis was 10.8 per cent in the Miramichi zone, compared to 4.9 per cent in the Bathurst health zone. The highest cancer incidence was in Miramichi, at 642.2 per 100,000 compared to 496.6 per 100,000 in the Fredericton health zone. The rates of caesarian section vary considerably across the province, with an exceedingly high rate of 42.1 per cent in 2012 for the Miramichi health zone, compared to a rate of 20.7 per cent in the Saint John zone. The highest rates of ACS conditions were in the Campbellton health zone at 1,240 per 100,000 in 2003 and 660 per 100,000 in 2012. This compares to low rates of 354 per 100,000 in the Moncton health zone in 2012.
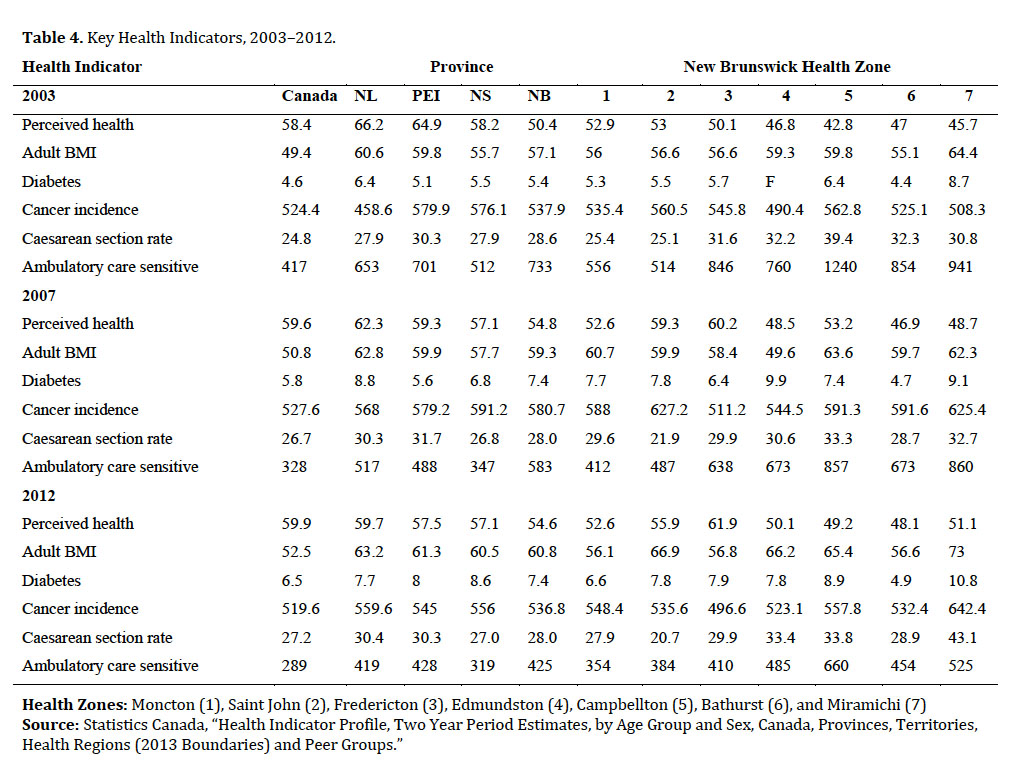 Display large image of Table 4Health Zones: Moncton (1), Saint John (2), Fredericton (3), Edmundston (4), Campbellton (5), Bathurst (6), and Miramichi (7)
28 In addition to varying by health zone, the indicators vary by age group. Figure 1 shows the average values for individuals who indicated high or very high community belonging, and those individuals who indicated good or very good perceived overall health by age group and health zone. The highest values for community belonging are in Campbellton and Miramichi, and the reported values for those sixty-five years and over are higher than for those between twenty and thirty-four years of age. For the other five health zones, community belonging is similar to the provincial average, with the lowest values found for 20–34 year olds in Fredericton and Moncton regions. The results for perceived health are markedly different, where the lowest values for self-perceived health are for those sixty-five years and over in Edmundston, Campbellton, Bathurst, and Miramichi.
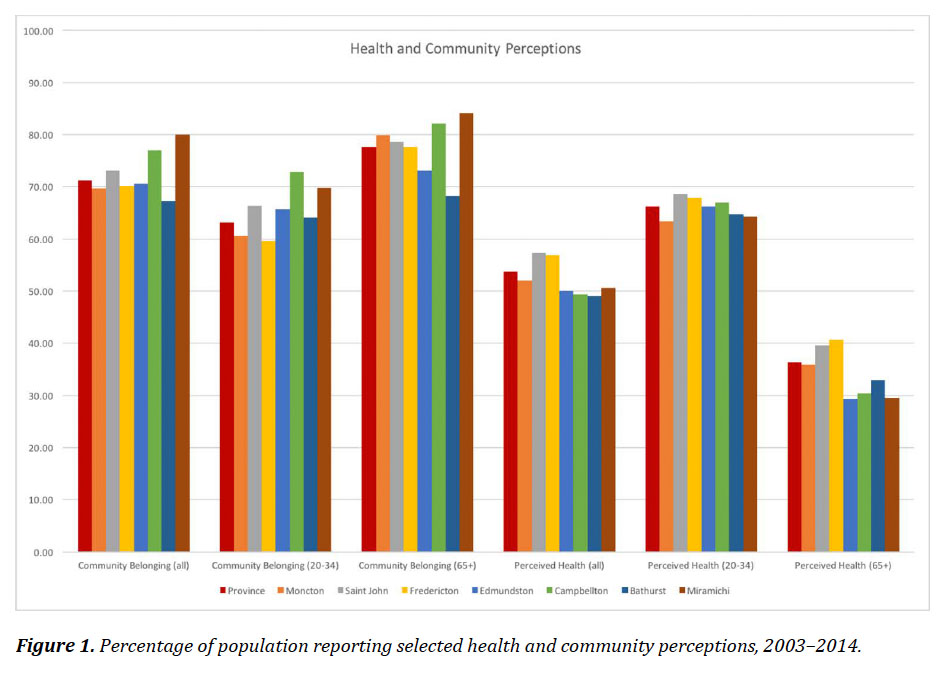 Display large image of Figure 1
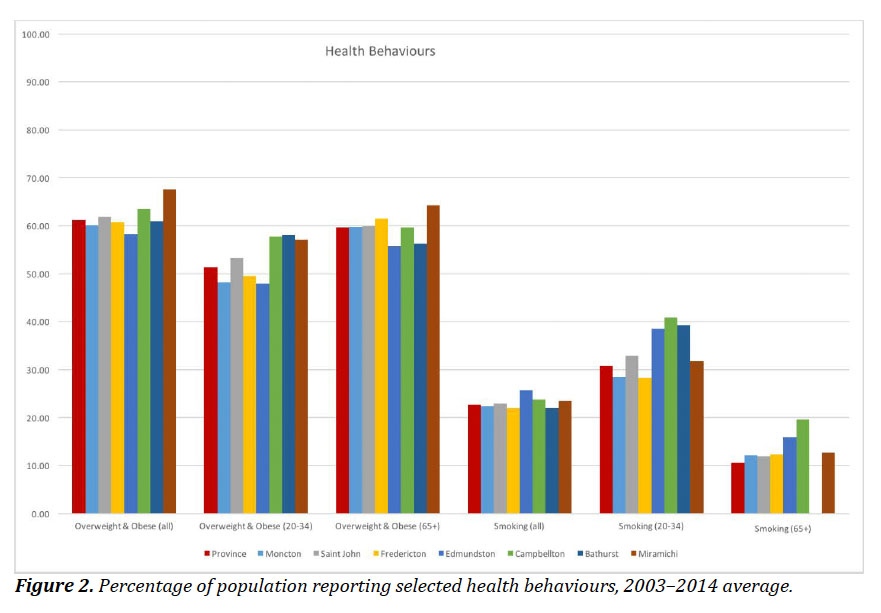
29 Figure 2 shows the results for selected health behaviours by health zone and age group. For obese and overweight, the highest rates for the 20–34 age group were in Campbellton, Bathurst, and Miramichi. For the over-65 age group, the differences between zones were smaller, but Miramichi still had the highest proportion. The highest rates of smoking were for those in the 20–34 age group for Edmundston, Campbellton, and Bathurst. Smoking rates for those over 65 were markedly lower than for the younger group.
 Display large image of Figure 2
30 The above tables and figures show that there are high levels of variation in key census, demographic, and health indicators between health zones, between age groups, and over time. The following figures show the spatial distribution of selected indicators at the New Brunswick Health Council community level. Combined with the above, these maps provide a view of the spatial variation of key population health indicators.
31 Figure 3 shows the variation in community belonging, old-age dependency, population growth, and birth rate. Rates of community belonging vary across the province, with the lowest rates around the Fredericton/Oromocto, Kedgwick, and Caraquet communities. Higher rates of community belonging were found in the St. George, Perth-Andover, and Miramichi communities. The variation in the seniors dependency ratio shows a clear spatial pattern, with higher rates along the north coast and Acadian Peninsula. The lowest dependency ratios were found in Oromocto, Fredericton, New Maryland, and Quispamsis communities. The variation in population growth shows the strongest spatial patterns, with positive growth only evident in the Fredericton, Quispamsis, and Moncton/Dieppe communities. The variation in birth rates across the province was also high, with the highest birth rates in Oromocto and Dieppe communities, and the lowest in Sackville, Caraquet, and Dalhousie communities.
32 Figure 4 shows the spatial variation of self-rated health, emergency room visits, self-reported incidence of diabetes, and community-level median income. The variation in self-reported health is not evenly patterned across the province. The highest rates of self-reported health were in Grand Bay-Westfield, Moncton, Dieppe, and Fredericton. The lowest rates were in Hillsborough, Tracadie-Sheila, and Minto communities. The rate of emergency room visits shows more variation, where the highest rates were in Kedgwick, Grand Falls, Sackville, and Bouctouche communities. The lowest rates of emergency room visits were in Hillsborough, New Maryland, and Salisbury communities. For diabetes, the highest rates were in Hillsborough, Shippagan, and Tracadie-Sheila communities, with the lowest rates in Quispamsis and Kedgwick communities. Median income shows a clear spatial pattern across the province, with the lowest median incomes in Campbellton and Perth-Andover communities and the highest in Quispamsis, New Maryland, and Dieppe communities.
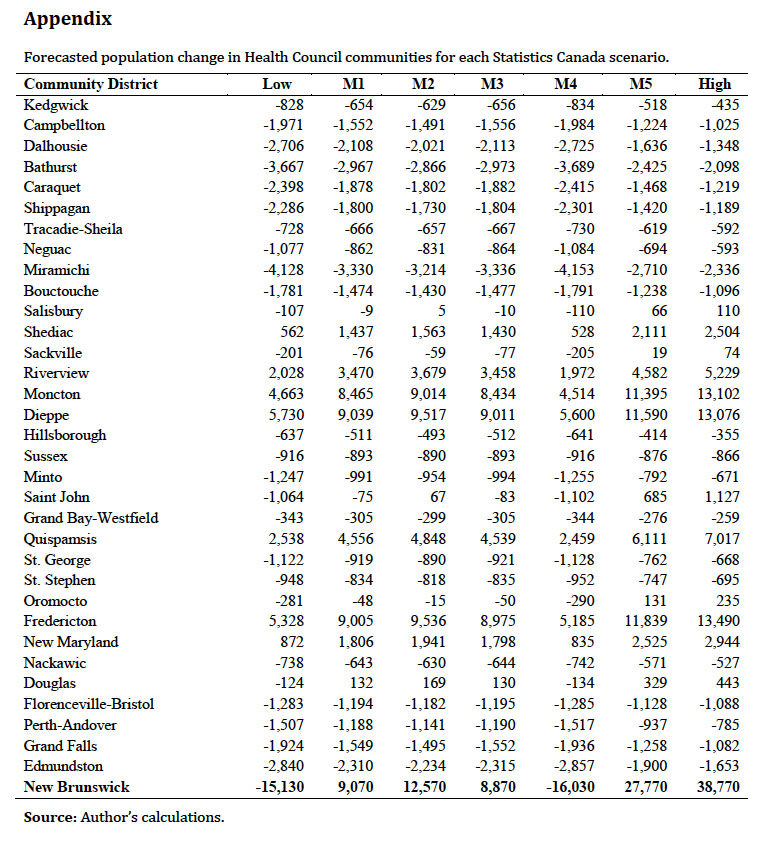
33 Turning to population growth, Figure 5 shows four population growth scenarios for New Brunswick communities. As is evident from these scenarios, the majority of the province will experience low or negative growth across all four scenarios. The general pattern that emerges from these scenarios is that population growth is likely to be concentrated in Fredericton, Dieppe/Riverview/Moncton, and Quispamsis communities. The lowest growth will likely be along the north of the province, particularly in the Caraquet and Dalhousie communities.
Discussion
34 There are persistent and marked health inequalities in New Brunswick: between geographic regions, between socioeconomic groups, and between age groups. The results presented here have illustrated these inequalities across multiple dimensions, and highlighted spatial inequalities for several key population health indicators. Provincially, New Brunswick fares poorer than the national average on several key population and health indicators: post-secondary graduates, long-term unemployment, reliance on government transfers, high and growing old-age dependency, total age-standardized mortality rate, self-perceived health, proportion of overweight and obese, diabetes, and ACS conditions. However, New Brunswick fares better than Canada as a whole in terms of children in low-income families, the proportion of renters spending more than 30 per cent of income on shelter, lone-parent families, and community belonging. Of these, community belonging is worth highlighting, especially given the context of high local out-migration and low population growth. In most circumstances, these features would indicate communities “in decline.” However, given higher than expected rates of community belonging, it shows that a sense of belonging to place can transcend in population decreases.
35 At the community level, the results presented here point to mixed vulnerabilities and potential opportunities across the province. In particular, communities that have lower health measures across several indicators and persistently lower values for census indicators—combined with negative historic population growth and negative forecasted growth—there is a high potential for community vulnerability. In contrast, communities that measure higher in health and census indicators and have the potential for population growth have the opportunity to attract growth within the region and provide services for communities in decline.
36 The population forecasts presented here point to only a few areas for growth: Moncton (including Riverview and Dieppe), Fredericton (New Maryland and Oromocto), and the greater Saint John area (Quispamsis). Outside of these regions, little or negative population growth over the next thirty years is forecast. Within this context, the prospect for improvements in population health are questionable. As the resident population of many communities continues to age, and high youth out-migration continues, the provision of health services and public health programs will become even more difficult.
37 Without population growth at the provincial level, there will be a smaller proportion of working-age population contributing to the tax base required to support continued aging. Over the past decade there has been little population increase, with out-migration of working-age individuals. This leaves a greater proportion of older adults who may not be working full-time and are entering a time where they may have additional health needs. As such, it is imperative that provincial health strategies include a defined strategy for population growth, recognizing that most communities will likely continue to face population decline. The results above point to some opportunities to focus population growth within the three larger urban centres. Smaller communities across the province have maintained high levels of community belonging, despite continued population decreases. In this sense, population decreases do not equate to community decline (Taylor et al.). The prospect of these areas “disappearing” or “failing” is minimal, and experiences elsewhere have shown that even with large decreases in population, communities change and persist (Robinson and Carson).
38 At the same time, the high levels of out-migration from rural and small-town areas of the province have not resulted in an equivalent growth in the three urban centres. With most of out-migrants leaving New Brunswick, at least in the medium term, there is a missed opportunity to retain these individuals within the province. The gains of retaining even some out-migrants would extend across many of the indicators presented in this paper. Strategies to promote retention, however, would need to address the realities of health inequalities, economic activities, as well as forecasted population growth (Carson and Carson).
39 The consideration of population health alongside population change is an important next step for provincial planners and policy-makers (Carson). Over the past decades, there have been sustained population decreases across much of the province. Using small-area forecasting techniques, these decreases are projected to continue in all but a few areas. At the same time, these areas of population decrease are correlated with lower population health status, suggesting that if populations continue to decline, there may be a widening of health inequalities between regions of the province.
Appendix
 Display large image of Table 5