Refereed Articles
Charting the Progression of Diabetes Mellitus in New Brunswick:
Rates, Correlates, and Implications for Accountability in Public Policy
Diabetes mellitus is one of the most common chronic conditions in New Brunswick, associated with a myriad of health and social consequences. The recent provincial government diabetes strategy focused largely on clinical indicators of diabetes prevention and management, without identification of a validated methodology for their measurement against performance targets or accountability for tangible improvements in the underlying social factors known to fuel type 2 diabetes. This study uses different data sources and methods to transparently measure recent trends in diabetes prevalence; disentangle the independent effects of multiple health, behavioural, and socioeconomic contributing factors to diabetes; and project future numbers. Population aging means the prevailing trend of rising diabetes prevalence is likely to continue in New Brunswick, but meaningful actions to address underlying social issues including poverty as a barrier to healthy living could help stem the tide.
Le diabète sucré est l’une des maladies chroniques les plus répandues au Nouveau-Brunswick, associé à une myriade de conséquences sociales et de santé. La récente stratégie de lutte contre le diabète du gouvernement provincial s’est concentrée en grande partie sur les indicateurs cliniques de la prévention et de la gestion du diabète, sans identifier une méthodologie validée pour leur mesure par rapport aux objectifs de rendement ou la responsabilisation pour des améliorations tangibles des facteurs sociaux sous-jacents connus du diabète de type 2. Cette étude utilise différentes sources de données et méthodes quantitatives pour mesurer de manière transparente les tendances récentes de la prévalence du diabète, démêler les effets indépendants de multiples facteurs sociosanitaires et comportementaux contribuant au diabète et projeter les chiffres futurs. Le vieillissement de la population signifie que la tendance dominante à la hausse de la prévalence du diabète devrait se poursuivre au Nouveau-Brunswick, mais des mesures significatives pour aborder les problèmes sociaux sous-jacents, y compris la pauvreté comme un obstacle à une vie saine, pourraient aider à endiguer la vague.
Introduction
1 The prevalence of diabetes mellitus and other chronic diseases is increasing in New Brunswick, across Canada, and around the world1–3 Diabetes is characterized by hyperglycemia (high blood glucose) resulting from the body’s inability to use blood sugar for energy. It is often associated with heart disease, stroke, kidney failure, vision loss, lower limb amputation, breathing problems, and depression, among other health problems. It is a complex disorder, associated with multiple genetic, lifestyle, and environmental factors. The World Health Organization estimates the number of adults with diabetes has nearly quadrupled worldwide during the last three decades, attributed in part to aging populations and a rise in overweight and obesity in countries at all income levels.1 A recent report from the New Brunswick Department of Health assessed one in ten New Brunswickers aged one year and older has been diagnosed with type 1 or type 2 diabetes, a rate significantly higher than the national average.3 Such numbers may not be complete, since there are no uniform global standards for monitoring diabetes in the population to inform public health and clinical strategies.4 Yet, type 2 diabetes and many other lifelong diseases can be largely prevented and managed by acting on the behavioural risk factors, including dietary change, physical activity, weight management, and tobacco cessation. At the same time, disparities across socioeconomic groups and between jurisdictions in the burden of chronic diseases and in the key factors influencing health and equitable health impacts persist. Less well known is what actually works to reduce health gaps, improve population health, and lower overall public service delivery costs.5
2 In New Brunswick, an aging population, high rates of obesity and overweight including among children, and low levels of health literacy mean that the disease burden associated with diabetes— already large—shows few signs of abating. To address the growing challenge facing the health-care system and, by extension, the provincial economy, the government of New Brunswick in 2011 launched the first Comprehensive Diabetes Strategy.6 Covering the period 2011–15, the strategy itemized a series of indicators for assessing diabetes prevention and control efforts. However, these indicators were simply identified as “recommended,” without any related measurement approaches or periodic targets for performance monitoring. While the strategy recognized that sociocultural influences can impact the feasibility of initiatives to improve health quality, the expected outcomes of strategy implementation largely focused on clinical measures of diabetes detection and management. The document was silent on quantifiable goals or information needs for addressing the root causes of health disparity.
3 Enhanced analysis and use of representative data on the burden and trends of diabetes and its key risk factors are required to foster accountability across sectors and society to reduce the impact of this and other major chronic conditions.1 With a view of supporting evidence-based, population-wide interventions using transparent methodologies, this study has three objectives. First, it tracks the progression of diabetes in New Brunswick using different health data sources. It then analyses the main health, behavioural, and social correlates linked to changes in observed diabetes rates. Third, it examines projections of future diabetes trends in the province and discusses the implications for public policy and program planning options.
Data and Methods
4 Various data sources and metrics can be used for health surveillance and research, each with its strengths and limitations.7–10 There is widespread consensus that the quality of surveillance information on diabetes has increased substantially in Canada and New Brunswick in recent years, but published diabetes rates may differ according to the characteristics and collection methods underlying each source.2,3 Drawing on a review of journal articles and government reports, I compare the different quantitative data sources that have been used to estimate the prevalence of diabetes and its main correlates in New Brunswick during the past decade.3,11–14 Identified data sources include population-based surveys, administrative health records, and laboratory blood test records. No one source offers a complete picture of the burden of diabetes; information from administrative and laboratory records is limited in terms of patient and community characteristics, while that from population surveys is limited in terms of clinical measures.
5 Some particular characteristics of the main data sources under observation include:
- The Canadian Community Health Survey (CCHS): a representative household survey covering all provinces and territories conducted annually by Statistics Canada that collects information from a sample of the population twelve years and older on a number of health-related issues.3,14
- Administrative health records: linked provincial administrative data sets (practitioner billings, hospital discharge records, vital statistics, resident health insurance registrations) using a validated algorithm for chronic disease monitoring under the auspices of the Canadian Chronic Disease Surveillance System (CCDSS).3,12,13
- Laboratory blood test records: repositories of results from provincial laboratory blood test services, notably measurements of glycosylated hemoglobin (also known as A1c testing), an indicator of the degree of control of glucose metabolism used to help diagnose and manage diabetes.3,11
6 For this study, in a first step, I compare and contrast estimates of diabetes prevalence in New Brunswick across all three data sources. Second, I focus on assessing the social determinants of diabetes drawing on the survey data. I use the 2013–14 CCHS public use microdata file, taking advantage of the larger sample size of the two-year period file.15 I look at different demographic, behavioural, and socioeconomic characteristics that have been linked to shifting levels and patterns of diabetes at the population level.1–3,5,11,14,16–18 These include demographic variables (age, gender), health and metabolic determinants (obesity, high blood pressure), behavioural risk factors (unhealthy eating, physical inactivity, tobacco use), and socioeconomic conditions (poverty and lower education as barriers to healthy lifestyles). The New Brunswick context also means accounting for the health region of residence: geographical areas defined by health authorities to guide health-care planning and services delivery. Logistic regression models are used to disentangle the effects of the various predictors for diabetes, using the Wald test to gauge the significance of each independent variable, and the Nagelkerke coefficient to assess model fit.19–21 For the Wald test, the level of confidence is set at 95 per cent (expressed as p<0.05). In terms of interpreting the Nagelkerke statistic for a given set of data, the higher the value of this coefficient (on a scale of 0 to 1), the more useful are the variables included in the model in predicting the risk of diabetes.
7 Lastly, I dive into the administrative data for future projection of diabetes prevalence to help inform health and social policy and planning options. Administrative health records—considered essentially complete thanks to Canada’s single-payer universal health coverage system—are less sensitive to the variability inherent in survey sample data. For example, the confidence interval surrounding diabetes prevalence was ±2.0 per cent for males and ±1.6 per cent for females based on 2014 CCHS data (sample yielding some 255 diabetes cases), compared to ±0.1 per cent for both males and females based on 2013 CCDSS data (74,740 observed cases).3 Confidence intervals were not published for the laboratory-based data.11
Results
Trends in the prevalence of diabetes mellitus
8 As seen in Figure 1, each of the key sources of diabetes prevalence in New Brunswick shows a rising trend in recent years.3,11,22,23 However, the level and pace varies by source. Laboratory A1c blood test data suggest diabetes prevalence more than doubled between 2001 and 2014, rising at an average pace of 6.3 per cent annually to reach nearly 15 per cent of the adult population. Administrative records indicate a somewhat more modest increase: an average of 5.6 per cent annually, to reach approximately 10 per cent of the population. Survey data from the CCHS present an average increase in diabetes prevalence of 4.2 per cent annually from 2003 to 2015, to a peak of 8.8 per cent of respondents. Underestimates of diabetes prevalence from self-reported survey data have been observed elsewhere,9 although the confidence interval allows the CCHS-based rate in New Brunswick to stretch as high as 10.5 per cent in 2015 (results not shown).23
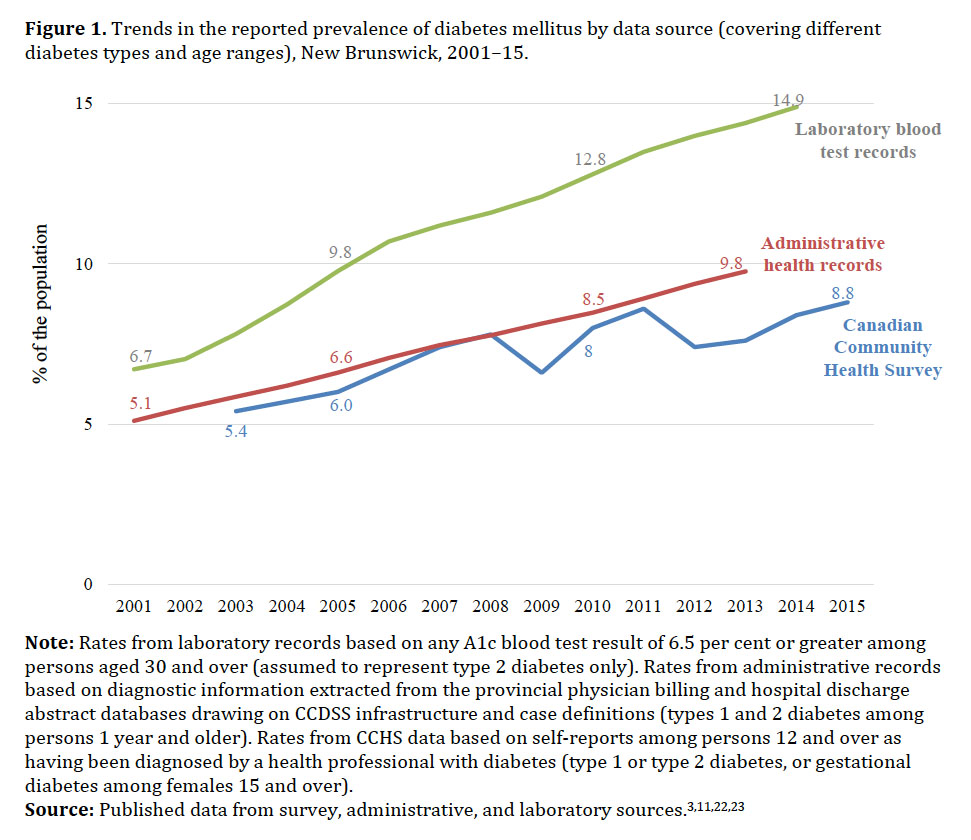 Display large image of Figure 1Note: Rates from laboratory records based on any A1c blood test result of 6.5 per cent or greater among persons aged 30 and over
(assumed to represent type 2 diabetes only). Rates from administrative records based on diagnostic information extracted from
the provincial physician billing and hospital discharge abstract databases drawing on CCDSS infrastructure and case definitions
(types 1 and 2 diabetes among persons 1 year and older). Rates from CCHS data based on self-reports among persons 12 and over
as having been diagnosed by a health professional with diabetes (type 1 or type 2 diabetes, or gestational diabetes among
females 15 and over).
Display large image of Figure 1Note: Rates from laboratory records based on any A1c blood test result of 6.5 per cent or greater among persons aged 30 and over
(assumed to represent type 2 diabetes only). Rates from administrative records based on diagnostic information extracted from
the provincial physician billing and hospital discharge abstract databases drawing on CCDSS infrastructure and case definitions
(types 1 and 2 diabetes among persons 1 year and older). Rates from CCHS data based on self-reports among persons 12 and over
as having been diagnosed by a health professional with diabetes (type 1 or type 2 diabetes, or gestational diabetes among
females 15 and over).
9 Overall, the divergence in reported prevalence in New Brunswick across data sources stood at 90 per cent in 2013 (the latest year for which data have been published for all three sources).
10 What are the reasons for such discrepancy? The most immediate are differences in the disease types and the target populations covered by the different sources. Diabetes comes in many forms. The most common are type 2 (most frequently apparent during adulthood, affecting more than 90 per cent of persons with diabetes), type 1 (often beginning in childhood), and gestational diabetes (occurring during pregnancy). There are also other forms triggered by specific genetic conditions, drugs, illnesses, or other unusual causes. Depending on the data collection mechanism, information sources may capture one or several of the different types.
11 Another key reason for the discrepancy is the different population groups targeted in the original sources. One covers only middle-aged and older adults, while others capture a wider age range. To help mitigate this discrepancy, Figure 2 presents the diabetes data estimated for all ages using population estimates from Statistics Canada as the rates’ denominator.24 While the laboratory and survey data are not complete for younger ages, administrative chronic disease surveillance data indicate that less than 1 per cent of New Brunswickers with diabetes are under twenty years of age.3 Relating the different data sources to a common denominator reduces the divergence in observed rates, particularly for the two non-survey sources. The convergence over time between the rates from laboratory data versus administrative data (at most 3 per cent difference between these sources annually from 2005 to 2013) is likely related to a “catch-up” in uptake of blood testing services since the introduction in the province in 2000 of A1c testing. The CCHS upper confidence limit puts the all-ages rate as high as 9.0 per cent in 2015,23 closer to the 10 per cent rate most recently obtained from the other two sources.
12 Based on these more comparable measures, diabetes prevalence is estimated to have risen by an average of 3.9–5.4 per cent annually between 2005 and around 2014, an overall increase of some 50 per cent over the decade.
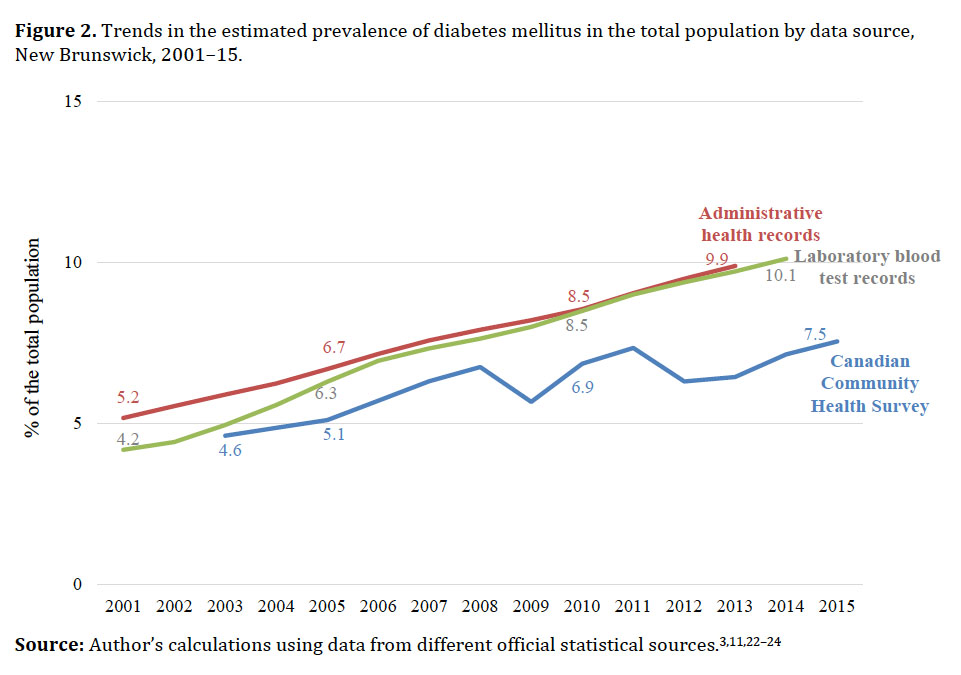 Display large image of Figure 2
Demographic, health, and social correlates
13 What has been driving the rapid progression of diabetes mellitus in New Brunswick? As with the trend observed nationally and internationally, population aging is a key influence. Because diabetes is a chronic condition, the proportion of people with the disease tends to increase with age.
14 As seen in Figure 3, considering age-standardized rates to adjust for changes in the population age structure over time, the pace of increase in diabetes prevalence between 2005 and 2013–14 is reduced to an average of 3.0 per cent annually according to the CCDSS data, or 1.7 per cent annually based on the CCHS data―at most a 25 per cent overall increase during the period of observation.3,25 In other words, at least half of the observed increases in diabetes in New Brunswick over the past decade can be attributed to population aging.
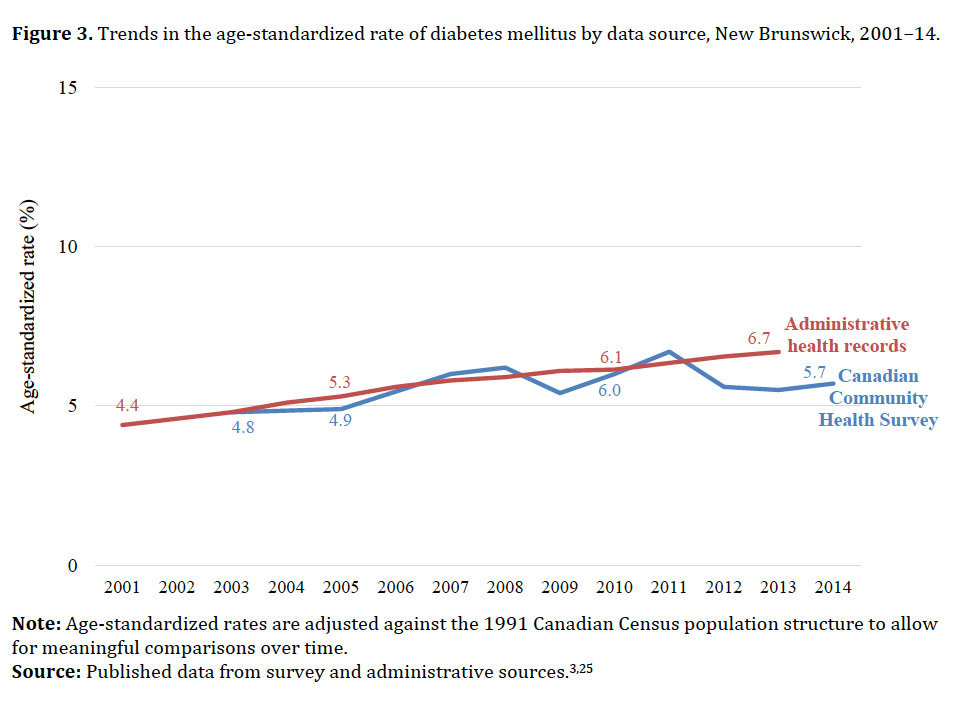 Display large image of Figure 3Note: Age-standardized rates are adjusted against the 1991 Canadian Census population structure to allow for meaningful comparisons
over time.
Display large image of Figure 3Note: Age-standardized rates are adjusted against the 1991 Canadian Census population structure to allow for meaningful comparisons
over time.
15 Figure 4 shows the results from the logistic regression model considering age as a predictor of diabetes. Expressed in terms of odd-ratios for each risk factor, the interest here is in values that differ from 1, and considered in comparison to a reference category (for which the value is set at 1). An odds-ratio greater than 1 implies that an individual in the given category has a higher risk of being diabetic compared to a counterpart in the reference category. An odds-ratio less than 1 suggests lower risk than in the reference group, while a ratio equal to 1 implies no difference between the groups. As expected, a strong and direct relationship between advancing age and the risk of diabetes is found. The risk is approximately nine times higher for persons 60–69 years of age compared to those 30–39 years, and fifteen times higher for persons 70 years and over. The results are statistically significant; that is, the observed differences across categories are inferred to represent a “real” pattern in the population rather than simply due to chance.
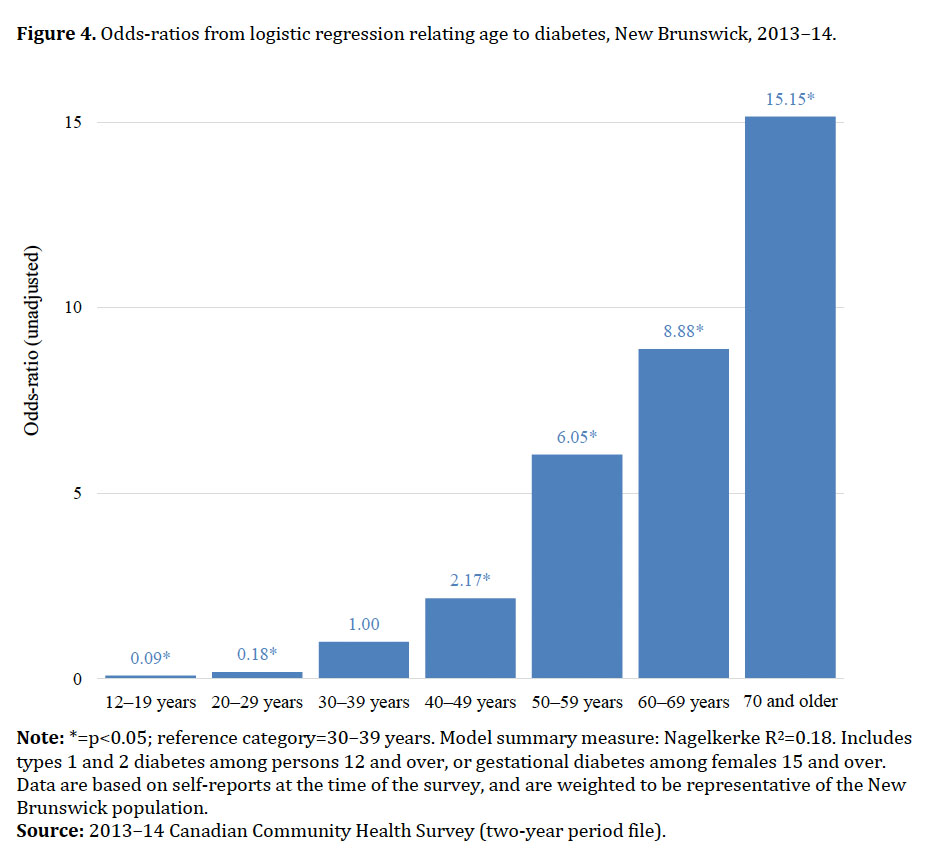 Display large image of Figure 4Note: *=p<0.05; reference category=30–39 years. Model summary measure: Nagelkerke R2=0.18. Includes types 1 and 2 diabetes among persons 12 and over, or gestational diabetes among females 15 and over. Data
are based on self-reports at the time of the survey, and are weighted to be representative of the New Brunswick population.
Display large image of Figure 4Note: *=p<0.05; reference category=30–39 years. Model summary measure: Nagelkerke R2=0.18. Includes types 1 and 2 diabetes among persons 12 and over, or gestational diabetes among females 15 and over. Data
are based on self-reports at the time of the survey, and are weighted to be representative of the New Brunswick population.
16 In addition to aging, a large number of lifestyle, social, economic, and environmental variables have been linked to shifting levels and patterns of diabetes at the population level. The inclusion of a comprehensive set of predictors in the regression analysis yields a considerably better model fit; that is, simultaneously examining multiple relationships between multiple variables better explains the risk of diabetes (Table 1) compared to age alone (Figure 4). Not only does the risk of diabetes increase with advancing age, but many other variables exercise a significant independent effect (Table 1, Model 1). As expected based on evidence from different jurisdictions, after adjusting for age and other known risk factors, males are at a higher risk of acquiring diabetes than females. Being obese increases the risk sixfold compared to persons who are not overweight or obese. Having high blood pressure (hypertension) more than doubles the risk, all else being equal.
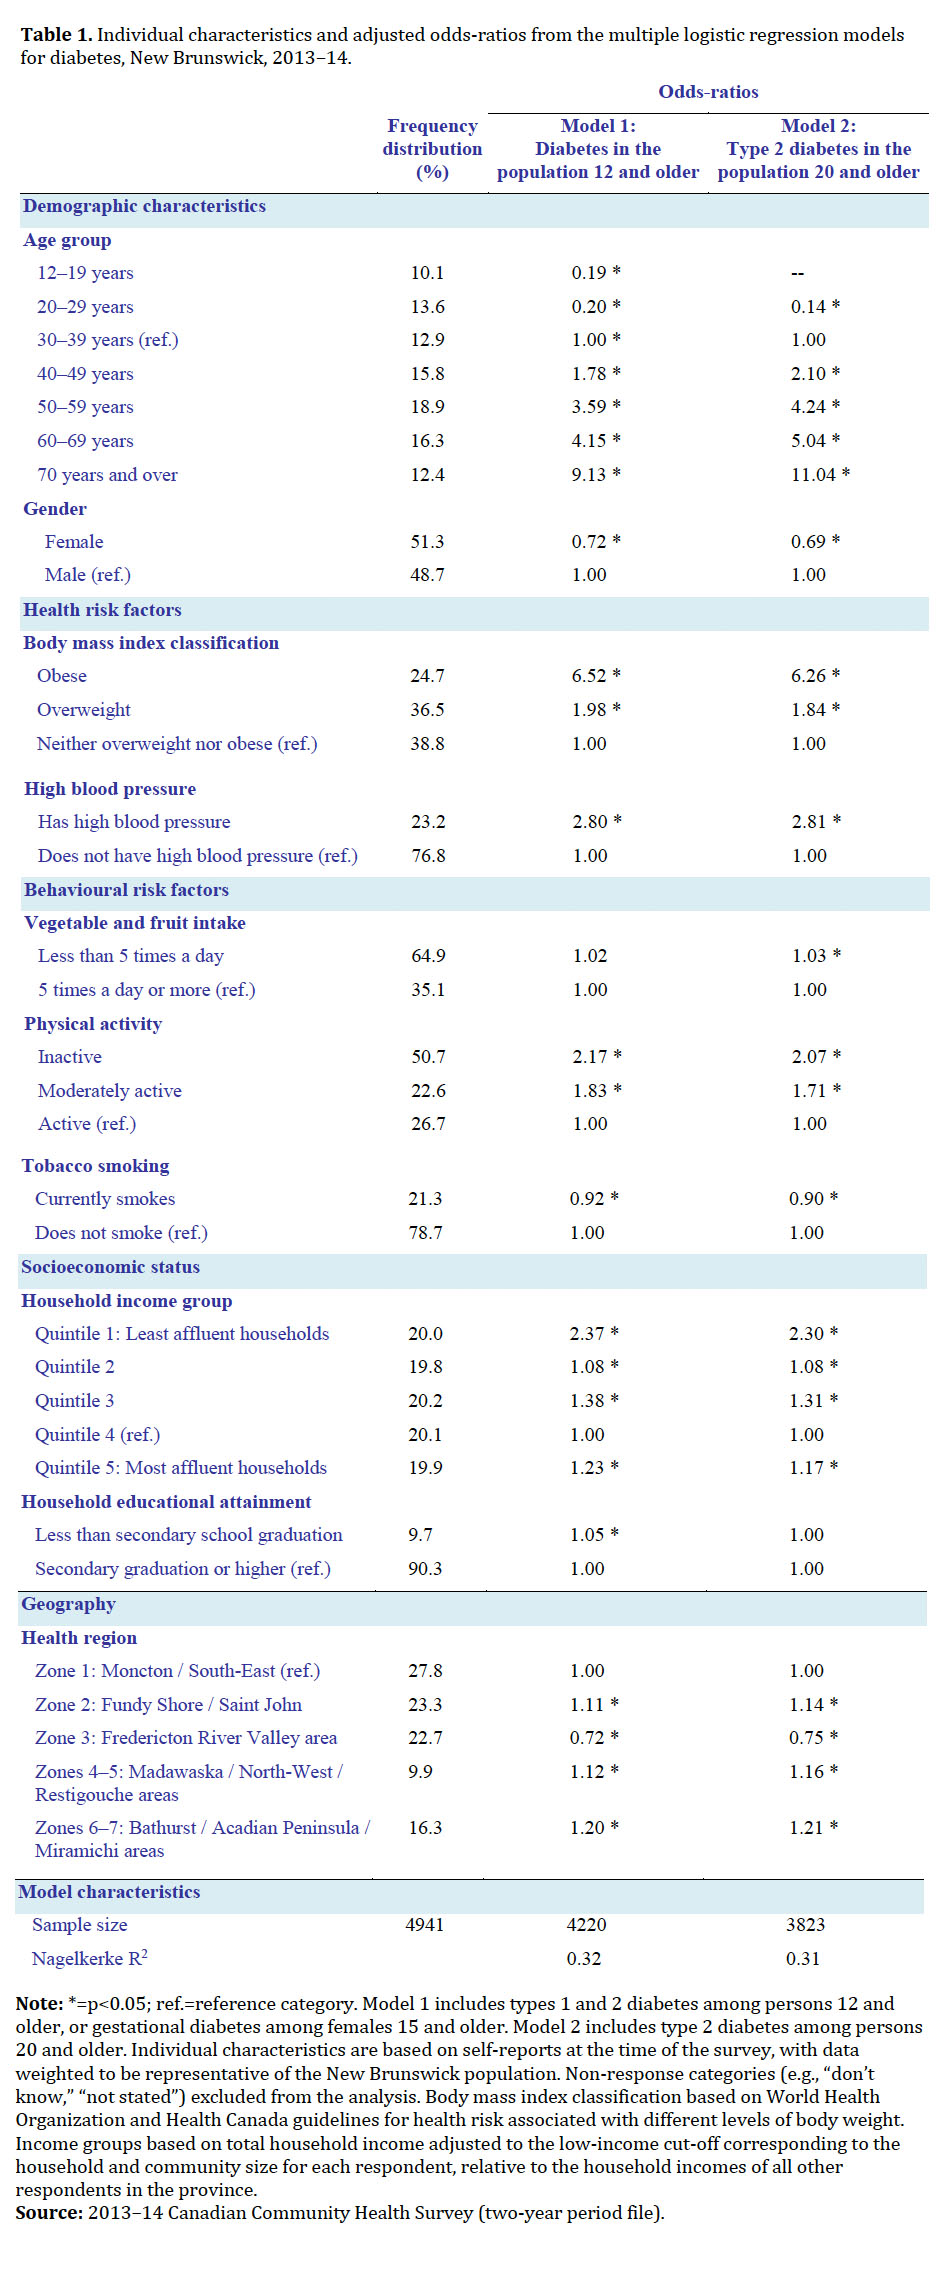 Display large image of Table 1Note: *=p<0.05; ref.=reference category. Model 1 includes types 1 and 2 diabetes among persons 12 and older, or gestational diabetes
among females 15 and older. Model 2 includes type 2 diabetes among persons 20 and older. Individual characteristics are based
on self-reports at the time of the survey, with data weighted to be representative of the New Brunswick population. Non-response
categories (e.g., “don’t know,” “not stated”) excluded from the analysis. Body mass index classification based on World Health
Organization and Health Canada guidelines for health risk associated with different levels of body weight. Income groups based
on total household income adjusted to the low-income cut-off corresponding to the household and community size for each respondent,
relative to the household incomes of all other respondents in the province.
Display large image of Table 1Note: *=p<0.05; ref.=reference category. Model 1 includes types 1 and 2 diabetes among persons 12 and older, or gestational diabetes
among females 15 and older. Model 2 includes type 2 diabetes among persons 20 and older. Individual characteristics are based
on self-reports at the time of the survey, with data weighted to be representative of the New Brunswick population. Non-response
categories (e.g., “don’t know,” “not stated”) excluded from the analysis. Body mass index classification based on World Health
Organization and Health Canada guidelines for health risk associated with different levels of body weight. Income groups based
on total household income adjusted to the low-income cut-off corresponding to the household and community size for each respondent,
relative to the household incomes of all other respondents in the province.
17 While persons who are not physically active during their leisure time have twice the risk of diabetes compared to those who are active, the effects of other behavioural risk factors are less apparent. No significant relationship is found for high vegetable and fruit consumption, an indicator of healthy diet often associated in the literature with reduced risk of type 2 diabetes. Although the assessed relationship between tobacco smoking and diabetes is not necessarily as expected, this may be related to selection bias from household survey data. Cigarette smoking has been found to increase glycemic levels,2 but it is also associated with the most serious complications of diabetes and cardiovascular disease, including premature death.
18 It is possible that socioeconomic status, particularly disparities by income, is largely mediating potential effects of individual behavioural traits. New Brunswickers from the least affluent households are twice as likely to report being diabetic compared to their counterparts in the two highest income groups. Those in households with less than secondary graduation as the highest level of education attained, as a proxy measure of low health literacy, are also significantly more likely to have diabetes. Evidence of unequal patterns in smoking, healthy eating, and active living by income and education levels have previously been reported in New Brunswick.14
19 The analysis also reveals significant geographical variations in diabetes across the province. Persons living in the northern health regions (Zones 4–7) tend to have higher diabetes risk than those in the southern regions (Zones 1–3), controlling for age and other observed determinants. To some extent, regional differences may be associated with distal factors such as rurality, environmental exposures,11 ethnic composition, community supports,26 healthy community designs, or health system organization. The data presented here only reflect diabetes status at the time of the survey, and are not measures of quality of care, for instance. Regional differences in indicators of diabetes management have been reported elsewhere, with higher proportions of patients reaching A1c targets in selected northern regions (Zones 4 and 6).27
20 While the development of diabetes cannot be explained by any single factor, the main modifiable risk factors for type 2 are largely known. Since this is not yet the case for type 1 diabetes or gestational diabetes based on current science, I ran a second multiple regression model considering only type 2 diabetes among the adult population (Table 1, Model 2). Type 2 represents 97 per cent of self-reported diabetes cases in the 2013–14 CCHS, with none of the instances observed in youth below the age of twenty. Results from the second model are essentially similar to the first, with a small but significant effect of vegetable and fruit consumption now detected.
Looking Ahead: Diabetes Projections to 2038
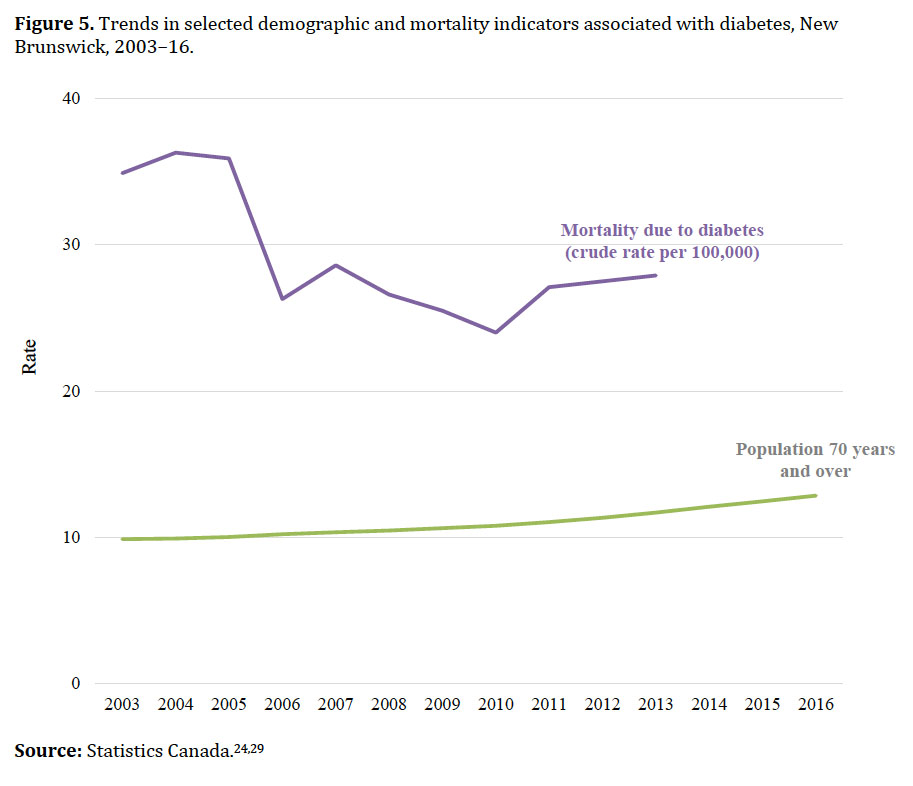
21 Some researchers have commented that, given the rising rates of obesity and diabetes in the population, average life expectancy may start to decrease.28 However, there is little evidence to support this. While diabetes prevalence is increasing in New Brunswick along with population aging, mortality is generally decreasing (Figure 5),24,29 and many other individual-level risk factors commonly associated with premature mortality show variable or decreasing trends (Figure 6).22,23,30 Past progress in public health and clinical interventions along with social policies addressing the broad determinants of health mean New Brunswickers are living longer than ever before.31 Future developments in medical technologies and pharmaceuticals, the food and leisure industries, the distribution of wealth and fiscal policy, and societal norms remain largely unknown.
22 Different models can potentially be used to project the future burden of disease, but any model is only as good as its underlying assumptions. Based on data from administrative health records, if New Brunswick’s population presented the same age-specific rates of diabetes as had been observed in 2002– 03, simulations indicate there would have been approximately 23,400 (30 per cent) fewer diabetes cases in the province in 2013 (results not shown). While population aging is a major driver of the diabetes pandemic, better understanding of the relative contribution of other influences is needed.
 Display large image of Figure 5
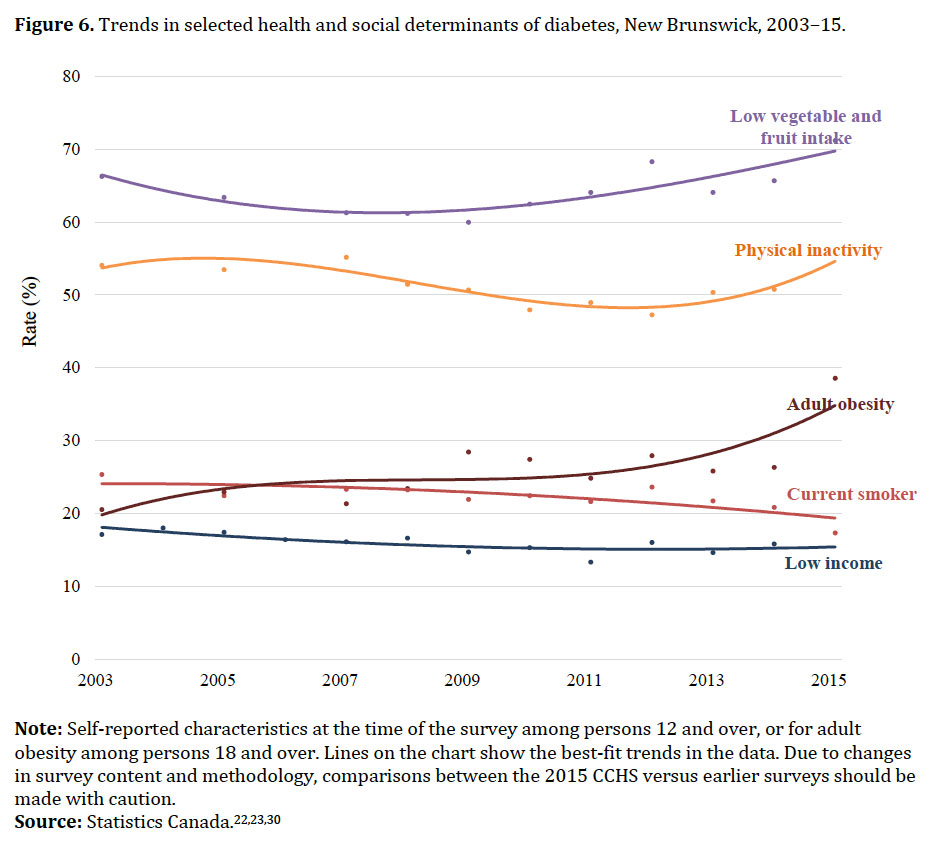 Display large image of Figure 6Note: Self-reported characteristics at the time of the survey among persons 12 and over, or for adult obesity among persons 18
and over. Lines on the chart show the best-fit trends in the data. Due to changes in survey content and methodology, comparisons
between the 2015 CCHS versus earlier surveys should be made with caution.
Display large image of Figure 6Note: Self-reported characteristics at the time of the survey among persons 12 and over, or for adult obesity among persons 18
and over. Lines on the chart show the best-fit trends in the data. Due to changes in survey content and methodology, comparisons
between the 2015 CCHS versus earlier surveys should be made with caution.
23 Our exploratory extrapolations to project diabetes prevalence rely on what is most likely to occur in the future given current knowledge. All of Statistics Canada’s projection models point to continued aging of the population in New Brunswick.32 From 12 per cent in 2013, the proportion of New Brunswickers ages 70 and over is projected to reach 19.9 per cent in 2028 and 24.5 per cent in 2038, based on the national statistical agency’s medium-growth scenario.33
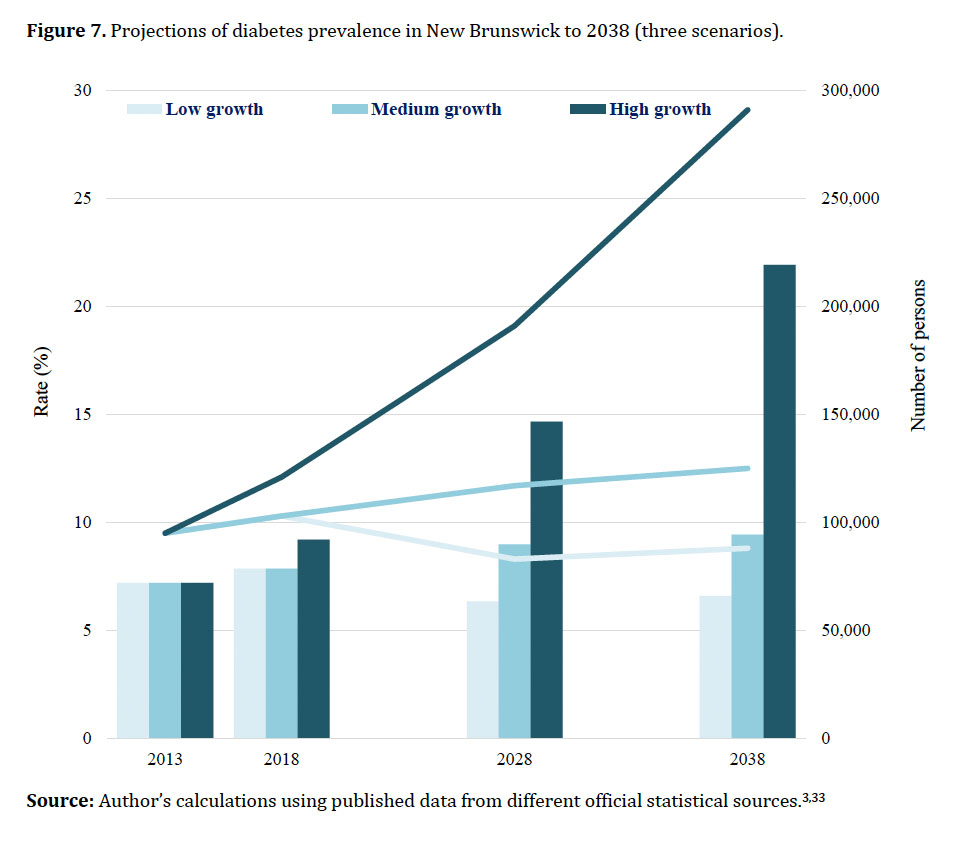
24 Drawing on the official population projections (M3 scenario),33 I devise three potential trajectories for diabetes prevalence. The baseline (medium diabetes growth) scenario assumes that the age-specific diabetes rates will remain stable over time at the levels observed in 2013. A “pessimistic” (high-growth) approach assumes the rates will increase at the same pace as observed between 2002 and 2013. An “optimistic” (low-growth) scenario assumes the rates will remain stable in the shorter term and then decrease to the levels observed in 2002.
25 As seen in Figure 7, if current diabetes rates hold steady (medium diabetes growth scenario), the prevalence of the disease is projected to increase to 12.5 per cent by 2038. That would mean that 94,300 New Brunswickers will be living with diabetes. Should prevalence continue to rise at the same pace as observed in the past decade (high-growth scenario), the rate would reach 29.1 per cent in 2038 (219,310 persons diagnosed with diabetes). Even reversing the current trend (low-growth scenario), following an initial decline, prevalence is projected to start increasing again between 2028 and 2038 (from 8.3 to 8.8 per cent), given the aging of the population. That would still mean 65,990 New Brunswickers living with diabetes.
 Display large image of Figure 7
Conclusions
26 Diabetes mellitus, one of the most common chronic conditions in New Brunswick, affects an estimated one in every ten persons. This study examined a number of challenges facing government and society as a whole posed by the ever-increasing number of diabetes cases—from objective disease surveillance to the importance of demographic, lifestyle, and socioeconomic factors in prevention efforts. Population aging is the main driver of rising prevalence, but much can be done to stem the rising tide of the disease. There is widespread evidence on how to prevent or postpone the development of type 2 diabetes, the most common form of the disease. Less well known are the policy and program interventions that are most effective and efficient in sustaining change in the modifiable risk factors at the population level. In the absence of a shift in the pace of prevalence increase, as many as one in four New Brunswickers could be afflicted with diabetes by 2038. The social and economic costs of that are astounding to contemplate.
27 Different data sources can be used to support diabetes surveillance and research in New Brunswick. To the best of our knowledge, this is the first study that taps into statistical triangulation, multivariate, and projection techniques using the rich range of administrative, clinical, and survey data to better understand this pressing health issue. Published diabetes rates vary by source. This study did not aim to derive a list of indicators and measurements, but to promote dialogue favouring evidence- and consensus-based approaches to indicator selection, including ones outside the traditional boundaries of the health-care system. Beyond transparent prevalence estimates, a range of performance indicators are needed to inform and monitor health planning and policy decisions, and assess both progress toward diabetes objectives and impediments to successful implementation. Meaningful use of indicators on diabetes and related factors depends on their definitions and measurement sources, and should acknowledge their limitations and variability. The inaugural New Brunswick diabetes strategy listed a series of indicators intended to track progress in public initiatives, but lacked definitions, baselines, or targets. My own review failed to uncover any provincial report or journal article that systematically measured them.
28 Further absent from the recent diabetes strategy were indicators for tracking the social determinants of health and diabetes. Echoing results from studies elsewhere, the present analysis of data for New Brunswick found that socioeconomic status has a critical effect on the risk of diabetes, mediating many of the expected influences of diet and other behavioural risk factors. In particular, New Brunswickers from the least affluent households were twice as likely to report being diabetic compared to their counterparts in the highest income groups, other factors remaining the same. These results reinforce the dialogue on social policy as good health policy, and the growing literature on poverty as a relevant variable in diabetes incidence and clinical care.34–36 Just as the World Health Organization defines “health” as a state of complete physical, mental, and social well-being, and not merely the absence of disease,37 so too health policy should mean equitable access to quality services for maintaining and improving physical, mental, and social well-being―and not merely coverage for medical and hospital services. In other words, to be truly effective, future efforts to build on the provincial diabetes strategy should look beyond glycemia control and set wider targets for creating supportive environments for healthy lifestyles, against which non-clinician stakeholders should similarly participate in discussions and be held accountable for provincial health outcomes.