Articles
Shale Gas Royalties in New Brunswick:
An Evaluation
In 2014, the government of New Brunswick implemented a new royalty regime for natural gas in the context of their regulatory review of shale gas. Advocates of shale gas stressed the additional government revenues that would result. However, the government provided no background documentation to explain their methodology or substantiate their claims. This study provides such estimates, utilizing a methodology that incorporates the intricacies of the New Brunswick system and assumptions drawn from economic and productivity analysis of the North American shale gas industry. Our study challenges previous revenue estimates and provides a transparent methodology to inform public policy.
En 2014, le gouvernement du Nouveau Brunswick a mis en oeuvre un nouveau régime de redevances pour le gaz naturel dans le cadre de son examen réglementaire du gaz de schiste. Des défenseurs du gaz de schiste ont souligné les recettes publiques supplémentaires qui en résulteraient. Toutefois, le gouvernement n’a pas fourni de documentation de référence pour expliquer sa méthodologie ou étayer ses affirmations. La présente étude fournit de telles estimations, grâce à une méthodologie qui tient compte des complexités du système du Nouveau Brunswick et des hypothèses établies à partir de l’analyse de l’économie et de la productivité de l’industrie nord-américaine du gaz de schiste. Notre étude remet en question les dernières estimations des recettes et présente une méthodologie transparente permettant d’orienter les politiques publiques.
Introduction
1 The extraction of natural gas from shale using techniques of hydraulic fracturing (fracking) currently takes place in several jurisdictions in the United States and Canada, notably in British Columbia and Alberta. At the same time, several political jurisdictions have imposed moratoriums on fracking, including the state of New York and the Canadian provinces of Quebec, Nova Scotia, and New Brunswick. In these cases, there was a process of public engagement, supported by analytical research of the economic, social, environmental, and public health implications of fracking, varying in the depth of the analysis and the transparency of their proceedings. Part of the economic research was concerned with the revenue implications of alternative systems of royalties.
2 In the case of New Brunswick, a re-evaluation of the natural gas royalty system was initiated by the New Brunswick Department of Finance in 2011. This continued during the public shale gas consultation process and culminated with the introduction of legislation in 2014, which replaced the previous 10% natural gas royalty with a more complex economic rent royalty1 that varied with the profitability of the businesses. The government consistently argued that the new system would increase revenues to the province. For example, the government’s natural gas group suggested in 2012 that natural gas royalties could yield $2.2 billion per year within twenty years (“Sharing of Royalties” 7), an amount greater than the $1.5 billion in equalization payments received from the federal government. More recently, the February 2016 report of the New Brunswick Commission on Hydraulic Fracturing provided illustrations with annual natural gas royalty revenues between $400 and $600 million annually within twenty years (28). The variations in the estimates were, however, difficult to explain given the lack of transparency regarding the methodologies employed.
3 The principal objective of this paper is to provide a publicly accessible model for estimating New Brunswick royalties from shale gas. To that end, the spreadsheets containing the complete models are available on the website of the Journal of New Brunswick Studies and readers are encouraged to provide their comments to the authors.
4 As context, we begin with a brief description of provincial natural gas royalty systems in Canada, identifying the distinctive aspects of the New Brunswick system. We summarize the historical origins of the current New Brunswick system, followed by a detailed description of how the royalties are calculated. We then explain the methodology we have used to estimate shale gas royalties under four alternative scenarios and provide our quantitative estimates of the potential revenues that could be generated by the new system compared with the old system in those scenarios. The final section of the paper summarizes our conclusions.
The Canadian Context
5 In most provinces, royalty systems for shale gas developed as modifications of conventional natural gas royalty systems. Table 1 summarizes these conventional provincial royalty systems which, with some variations, increase their royalty rates when the price of natural gas and/or the productivity of the particular well increase. They differ in the degree to which royalty rates change with changes in market prices and well productivity, and the extent to which they use developmental incentives to reduce royalty rates. For example, the basic rates in Alberta and Saskatchewan vary with productivity while those in British Columbia do not, except for special programs that provide royalty reductions for especially unproductive wells.
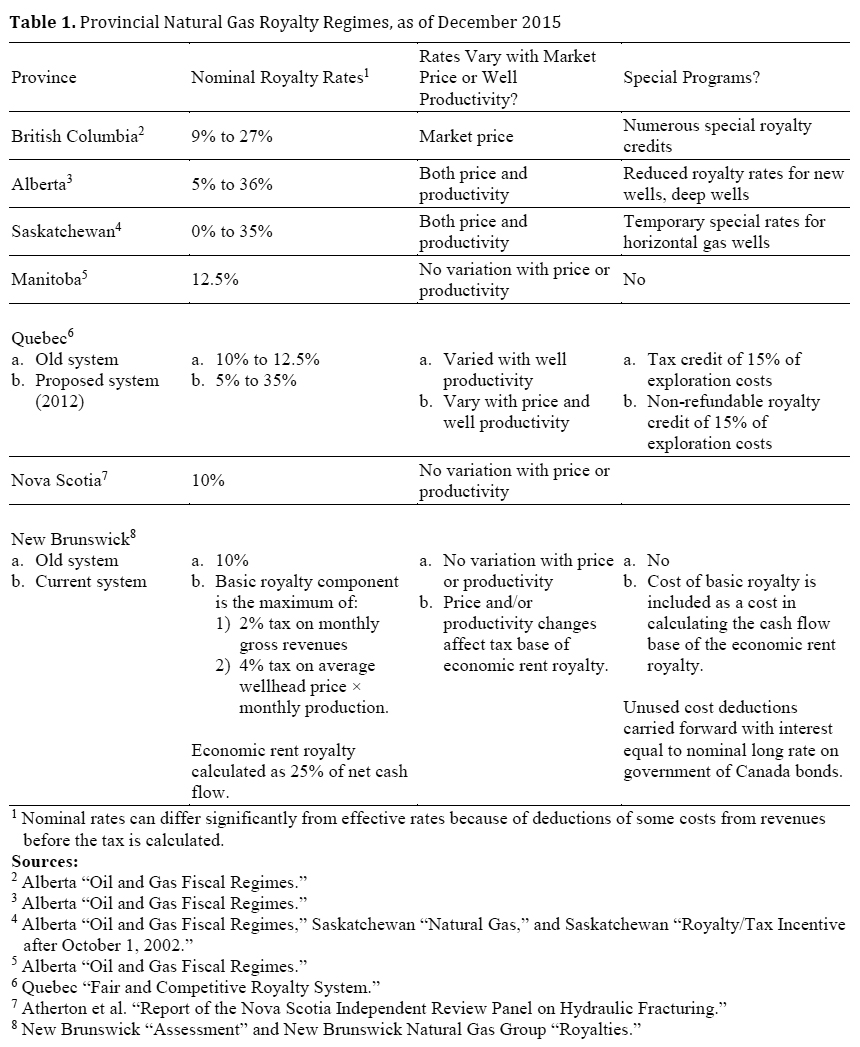 Display large image of Table 1
6 In recent years, the major natural gas producing provinces of Alberta, Saskatchewan, and British Columbia have introduced incentives for shale gas exploitation, driven primarily by tax competition and the desire to accelerate the speed of development, especially in remote areas. With a few exceptions (due primarily to the nature of the particular shale deposits), British Columbia and Alberta have royalty systems for shale gas that are similar in terms of royalty rates and incentives for development of similarly situated reserves. Our focus here is on the royalty systems and not the revenue generated from auctions of exploration rights (bonus bids), which are significant in the western provinces but are not used in New Brunswick.
Historical Overview of New Brunswick’s Natural Gas Royalty Regime
7 Between 2011 and 2014, the government of New Brunswick carried out an internal review of the natural gas royalty regime, as part of a more general review of royalties for natural gas, oil, potash, and minerals. A cornerstone of that review was the conceptual difference between royalties calculated as a percentage of the selling price and royalties designed to capture the economic rent associated with the resource. In the past, royalty payments in New Brunswick were viewed as payment by the private sector for the transfer of ownership of a public resource. No attempt was made to account for the profits or the losses that businesses might experience when extracting the resource. As Table 1 indicates, New Brunswick’s royalty was historically 10% of the wellhead selling price, in contrast with Alberta where royalties could be as high as 36% of revenues, depending on the selling price and the productivities of individual wells.
8 From the economic rent perspective, royalties could capture for the public all “excess profits” (i.e., economic rent or profits in excess of some normal rate of return) that firms might receive from high resource prices or the low production costs that could result from unusually productive gas wells. Moreover, economic rent-based royalties require that the public sector share the risks of losses from low resource prices or high production costs. From this perspective, economic rents could be taxed up to 100% without changing the behaviour of firms. This is so because, by definition, economic rent is a rate of return above and beyond that which is required to induce a firm to undertake a particular investment.
9 In July 2011 the Department of Finance contracted with a private consultant to conduct a theoretical analysis of royalty structures and “propose a royalty structure for oil and gas (including natural gas)…that optimizes the value of resources to New Brunswick in a manner that does not interfere with investment” (New Brunswick “Contract” 4). The report, “An Assessment of Royalty Policy in New Brunswick” (hereafter, “Assessment”), recommended a shift to an economic rent royalty system, a recommendation that became the basis for the shale gas royalty system. Specifically, the consultant recommended a rent-based royalty of 25% (of net cash flow) with a minimum 4% tax on revenues from sales. Current and capital costs were to be fully deducted from revenues in calculating net cash flow; any unused deductions could be carried forward, and minimum royalty payments were to be fully credited against the cash flow tax. The consultant’s recommendations were informed by the theoretical advantages of economic rent royalties and recent experience with rent-based royalties for unconventional oil production in Alberta and internationally (New Brunswick “Assessment” 7). The consultant did not estimate the revenue impacts of the proposed royalty regime.
10 In May 2012, the New Brunswick government announced their public-input process (chaired by Louis LaPierre) for June and provided the public with two documents: “Responsible Environmental Management of Oil and Gas Activities in New Brunswick: Recommendations for Public Discussion” and “Responsible Environmental Management of Oil and Gas Activities in New Brunswick: Sharing of Royalty Revenues from Natural Gas Activities in New Brunswick” (New Brunswick Natural Gas Group). The documents recommended continuation of the historical royalty of 10% of natural gas revenues in addition to a new 40% economic rent royalty calculated using the same methodology as in the consultant’s report (New Brunswick “Assessment”). Of special note is that the proposed royalty regime would not follow the “ring fence” approach of western Canadian provinces; that is, in New Brunswick, shale gas companies could deduct expenses from all of their provincial operations (all wells) against their province-wide net cash flow before paying their economic rent royalty.
11 In October 2012, LaPierre released his report, The Path Forward, which did not comment on the proposed royalty system. In May 2013, the New Brunswick government released “The New Brunswick Oil and Gas Blueprint,” which provided no additional information related to their proposed royalty system. It mentioned that it was continuing to review revenue sharing, and indicated that it was also continuing with stakeholder consultations. In April 2014, the New Brunswick government implemented the new natural gas royalty, combining a minimum percentage royalty on sales revenues (between 2% and 4%) with a 25% economic rent royalty. No background studies were provided to justify the tax rates or to estimate the expected revenues compared with the previous system.
Comparing the Royalty Regimes
12 The economic criteria applied to any tax or royalty include the implications for economic efficiency, equity, costs of administration, tax transparency, and the reliability of the revenue stream (Boadway and Wildasin 225). On efficiency grounds, taxes on economic rents are considered superior to other revenue sources, given their limited impact on private decision-making under competitive market conditions, even when economic rents are taxed at up to 100%.2 However, there is less consensus about the other criteria. From the equity perspective, the issues relate to the distribution of the costs and benefits of resource exploitation for both current and future generations, their methods of estimation, and how the distribution compares to other taxes. Administration of an economic rent royalty will require costly auditing of the financial records of each firm’s operations within the province; such auditing would not be required with a simpler revenue tax. Additionally, tax transparency is limited by the lack of access by the public to corporate proprietary financial information, which is at the core of the royalty calculations. While all of these issues are important in the choice of royalty regime, we confine ourselves in this paper to the analysis of one economic aspect of the shale gas royalty system in New Brunswick: the reliability of the revenue stream, specifically the size and timing of the royalty revenues that New Brunswick might expect from the current royalty system in comparison to the old system.
The Current Natural Gas Royalty Regime in New Brunswick
13 The new regulations for the New Brunswick royalty regime specify that royalty payments consist of a “basic royalty” component and an “economic rent” component calculated on a monthly basis. This basic royalty will be the maximum of (1) 4% of the wellhead price that month multiplied by the production of all wells, and (2) 2% of the monthly gross revenues from natural gas production.
14 The wellhead price in (1) is the weighted average selling price for the month in Canadian dollars less (a) a per-unit gas processing allowance (described below) and (b) the per-unit transportation costs charged by a third party to move the gas from the processing facility to market.
15 The per-unit gas processing allowance, assuming processing is provided by the gas producer, is the sum of the following:
- the direct operating costs (DOC) related to the gathering, processing, and transportation of the gas;
- an overhead allowance set at 10% of DOC;
- a depreciation allowance for those assets used in the gathering, processing, and transportation of the natural gas; and
- a 15% annual return on the average monthly undepreciated balance of capital assets involved in (3).
The sum is then divided by total production from all of the lessee’s wells to get a per-unit cost.
16 The regulations spell out the equation to be used for the economic rent royalty component:
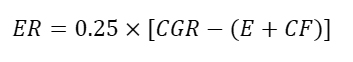
where
E = the sum of all capital expenditures and all operating costs, including the basic royalty component, but not including interest expenses, depreciation expenses, or corporate income taxes
CF = a “carry-forward” amount equal to the values in E from previous periods that could not be deducted from current revenues (because ER cannot be negative). These unused deductions are “carried forward and an annual interest rate equal to the daily average Government of Canada Benchmark Bond Yield: Long Term Rate for the calendar year shall be applied to those expenditures and costs” (New Brunswick Regulation 11(11)).
The Ring Fencing Issue
17 A notable feature of the current New Brunswick system is that royalties are not calculated on a per well basis, as are all other natural gas royalty systems in Canada. The only system in Canada that resembles New Brunswick’s economic rent approach is the British Columbia net profit system for high-cost shale gas wells in the Horn River area. In this case, individual projects are ring-fenced to limit the government’s risk. In the current New Brunswick system, on the other hand, economic profits are calculated on a provincial basis. As a result, if a firm drills wells that are generating an economic profit, it will be able to postpone paying the economic rent royalty if it can offset those profits with the costs of newly drilled wells or costs incurred from the shutdown of old wells.
The Production and Revenue Simulation Model
18 We constructed four scenarios based on alternative assumptions regarding average well productivity. Our cost of production assumptions are based on current costs of exploration, drilling, fracking, operations, and natural gas transportation. We use the latest United States Energy Information Administration (EIA) reference case estimates3 for future natural gas prices and value the Canadian dollar based on purchasing power parity. All our cost and revenue estimates are measured in constant 2016 dollars.
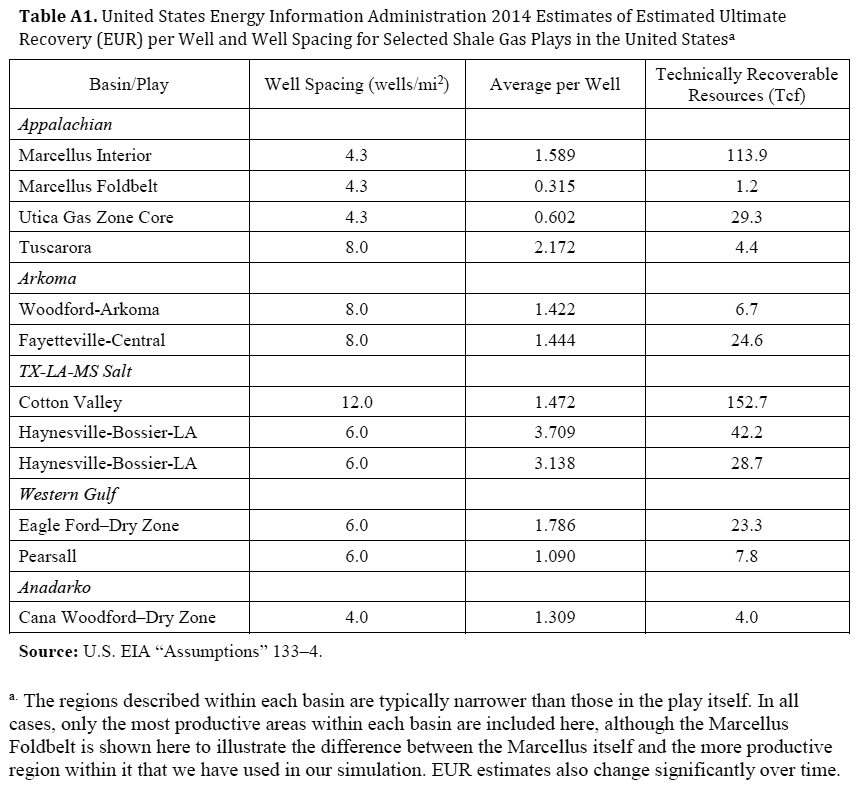
19 An important long-run factor (and a factor with a great degree of uncertainty) is the productivity of the resource, the estimated ultimate recovery (EUR) of each well. The EUR is the cumulative amount of natural gas that could flow from a well (although in practice, the entire amount might not be recovered if low flows result in the shutting down of the well). Our base-case scenario is informed by the historical average EUR of the Marcellus Interior, the most productive area within the Marcellus region, which was estimated by the EIA to have an EUR of 1.589 Bcf (Billion cubic feet). This is significantly higher than the estimated average shale gas well in the United States, which had an EUR of about 1.17 Bcf (U.S. EIA “Annual Energy Outlook 2012” 58). Given that well productivities have increased over time with technological changes and the possibility of fracking the same well more than once, our base-case scenario assumes an EUR of 2.0. For our second scenario, we use the EUR assumed in the Wheeler Report (Atherton et al.), which is 2.5 Bcf. We have also introduced two high EUR scenarios of 3.0 and 3.5 Bcf, which, while substantially above the U.S. average, do occur in some regions in the United States. See Appendix 1 for details.
20 We then use an Arps hyperbolic decline curve model4 to generate annual production from an individual well. Specifically, we assign values for the parameters in the Arps equation that lead to the assumed level of recoverable reserves while providing a reasonable time path for gas flows given experience elsewhere. In each case, we use parameters estimated by the EIA for gas wells in Westmoreland County, Pennsylvania. Given our assumption of identical decline parameters for all wells in a given scenario, the four EUR scenarios have representative wells with similar decline curves, varying primarily in yearly output.5 Production from the representative well in each scenario is then multiplied by the number of wells that were drilled in that year. Our scenarios are for a drilling rate of fifty wells per year. Results for other drilling rates can easily be found by scaling our estimates.
21 Our simulations of natural gas production and the associated royalty revenues assume that the industry consists of a single firm. This reflects the incentive that companies would have to merge under the current economic rent royalty that applies to natural gas production. As noted earlier, the economic rent royalty allows for the carrying forward of any expenses that have not yet been used to offset revenues in the calculation of the royalty. A company whose operations have failed to cover their costs would have valuable unused credits that could be sold to a company with a potentially profitable operation. The two companies would merge and all of the carry-forward amounts would be used. If, across the industry as a whole, there were positive gains to be had (as measured by the provisions in the economic rent royalty), such a process could continue until there were only profit-making companies remaining. Their operations could effectively be considered as taking place in a single company.
22 Each scenario is based on an EIA natural gas price scenario from 2017 to 2041. We use the EIA reference price scenario. These prices, in US$/BTU are converted to US$/Mcf (for compatibility with the production units).6 We use a purchasing power parity exchange rate of 1.23 (the average for the last ten years)7 for all scenarios. Data for field processing costs and pipeline transportation costs8 are then deducted from this gross price to get a “wellhead price” that is the basis for basic royalty calculations.
23 In each period, gross revenues are compared with the ongoing costs of operating the wells in that year. If the gross revenues would not cover the operating costs, including the basic royalty, the producer will shut the well down. This cost is a fixed, one-time amount. Because all wells are assumed to be identical and face the same conditions, wells of a given age either all remain operational or are all shut down.
24 For the new royalty regime, base royalties are calculated based on the maximum of (a) 2% of gross revenue (using the market price and current rate of production) and (b) 4% of the value of the gas using the wellhead price described earlier. If the wells in question have shut down (based on the earlier calculation), zero royalties are collected. To calculate the revenues from the previous royalty regime, the 2% gross revenue royalty is set to zero and the 4% rate is set to 10%. The economic rent royalty rate, described next, is then set to zero.
25 The economic rent royalty requires a calculation of the net cash flow generated by wells of each vintage. The net cash flow in each period equals that period’s gross revenue minus costs, including basic royalties. The value for the first year of each well’s life consists of a single amount to cover all costs associated with the well before it can begin production. These costs are carried forward to the next year, with interest. For each subsequent year, net cash flow for that year is compared with the carry-forward amount. If the difference between the net cash flow in that year and the carry-forward amount is positive, then no more expenses are carried forward for those wells and an economic profit on those wells has appeared. Otherwise, the unused costs are carried forward. This continues year after year until either (a) the positive net cash flow in each year more than offsets the expenses being carried forward so that the cumulative net cash flow becomes positive; (b) twenty-five years is reached and the simulation stops; or (c) the well is shut down.
26 This illustrates a crucial feature of the new royalty system noted earlier: it does not “ring fence” wells, so that expenses from some wells can be used to offset positive net cash flows from other wells. Only when cumulative net cash flows become positive across all existing wells does the firm pay the economic rent royalty. Thus, it is possible to have zero economic rent royalty being paid during the entire twenty-five year simulation period, yet many wells could at some point in their lives experience positive economic profits.
27 Lastly, we calculate the yearly basic royalty revenues and economic rent revenues in each scenario and, applying a real social discount rate of 3%, estimate the present value for each of the royalty revenue streams over the twenty-five-year time horizon.
Scenarios and Discussion
28 In Table 2, we summarize our findings for the four scenarios. There are three main points of interest. First, the royalty revenues are highly sensitive to the EUR. Given an EUR of 2.0 Bcf (slightly higher than the historical Marcellus experience), the old system yields 32% more present value revenue than the new system. With a higher EUR of 2.5 Bcf, the new system yields 15% more revenue. With the higher EURs of 3.0 and 3.5 Bcf, the new system yields, respectively, 46% and 69% more revenue than the old system. Second, the impact of the current royalty system on provincial revenues is relatively small in the context of an $8 billion provincial budget. For example, in the EUR 2.5 scenario, it is ten years before there is a net cash flow for purposes of calculating the economic rent portion, and annual revenues are less than $35 million during the first nine years. It is only in the high EUR cases where revenues are high enough to have significant impacts on provincial finances. Third, our scenarios suggest that it is unclear whether the royalty system introduced in 2014 will yield higher revenues than the previous system. That will depend on the average EUR of wells, which is uncertain. Fourth, the scenarios demonstrate that all projections are very sensitive to the choice of assumptions. We have based our scenarios on alternative assumptions about the productivity of the resource, as it has a great deal of uncertainty. Our other assumptions are given with the detailed spreadsheets (available at the JNBS website) and the specific cost assumptions are described in Appendix 3.
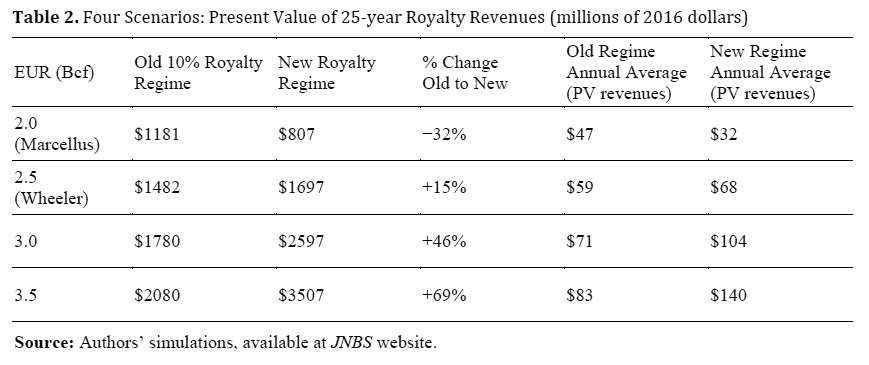 Display large image of Table 2
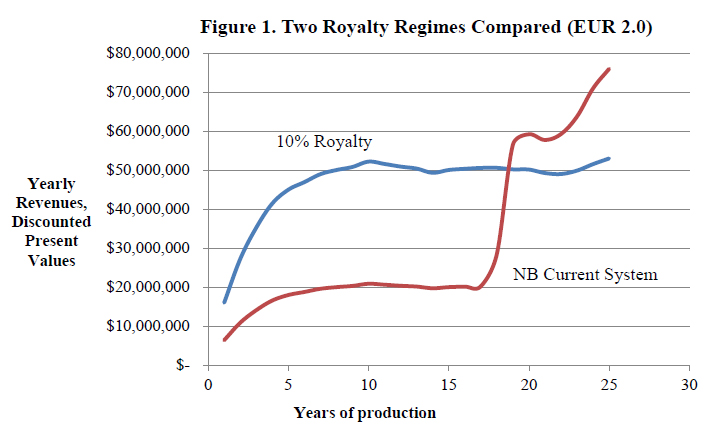
29 All royalty systems based on economic rent, as opposed to a fixed percent of revenue, involve the government sharing more of the risk associated with the uncertainty of future well productivity. This is demonstrated in Figure 1, which illustrates how the new royalty system gives up revenues in the early years in expectation of higher royalty revenues in later years. In this case (EUR 2.0), it is not until the nineteenth year that the new system generates revenues greater than the previous system. Further, the higher revenues in later years would not compensate for the lost revenues in the early years. Should the average EUR prove to be significantly higher, then the converse would apply. This is demonstrated by the relatively higher discounted present value of the revenue stream of the new royalty system when the average EUR is 2.5 or higher. If the productivity of the average well is higher, then the new system will generate relatively higher revenues.
Conclusion
30 The decision about whether or not to produce natural gas by fracking requires consideration of its social, environmental, public health, and economic consequences. One component of the economic consequences is the effect on government royalties paid by corporations for the privilege of exploiting the publicly owned resource.
31 The objective of this research was to develop a publicly available model to evaluate the revenue claims associated with the new natural gas royalty system introduced in New Brunswick in 2014. In the process, we have drawn attention to some of the economic aspects of the royalty system. These include the considerable uncertainty associated with any revenue projections and the general risk sharing (with private developers) that the province has taken by including a tax on economic rent as an important component of the new system. We have focused on one area with a great degree of uncertainty—the productivity of the shale resource and its relation to royalty revenues.
32 We have concluded that the new royalty regime could produce more revenues than the old regime on a present value basis only if well productivities are relatively high. Additionally, the time profiles of revenues differ significantly between the old and new systems. The old royalty regime produces relatively more revenues in the early years of development, while the new regime postpones revenues in the hope that economic rents will materialize to be taxed in the future. As a result, shale gas royalties under the new regime would not make a significant contribution to the province’s finances in the early years of development, and would only do so in the longer term with high well productivities. In the future, if New Brunswick decides to open the shale gas moratorium for public discussion, our model may be of assistance in providing the public with an understanding of the royalties which shale gas may, or may not, deliver.
Maggie FitzGerald Murphy is a doctoral candidate in the Department of Political Science at Carleton University, Ottawa, Ontario.
Andrew G. Secord is an Associate Professor in the Department of Economics at St. Thomas University.
Appendix 1
 Display large image of Table A1
Appendix 2
The Arps Hyperbolic Decline Curve
34 One widely used approach to modelling the flow of gas from a well is the Arps decline curve model, which originated with Arps (“Analysis of Decline Curves,” “Estimation of Primary Reserves”). As Lee and Sidle explain, most available methodologies for forecasting production of tight gas and shale gas result in significant uncertainties because of complications arising from the geological properties of the reserves.
35 It is important to note that we are not using the model to estimate reserves, where the uncertainties just noted are relevant. Instead, we use parameters for the Arps model to create a plausible account of a flow of gas that ultimately yields the amount of recoverable reserves that we have assumed for that simulation. Compared with the approach adopted in the Wheeler Report (Atherton et al.), the Arps decline curve typically offers a production scenario with a longer production life that is compatible with the same overall assumption about what will ultimately be extracted from the well. While this assumption of a slower production rate postpones some revenue receipts, the future production also fetches a higher price.
36 The general form of the Arps decline curve is:
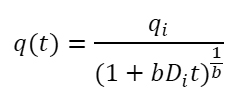
where q(t) is the production rate at time t, qi is the initial production rate, Di is the initial nominal decline rate, t is time, and b is the hyperbolic exponent which describes the degree of curvature of the line. The b value can be adjusted to alter the time units: bannually = 12bmonthly = 365bdaily (Guo, Lyons, and Ghalambor).
This is an empirical model, where qi, Di, and the b value are, in principle, determined by estimating best fit values based upon historical data of well production. The cumulative production function is:
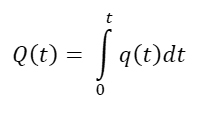
Given the form of the Arps decline curve, this becomes:
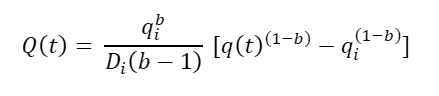
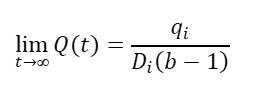
If 0<b<1, the limit is finite:
Appendix 3
Costs
Pipeline Transportation Costs
Gardner and Hayes explain that
If the natural gas produced in the Maritimes is exported to the United States, the wellhead price in New Brunswick would be the New England price less the transportation cost between New Brunswick and New England. According to Gardner and Hayes, the tariff on the American segment of the Maritime and Northeast Pipeline is US$0.54/Mcf, and C$0.805 is the charge on the Canadian section. We deduct these values from the New England price, adjusting the American dollar cost in accordance with our exchange rate assumptions, to get an estimate of the market price producers would face in New Brunswick.
Exploration, Drilling and Extraction and Well Abandonment Costs
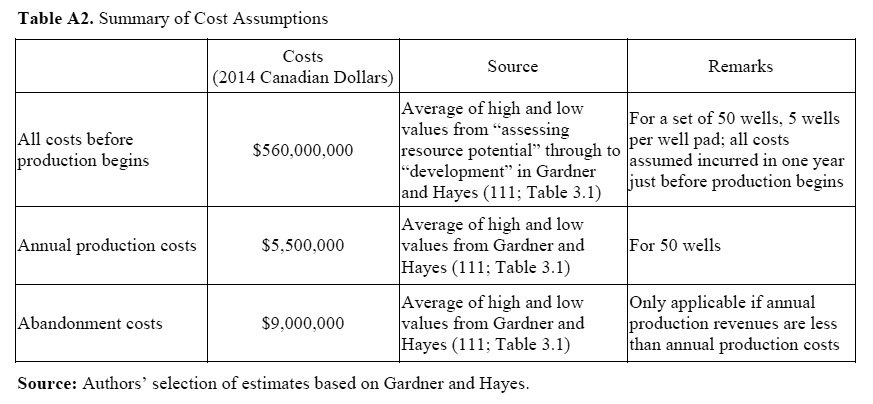
The Deloitte Report, prepared for the Business Council of New Brunswick, sets out a rough estimate of development costs per well by phase of development and by type of expenditure (20–22). In their contribution to the Wheeler Report, Gardner and Hayes (111, Table 3.1) set out a separate set of assumptions about costs.
The overall cost estimates are broadly similar: the Deloitte cost estimate for fifty wells is $663 million, somewhat above the high end of the values in Gardner and Hayes. However, we have adopted the Gardner and Hayes estimates because they are more detailed: they include the costs of an exploration well and are explicit about the number of wells/well pad (this is significant, as costs per well are lowered by having more wells on each pad). Table A2 summarizes the costs we have assumed for each set of fifty wells in our simulation. These costs are used in the net cash flow calculations needed for the economic rent royalty.
Immediately relevant for the royalties are costs of gathering and processing the gas, which are deducted from the market value of the gas in collecting the basic royalty. Gardner and Hayes assume that these “field processing costs” decline steadily from $1/Mcf to $0.70/Mcf over the twenty-five years that we are examining (119; see column 8 of Table 3.3). We also use these values.