Articles
Searching For Tornadoes:
The Upcoming Dementia Crisis in New Brunswick
Abstract
This study demonstrates the importance of geography and demography in discussions of dementia in New Brunswick. The aging baby boom generation combined with increasing life expectancy will result in a doubling of dementia cases over the next twenty years. During the same period, the prime age population in many parts of the province will decline as a result of the outmigration of the province’s youth. The prime age population plays an important role in both the diagnosis of dementia and the delivering of home care. This article argues that policy responses must not only take into account the increase in dementia cases and the decline in the prime age population but also the significant regional demographic and socioeconomic differences across the province.
Résumé
Cette étude montre l’importance de la géographie et de la démographie dans les discussions sur la démence au Nouveau-Brunswick. La réalité de la génération vieillissante du baby-boom, combinée à un accroissement de la durée de vie, contribuera à doubler les cas de démence au cours des vingt prochaines années. Au cours de la même période, la population d’âge intermédiaire de nombreuses régions de la province sera moins importante en raison de l’exode des jeunes de la province. La population d’âge intermédiaire joue un rôle crucial à la fois dans le diagnostic de la démence et la prestation de services de soins à domicile. Dans cet article, l’auteur fait valoir que les réponses politiques ne doivent pas seulement tenir compte de l’augmentation des cas de démence et du déclin de la population d’âge intermédiaire; elles doivent aussi prendre en considération les différences démographiques et socioéconomiques régionales importantes de l’ensemble de la province.
Introduction
1 In 2010, the Alzheimer Society of Canada released a major study about the impact of dementia on Canadian society over the next thirty years. This study, Rising Tide: The Impact of Dementia on Canadian Society (Dudgeon), predicted that the number of Canadians with Alzheimer’s disease or a related form of dementia would soon more than double, from 500,000 in 2008 to 1.1 million in 2038. Over the same period, the cost of dementia care is forecast to rise from $15 billion to $153 billion,1 while the time that Canadians spend providing informal care is expected to increase from 231 million hours to 756 million hours. Dementia is a complex disease with many forms and a wide variety of potential causes. Alzheimer’s disease is the most common type of dementia, accounting for approximately 63 percent of the total cases. It can strike young (the form known as early-onset dementia) or old, and it results in a gradual memory loss, an eventual inability to live independently, and ultimately death. About 1 percent of people between sixty and sixty-five suffer from dementia. This rises to over 10 percent in the eighty to eighty-five age group and to about 50 percent among those over the age of ninety. The increase in dementia cases predicted in the study Rising Tide is primarily a result of the aging baby boom generation and increasing life expectancy. Dementia is not like most other diseases. It is difficult to diagnose. The decline in cognitive functioning must be observed by the person suffering the decline or detected by others with close enough contact to witness the deterioration, who may then initiate contact with a doctor. Given the negative social stigma associated with cognitive decline, those suffering from the disease often reduce contact with others as the disease progresses. Even if medical attention is sought, diagnosis is still a challenge because many health care providers are not trained to distinguish dementia from the cognitive decline that is associated with the natural aging process.
2 The public health care system does not treat dementia like other diseases. There is currently no cure for dementia, although drugs can be used to slow down the cognitive deterioration process. This treatment works best when initiated during the first stages of the disease, thus early diagnosis is an important part of any strategy to contain the costs associated with dementia care. Another important feature of dementia care is that it is not covered by either public or private health insurance. Instead, the costs of care have to be largely covered by the patient’s family. In the early stages, dementia care is provided in the home, often by family or paid caregivers. At later stages, however, patients are often institutionalized in a nursing home with the costs covered by the family.
3 The increasing prevalence of dementia expected over the next several decades will challenge the current health system. The Alzheimer Society argues that Canada needs to put a plan in place for dealing with dementia immediately. Its preferred plan has a number of components. First, increased physical activity among the elderly must be encouraged because it can reduce the incidence of dementia. Second, greater amounts of funding for medical research must be made available to researchers in the hope that better treatment options or even a cure for the disease are discovered. Third, a campaign designed to increase awareness among not only the public but also the medical community must be launched in order to reduce the stigma associated with the disease and to improve determinations of its diagnosis. Fourth, increased support for family and professional caregivers must be sought in an attempt to keep patients in their own homes as long as possible, given the relatively high costs of institutionalized care. Fifth, a plan to cope with the coming growth in the demand for institutional beds must be developed. And sixth, an integrative care model that is easy to navigate must be instituted.
4 Identifying the challenges posed by dementia in New Brunswick requires a consideration of the demographic and economic factors that affect those challenges. Forecasts based on data produced by Statistics Canada’s demographic forecasting model and the prevalence estimates given in Dudgeon suggest that the number of dementia cases in New Brunswick will rise from 11,000 in 2011 to over 23,000 in 2031 (Figure 1). Table 1 shows the estimated dementia cases per hundred people aged twenty- five and older to control for differences in population across various counties in the province. The cost of care, however, will rise much more quickly. Assuming that the complex costing model used in the Rising Tide study produces reasonable cost-per-case estimates and that the national estimates can be applied to New Brunswick, the total costs of dementia care in this province will rise from $339 million in 2011 to over $2 billion in 2031. Currently, most of the cost of dementia care is borne by those suffering from the disease and their families, not the government and its taxpayers. Cost of care estimates include opportunity costs as well as the labour income lost as a result of family members providing care. Table 2 reports estimates for the cost of dementia and the number of hours of informal care by county. While the challenges posed by the increasing prevalence and cost of dementia in New Brunswick are clearly great, provincial-level analysis further obscures some of the biggest challenges. One of the most important factors that must be addressed involves the demographic developments at the sub-provincial level. Age-selective migration has implications for both the diagnosis and the availability of in-home family care in many, but not all, areas of the province. Unfortunately, Statistics Canada does not produce demographic projections at the sub-provincial level. A simple projection model developed to forecast demographic change at the census division and census subdivision levels will help to overcome these particular hurdles.
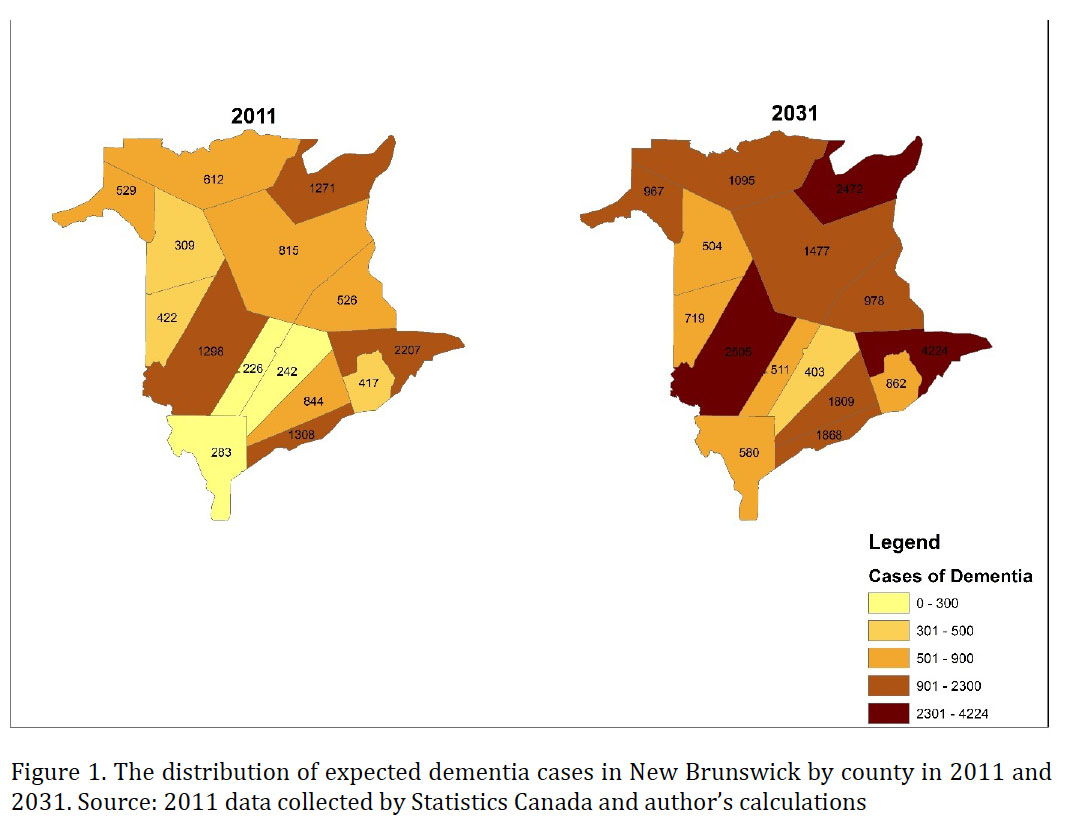 Display large image of Figure 1
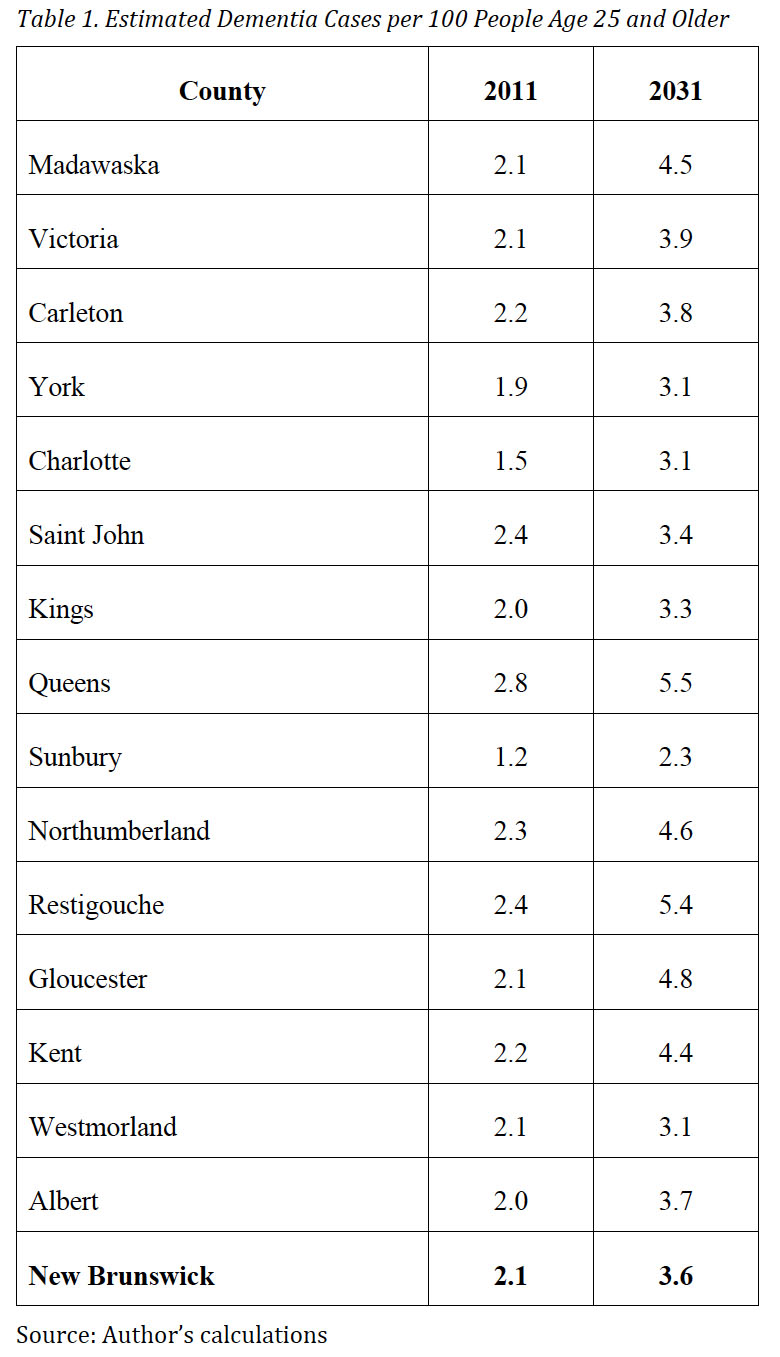 Display large image of Table 1
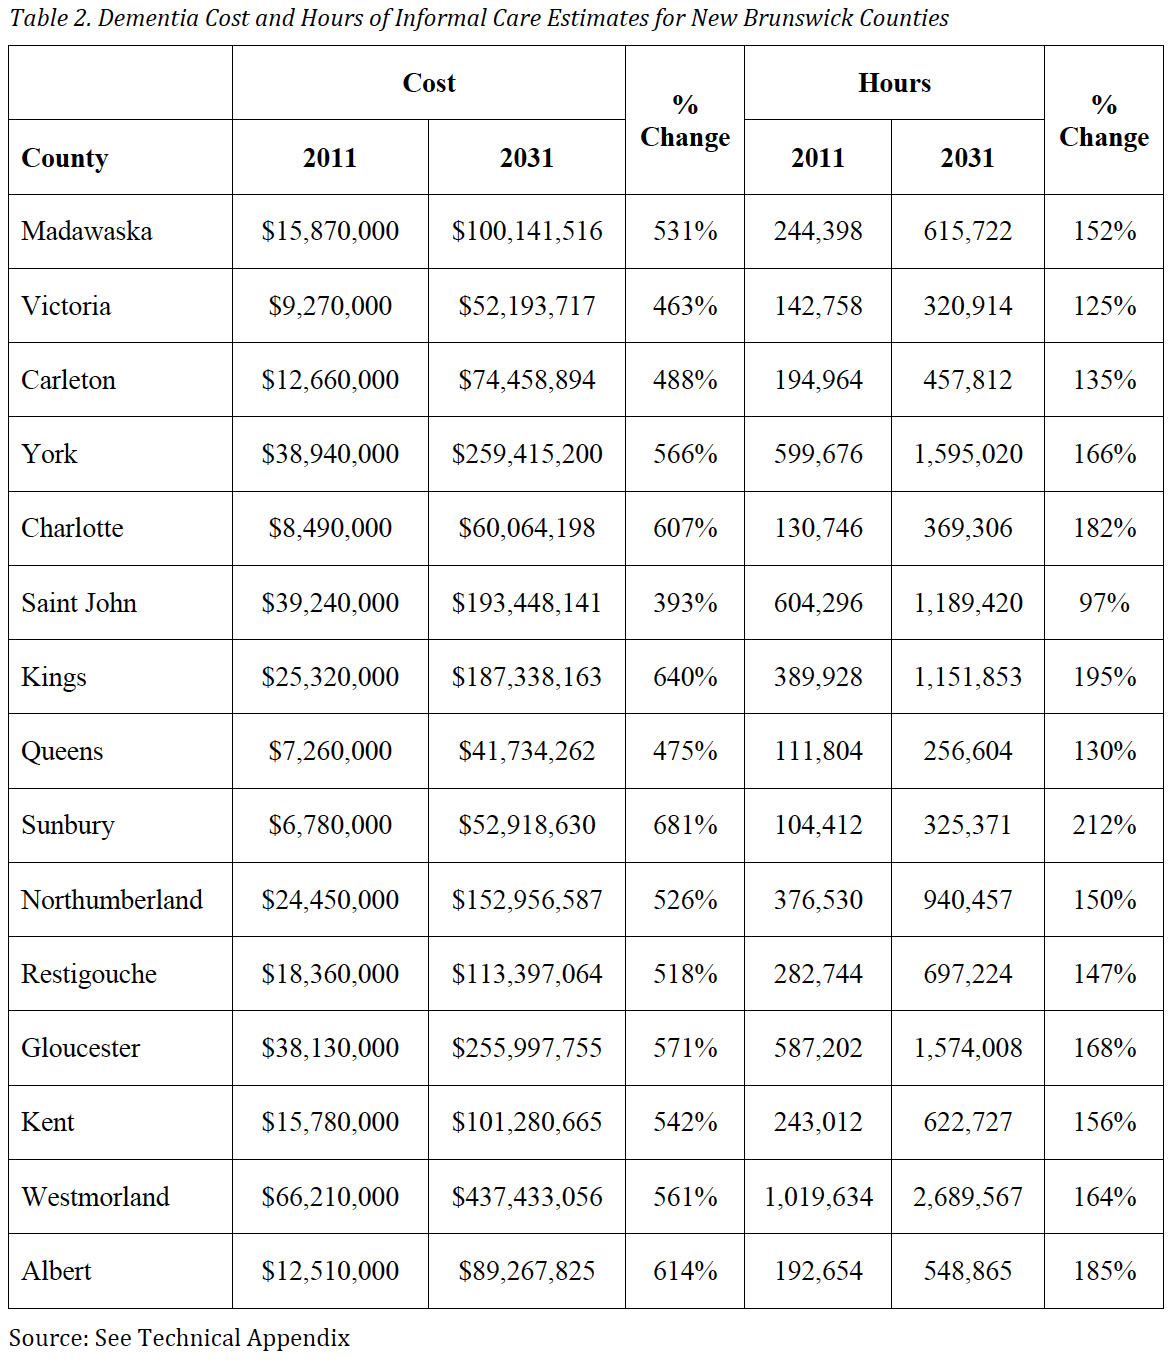 Display large image of Table 2
Population Projections and Tornadoes: A Tale of Two Cities
5 The model used to make the demographic projections presented in this study is simple. In each census year, the population is enumerated and each person can be assigned to an age cohort. At the next census, five years later, everyone in the cohort will be five years older. If there were no deaths and no in-migration or outmigration, the number of people in the cohort would remain unchanged, although the reality is that there are deaths and people do move. The most important part of the forecasting model involves parameters that measure the proportion of a cohort whose members die or move during each five-year interval.
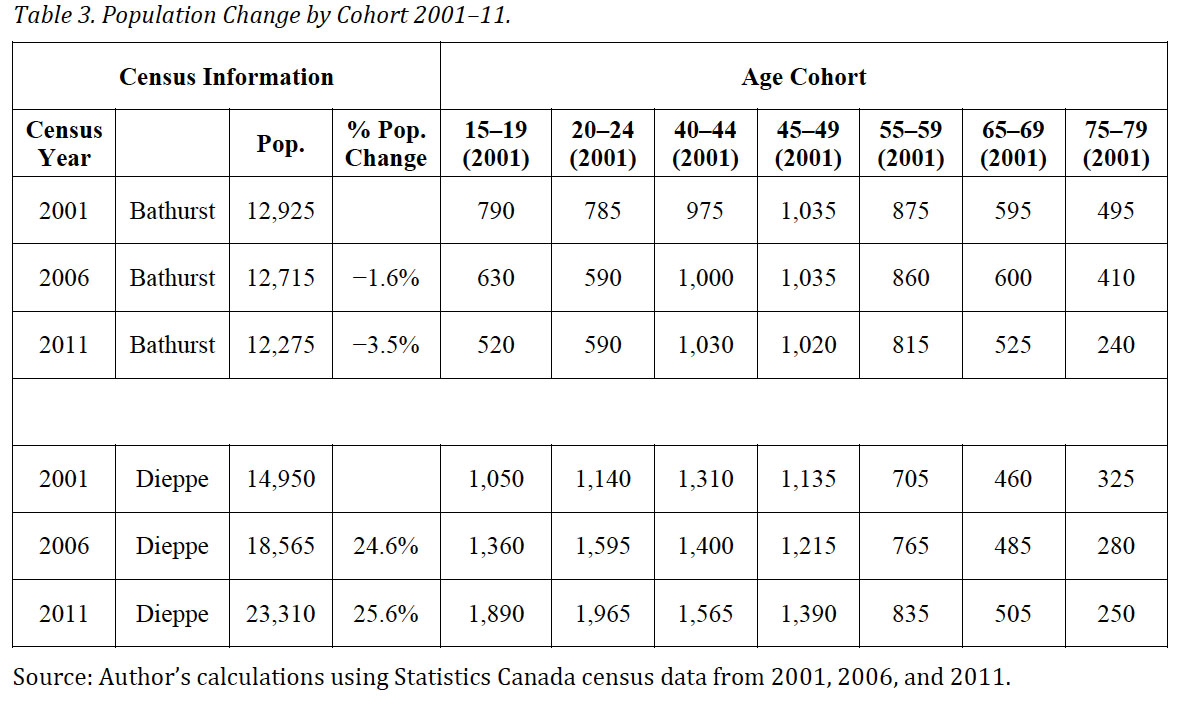
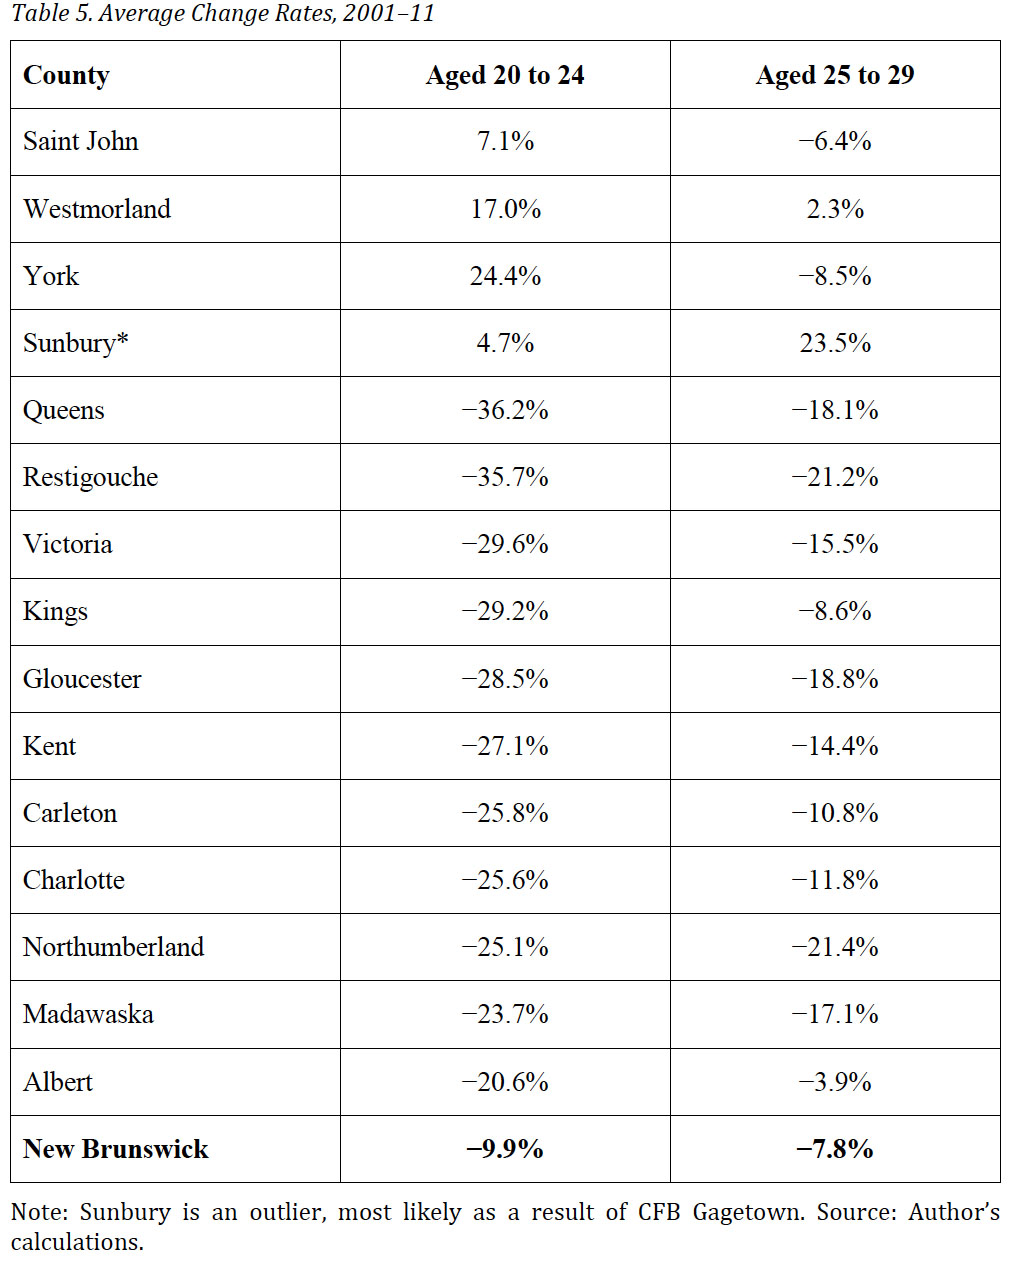
6 The model can be illustrated using the examples of the two New Brunswick cities of Bathurst and Dieppe, which were chosen because the latter is growing rapidly whereas the former is experiencing a decline in population. The fifth column in Table 3 shows the leakage from the cohort aged fifteen to nineteen in 2001. In Bathurst, at the time of the 2001 Census, there were 790 people between the ages of fifteen and nineteen. In 2006, however, the Census found there were only 630 people between the ages of twenty and twenty-four, which means that 160 people in the cohort “disappeared” due to death or migration. The proportion of the cohort that disappeared is −160/790 = −20.3%. In 2011, the Census revealed that the number of people in Bathurst aged twenty-five to twenty-nine was 520, which constitutes an additional leakage of 110 and a proportional change of −21.1%. A quick examination of the table reveals that migration is highly selective by age—specifically, young people are much more likely to move than older people. The seventy-five to seventy-nine cohort also experiences a significant decline for an obvious reason, death; in Bathurst, the seventy-five to seventy-nine cohort shrunk from 495 in 2001 to 240 in 2011.
 Display large image of Table 3
7 The population projections in this study presume that the pattern of population change observed between 2001 and 2011 will continue in the future. For example, Table 3 shows that the size of the cohort in Bathurst aged twenty to twenty-four fell by 195 (24.8%) between 2001 and 2006. The size of the cohort aged twenty to twenty-four fell by 110 (21.1%) between 2006 and 2011. On average, the twenty to twenty-four cohort declined by 22.95% and it is assumed that the same age group in Bathurst will decrease at this rate throughout the forecast period, which runs from 2016 to 2031. If new economic opportunities are created close to home and/or should jobs become scarce in farther-away areas, our population estimates will be too low, whereas if local economies fail to result in employment opportunities, our population estimates will be too high. Also, people who migrated as youth might choose to return to New Brunswick when they are older, or aging parents might outmigrate to be closer to children who live outside the province. However, using the pattern of population change observed over the 2001 to 2011 period as the basis for the population projections is not unreasonable, even given these additional factors.
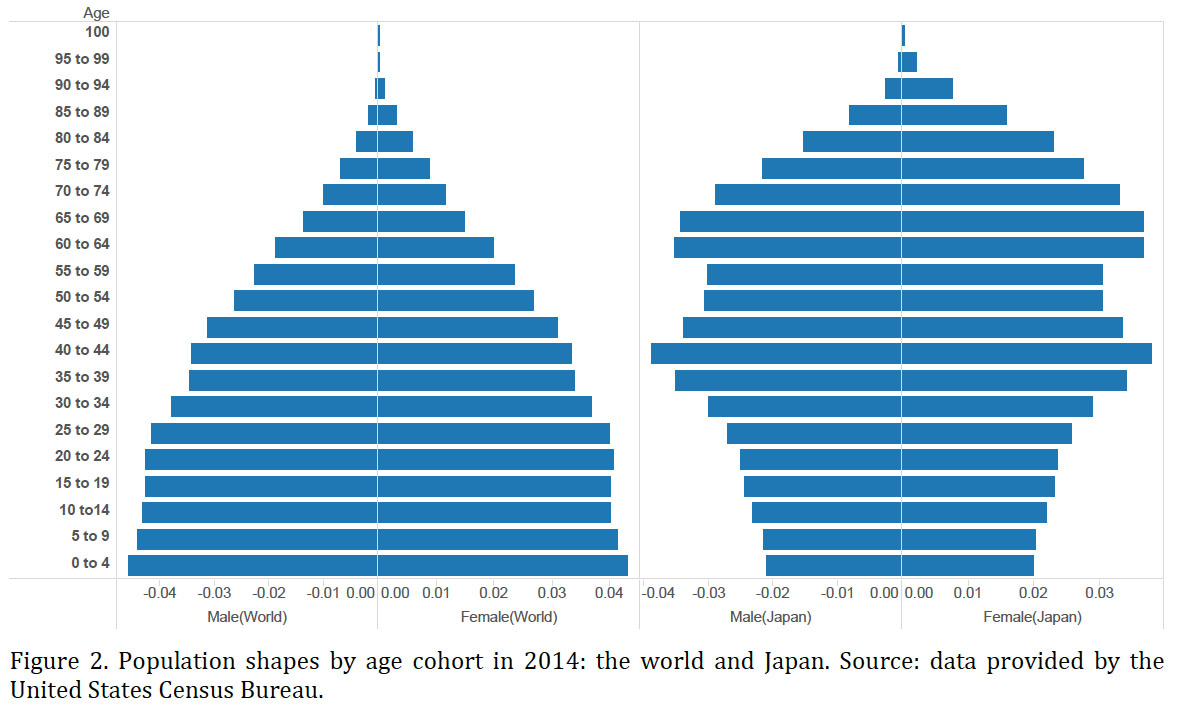
8 One of the most significant outcomes of this projection exercise is a population pyramid. Figure 2 shows two population shapes, one for the world in 2014 and the other for Japan in the same year. The distribution of the world’s population by age and gender generates a picture that resembles a pyramid. The youngest cohort (zero to four) is the largest and the proportion of the population in each cohort declines with age. The picture for Japan, however, does not resemble a pyramid. The largest cohort in Japan is not zero to four (the segment that accounts for approximately 4 percent of the Japanese population); instead, the forty to forty-four age group (the segment that accounts for about 8 percent of the population) predominates. Japan’s model looks more like an urn than a pyramid; this deviation from the pyramid model is a matter for concern and it is relevant in the case of New Brunswick. Figure 3 reports the census data from 2001 and the model-based projections for 2031 for Dieppe and Bathurst. Unlike Figure 2, it focuses only on the population over twenty years of age. Focusing on the over-twenty population allows us to avoid making assumptions about fertility rates without losing any information relevant to an analysis of dementia. Moreover, the long-term impact of age-selective migration on the depopulating city of Bathurst is striking. Indeed, in 2031, the projected age distribution of the population in Bathurst looks more like a tornado than a pyramid. The data for Dieppe, in contrast, do not generate a tornado.
 Display large image of Figure 2
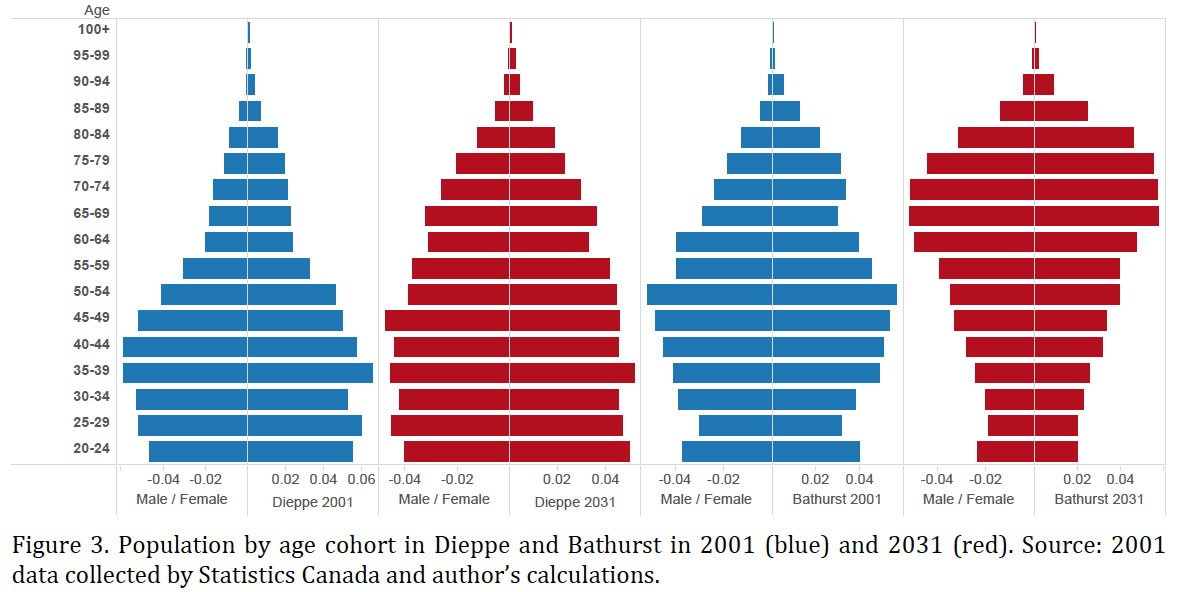 Display large image of Figure 3
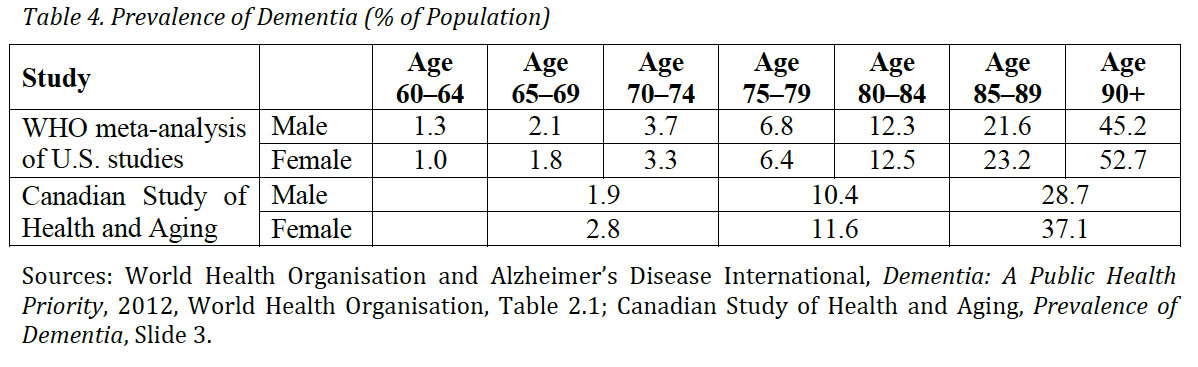
9 The population projections also provide the basis for our forecast of dementia cases. The number of dementia cases can be forecasted using the following formula: Ai,t = αi *Pi,t , where αi is the prevalence rate (the proportion of cohort i affected by dementia) as estimated by the World Health Organization and the Canadian Study of Health and Aging; Pi,t is the population in cohort i at time t; and Ai,t is the number of dementia cases in cohort i at time t. The relationship between age and dementia is clearly evident in Table 4. The World Health Organisation estimates that 45 percent of men and over 52 percent of women over the age of ninety will be affected by the disease. The Canadian Study of Health and Aging estimates that 85 percent of people one hundred five years of age or older suffer from dementia.
 Display large image of Table 4
Searching For Tornadoes: Rural New Brunswick
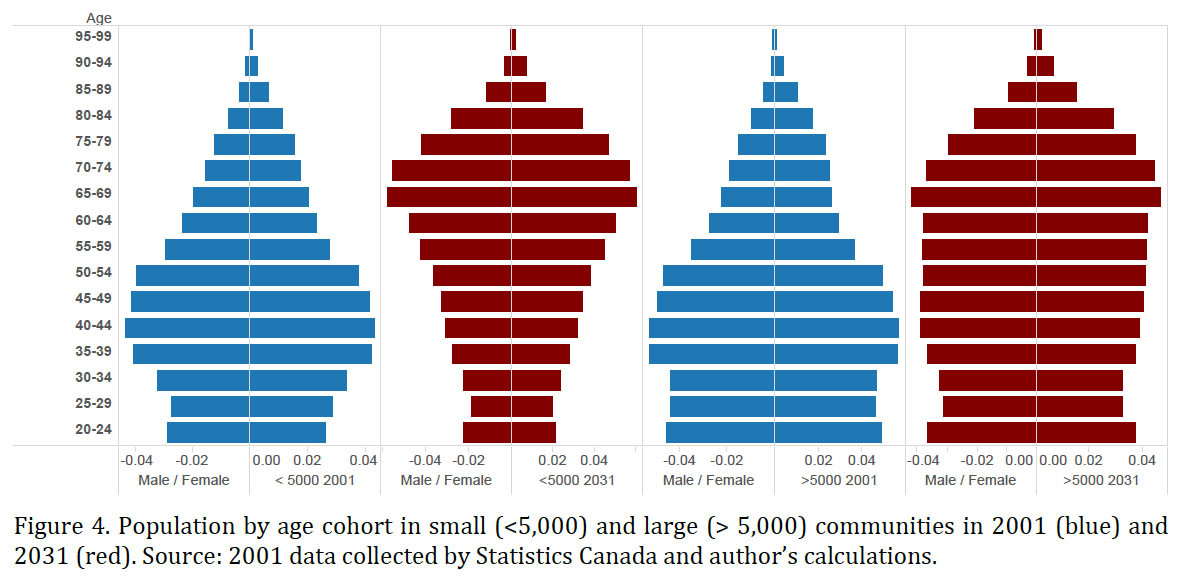
10 For the rural areas of New Brunswick, the age distribution data are likely to resemble a tornado. For our purposes, rural is crudely defined as any census subdivision with a population of fewer than five thousand people. Figure 4 compares projections for rural and non-rural areas of the province.
 Display large image of Figure 4
11 Dementia in rural areas is a more difficult problem to tackle than dementia in larger centres. Home care services are more expensive given the longer distances between homes and institutions; such services are often not available at all and health care professionals are difficult to access in remote communities. With a population tornado, these realities become even more challenging for family and friends, who are usually important in the process of diagnosis. They observe the gradual changes in cognitive impairment and they are the ones who typically initiate contact with the formal medical system, which provides an official diagnosis. Because the institutionalized medical system does not have a single diagnostic test to identify dementia, however, regular testing over an extended period involving a variety of health practitioners may be necessary. Family and friends must take responsibility for transporting the person suffering from the disease to and from the testing facilities. If there are no family members in the area, an early diagnosis is unlikely. Short visits to a loved one’s home by family members are unlikely to generate early diagnosis, as even experienced health care practitioners find it difficult to distinguish dementia in the early stages of the disease from the “seniors’ moments” associated with the natural course of aging. Because an early diagnosis is the primary means of planning for and coping with dementia in a cost-effective way, the location of patients in rural communities and their separation from loved ones create a major problem with no obvious solution.
12 Furthermore, if family members are not in the area, they cannot provide care and support. Dementia inevitably results in the affected individual losing the ability to function independently. Simple tasks like getting groceries, cooking, and bathing become progressively difficult to complete for the affected individual, and family members typically provide the needed help. The absence of family members might be offset by a tight-knit local community, but this seems unlikely in most cases. An individual suffering from dementia will typically withdraw socially and consequently lose contact with the community. Because others in a tornado community are also aging, they are less mobile and less able to help; younger people in a tornado community will likely concentrate on helping immediate family, given the scarcity of helpers and the high demand for help from aging community members. Moreover, as dementia progresses, the level and type of required care changes. Taking someone to get groceries or dropping in regularly to check in on a neighbour are activities that a keen and helpful community member might do. Dealing with personal hygiene issues or imposing and enforcing a driving ban if needed, however, are challenges that are generally much too difficult for a friend or community member.
13 The government of New Brunswick does provide some home support through the regional offices of Family and Community Health Services. These services are not covered by government health insurance and a means test is administered to determine if a client qualifies for a subsidy. Furthermore, potential clients are carefully assessed to identify need because resources are scarce and only the ones who require them most qualify. Private and volunteer home care services are also available in many areas of the province. Both the Red Cross and Meals on Wheels provide such services, but they are not generally available in rural areas. Privately contracted services are also hard to secure in rural areas. A tornado pattern has an independent effect on both the demand for and the supply of home support services. Aging creates new demand, while the absence of young people potentially reduces supply.
14 Throughout New Brunswick, dementia in urban centres will be less challenging to face than dementia in rural areas. Not only does population density help, but New Brunswick’s urban centres will not be subjected to severe tornado effects. Figure 5 presents data for the three largest centres in the province. The bottom line is that policies to cope with the upcoming dementia crisis will have to be different in urban and rural areas. Because the policy prescriptions in Rising Tide do not take geographic or demographic factors into account, they are likely to fail in rural areas and in communities facing a tornado effect. The government of New Brunswick’s new Home First program—which “outlines a series of innovative approaches, strategies and initiatives to support seniors to live in their own homes and continue to be part of their communities”—is also likely to fail in rural and tornado communities.
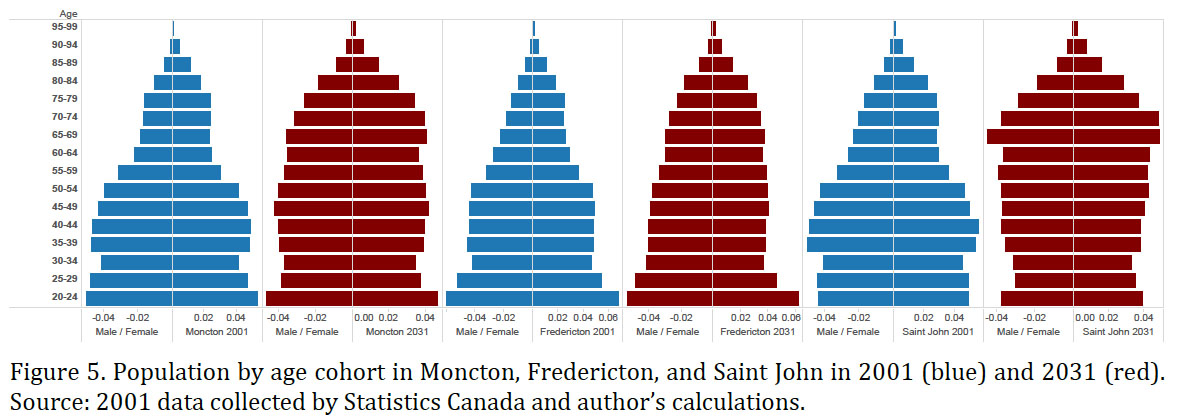 Display large image of Figure 5
15 Additional Tornado Searching
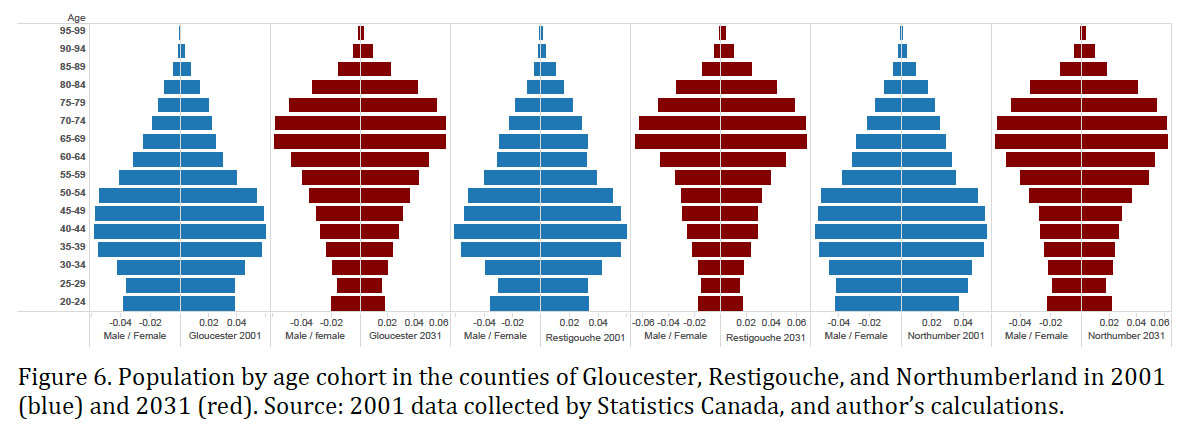
16 Figures 6 through 10 show population shapes for each census subdivision in New Brunswick. Clearly, most of these regions are developing tornadoes. Every county in northern New Brunswick is projected to develop tornado populations by 2031, but this is not exclusively a problem of the north. The population models of the counties of Kent, Charlotte, and Queens also resemble tornadoes.
 Display large image of Figure 6
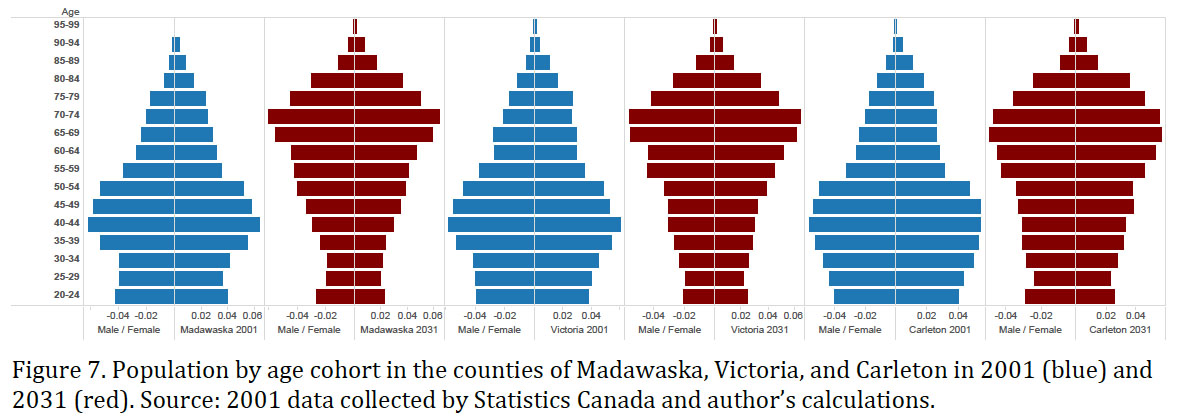 Display large image of Figure 7
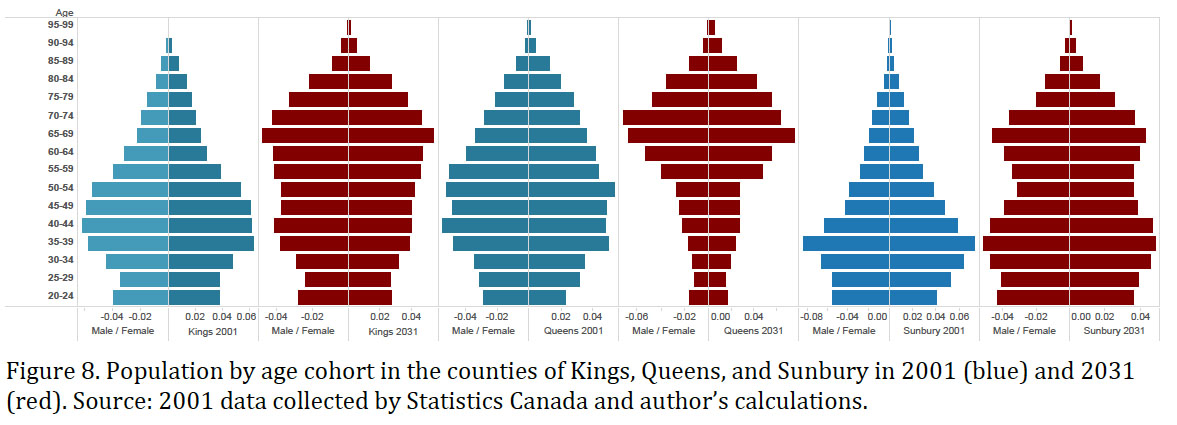 Display large image of Figure 8
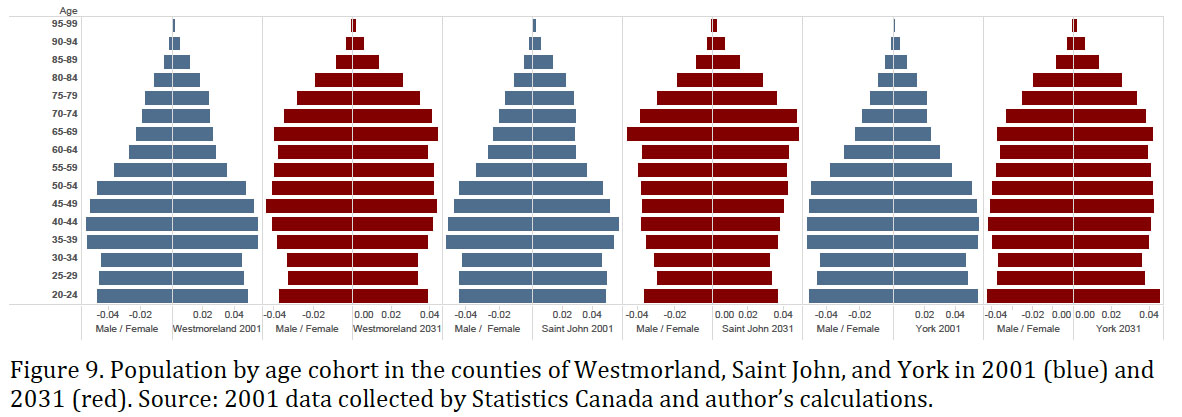 Display large image of Figure 9
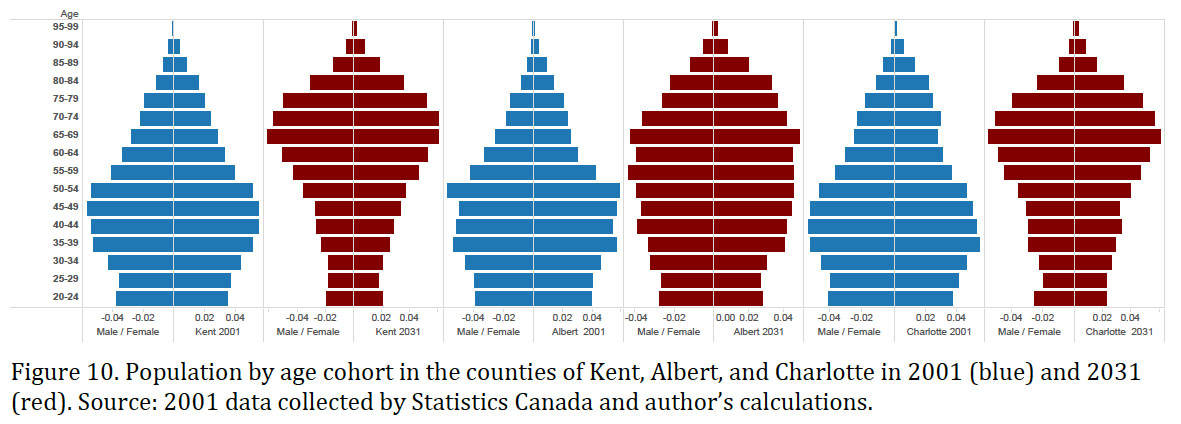 Display large image of Figure 10
17 Table 5 presents data on outmigration by county, demonstrating that the outmigration of the young is the major cause of a tornado. The province as a whole is losing young people, but the counties that contain a major centre are not, which suggests that the young are often relocating within the province from rural areas to one of the major centres. The outmigration rate of the twenty to twenty-four cohort is over 20 percent in most counties. Even counties that are not expected to have full-blown tornadoes by 2031 will face difficulties with both the diagnosis and the provision of home care. Figure 11 reports changes in the ratio of the population between the ages of forty and sixty-five (children of the elderly, who are the potential caregivers, will typically be in this age group) to the population over sixty- five (who are potentially in need of care). The demographic forecast suggests that it will become increasingly difficult to provide home care across the province.
 Display large image of Table 5
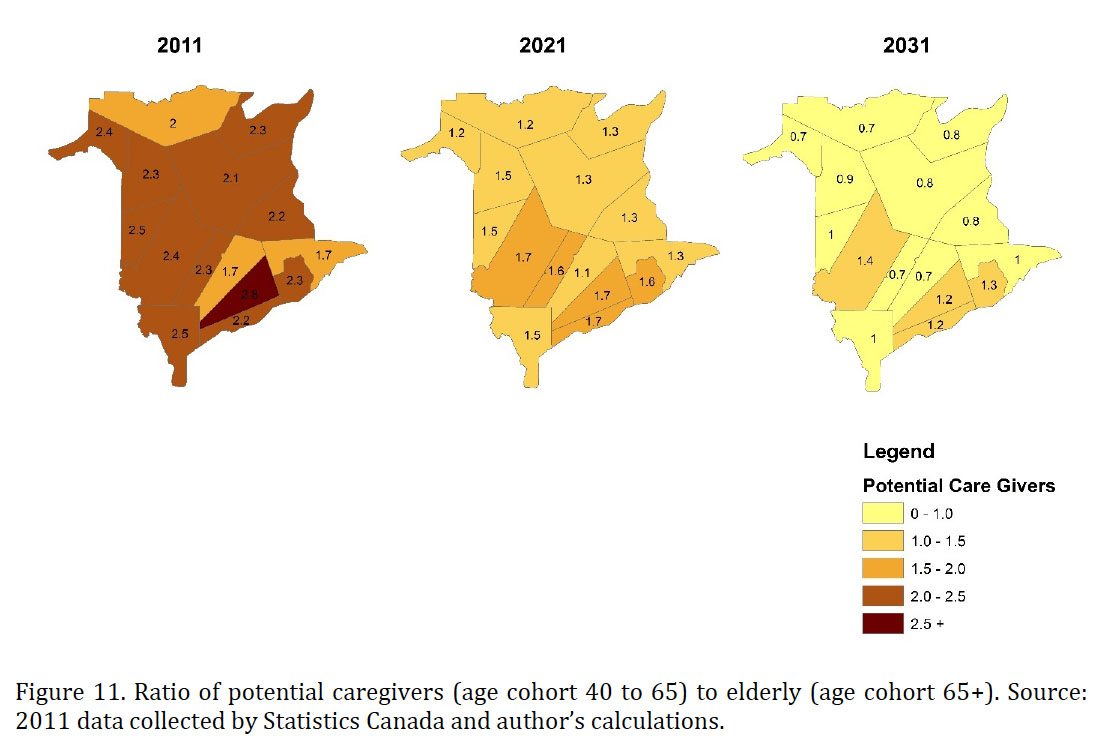 Display large image of Figure 11
Institutional Care and the Dementia Crisis
18 At the early stages of dementia, care in the home is feasibly provided by family members or by professional caregivers. At later stages of the disease, however, home care must be provided around the clock and this can be prohibitively expensive. Also, family members often find that they can no longer cope as the demand for care increases. Consequently, most people suffering from dementia are eventually institutionalized. New Brunswick has an integrated system designed to deal with individuals no longer able to function in their own home. A person needing care is assessed to determine the level of upkeep required. Special care homes are an option for someone needing low to moderate levels of care. The official categories for these low to moderate levels are, respectively, Level 1 and Level 2 care, as defined in the 2009 official document entitled Being There for Seniors: Our Progress on Long-Term Care (15). Level 1 clients are generally mobile but require the availability of supervision on a twenty- four-hour basis as related to their personal needs. They do not need full-time nursing care. Level 2 clients may require some help or supervision with mobility. They need more individualized help with personal care and their daily activities. They do not need full-time nursing care.
19 Special care homes are privately owned and operated but they are licensed and inspected by the government. Residents can qualify for government subsidization if they meet the criteria established in the need and means tests. The special care homes vary dramatically in size and services offered. Some even provide independent living as well as room and board services to clients who do not need advanced care. The government recognizes that special care homes can potentially play an important role in the care of dementia patients. Indeed, the government has supported the creation of enhanced special care home beds that can accommodate clients with dementia. Dementia cases are typically assessed as Level 3B, given that the client needs relatively intensive supervision twenty-four hours a day, seven days a week, but not full-time nursing care. Prior to 2007, a dementia patient would be streamed into a nursing home. Now, with enhanced beds available, some patients can take up residence in a special care home.
20 Nursing homes are the conventional option for individuals in the advanced stages of dementia, given the level of care and supervision required. Unlike special care homes, however, nursing homes are owned by non-profit organizations and offer residents medical care. Table 6 presents data on nursing homes in New Brunswick. Nursing homes are much larger, on average, than special care homes. They are relatively evenly distributed across the province. The final column of the table presents a crude estimate of additional nursing home beds needed by 2031, assuming beds per hundred residents remain at the current levels. Nonetheless, this estimate is likely to be low, as there are currently long wait-lists for nursing home beds. Because wait-lists are extensive, those who need close monitoring often occupy expensive hospital beds instead.
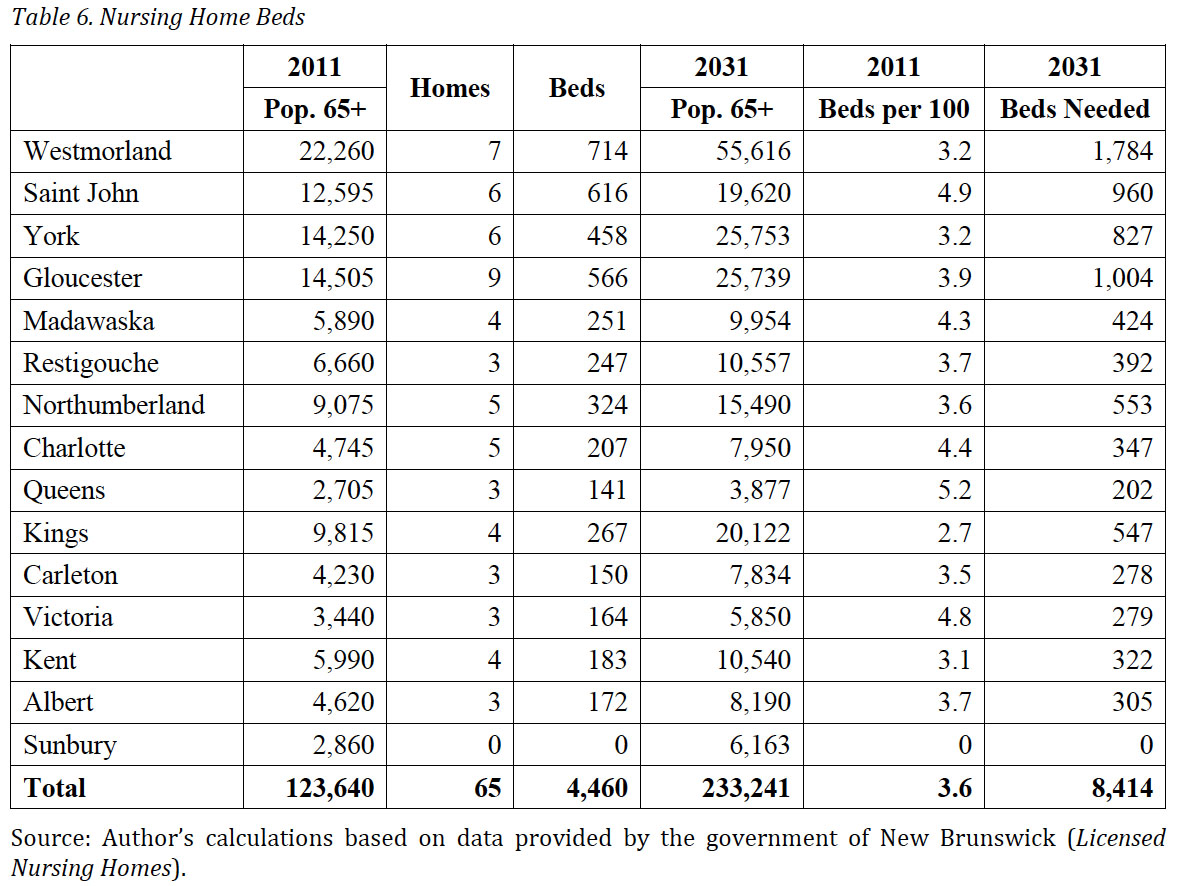 Display large image of Table 6
21 Special care home beds, on the other hand, are less evenly distributed across the province. Table 7 presents data concerning the distribution of special care beds in the province by county.
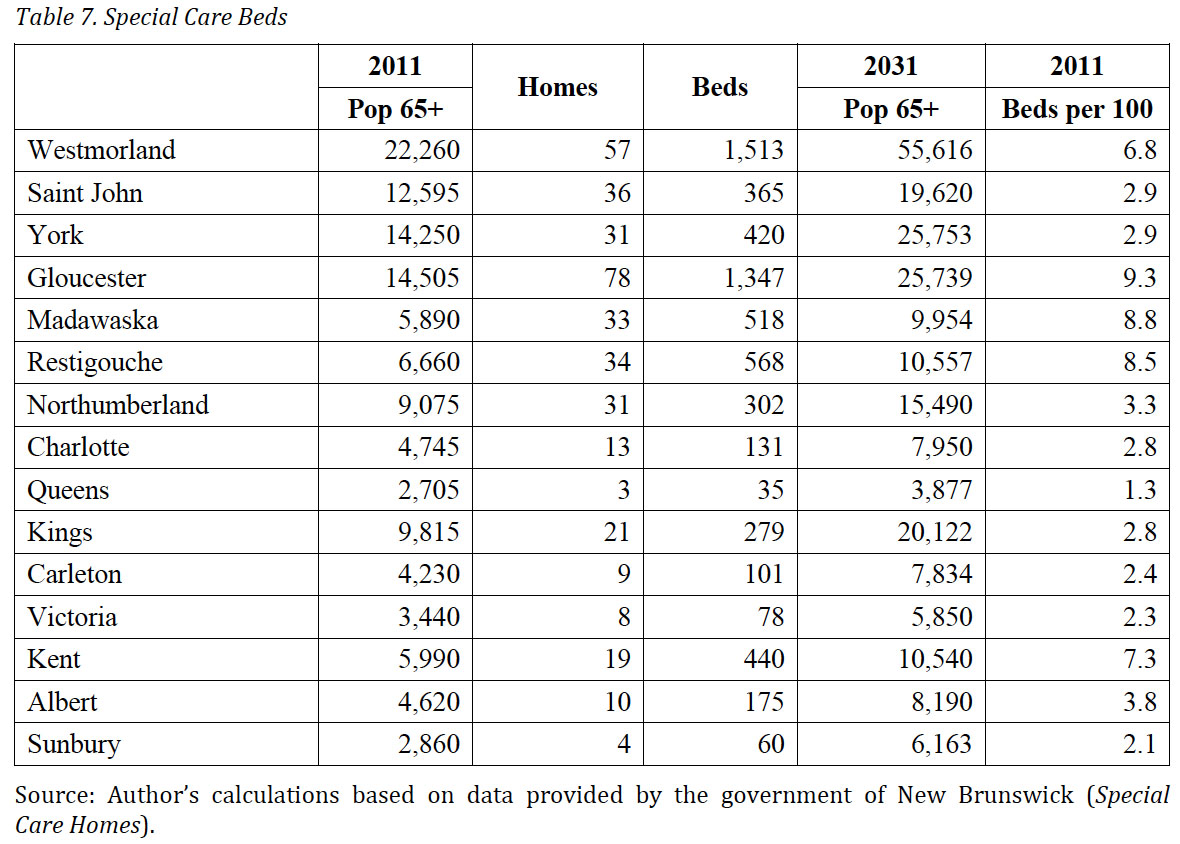 Display large image of Table 7
22 Special care homes may play a larger role in dementia care in the future. Special care homes are for-profit, and the ability to pay, as well as the cost per bed, will play a major role in bed creation. Indeed, if demand increases and the price of a bed exceeds the cost, one would expect entrepreneurs to create the needed spaces. No government plan would be necessary because beds would be created where they are needed. The entrepreneurs would have the incentive to contain cost growth and the government would only need to regulate and choose appropriate levels of subsidization.
23 If the market worked according to rational economic principles, then big differences in the supply of beds per hundred seniors across counties could be explained by the following reasons: first, profitability differs across regions due to the costs of construction, labour, and land, among other factors; second, volunteer and professional home care services are substitutes for special care home beds and, if available, they reduce demand for them; third, nursing homes are substitutes for special care beds; and, fourth, demand correlates with differences in income. Upon closer inspection, none of these rational economic explanations seem to work well.
24 Figure 12 plots the average income in the province by county in 2005 against special care beds per hundred seniors. There is not much of a relationship, although a poorly fitting least squares regression line suggests a negative relationship in which higher income is associated with a lower number of beds per hundred seniors. Figure 12 also includes data on language. (The size of the circles indicates the proportion of the population who speak French at home.) The census divisions with the large circles are typically above or close to the line indicating that francophone areas have more beds per hundred seniors than would be predicted by income alone. The small circles (predominantly anglophone) are almost all below the line indicating that anglophone areas have fewer beds per hundred seniors than would be predicted by income alone. Figure 13 presents the same data by directly highlighting the relationship between language and beds per hundred seniors. Language evidently makes a big difference to the number of beds available in the community, but it is unclear why this should be the case. This question will be an important topic for future research.
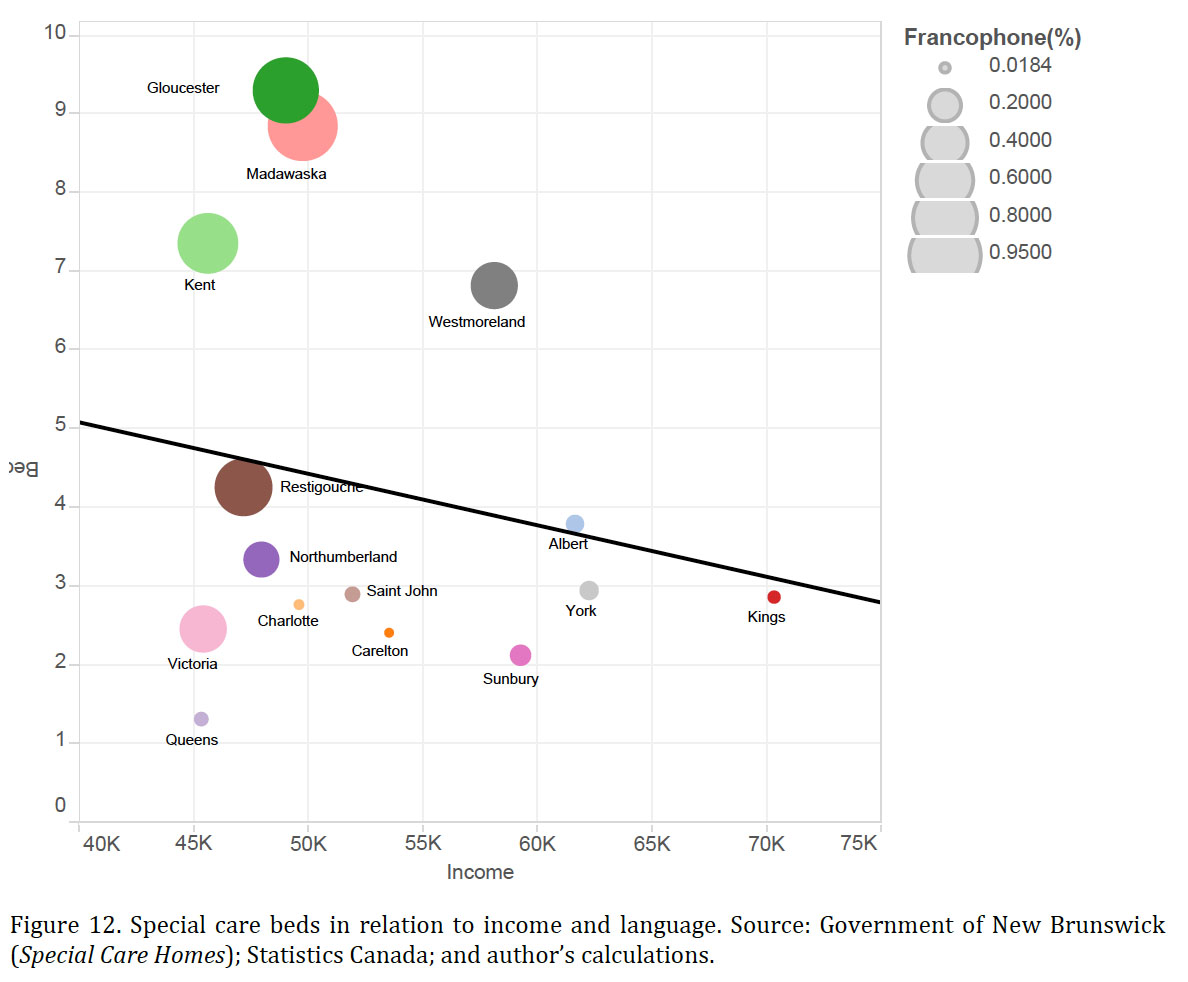 Display large image of Figure 12
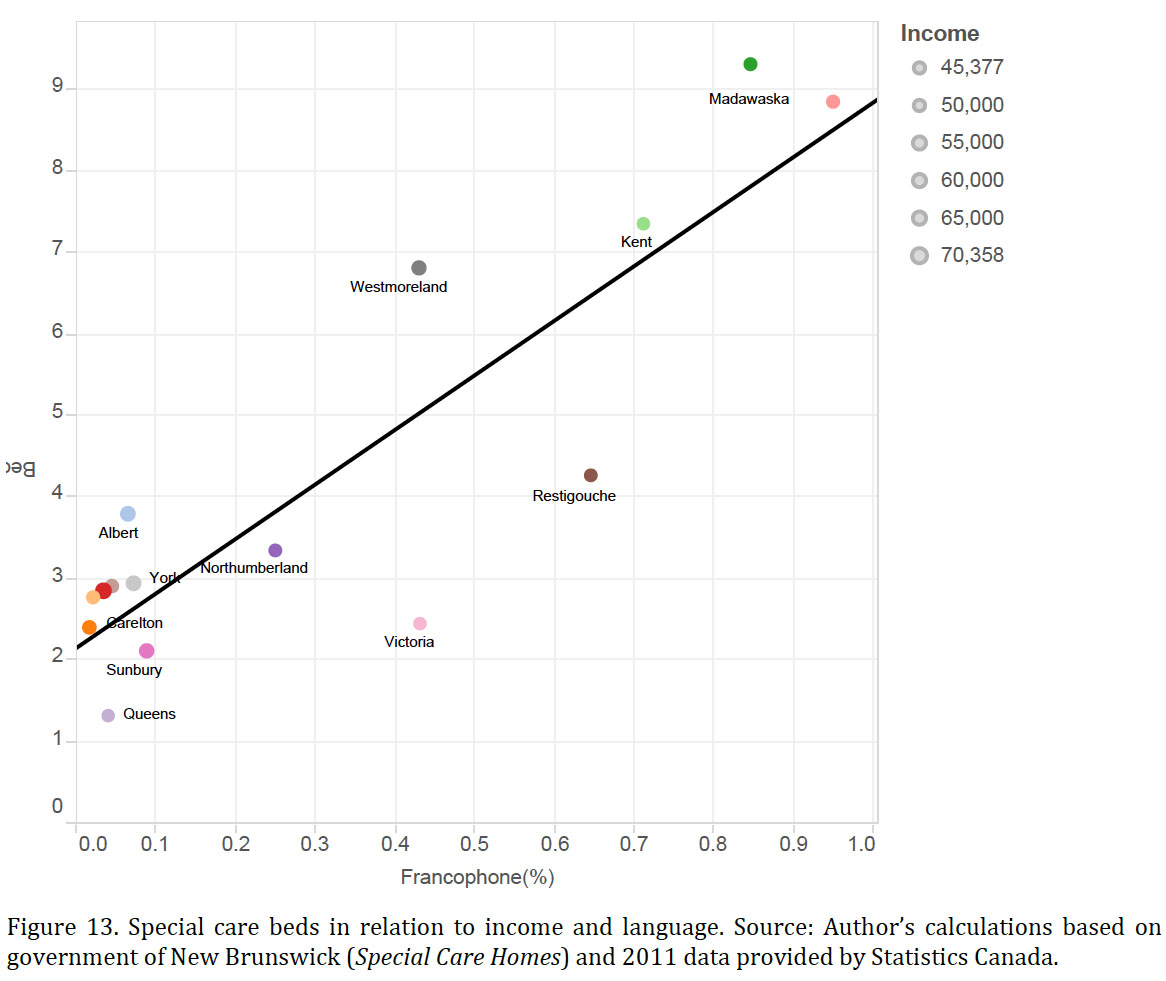 Display large image of Figure 13
25 Figure 14 plots data for nursing home beds per hundred elderly and according to language. In contrast to the case of special care home beds, there is no obvious relationship between nursing home beds and language. For some unknown reason, language seems to matter in the for-profit special care home sector but not in the nursing home sector.
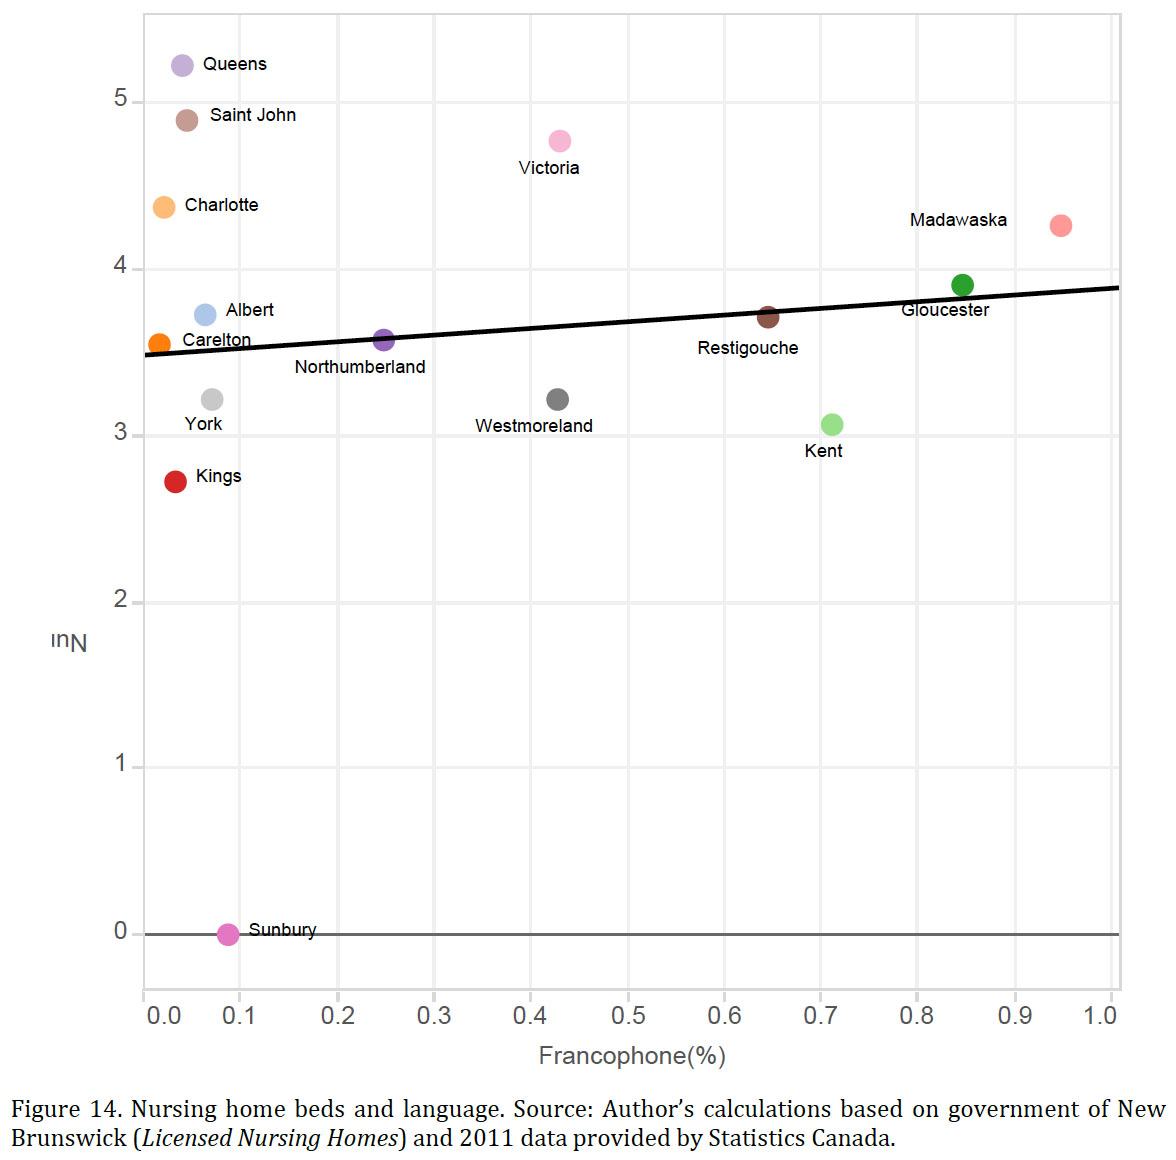 Display large image of Figure 14
26 Figures 15 and 16 look at the two substitutes for special care beds—nursing home beds and the population available to deliver home care—to see if they might explain the distribution of special care home beds across counties. One would expect that if special care beds and nursing home beds are substitutes, then more nursing home beds per hundred seniors would result in fewer special care home beds. As shown in Figure 15, there is no relationship evident in the data. Similarly, one would expect a lower demand for special care beds in regions where potential caregivers (defined as the population aged forty to sixty-five per elderly [65+] person) are relatively plentiful. Again, there is no evidence for this conclusion in the data presented in Figure 16.
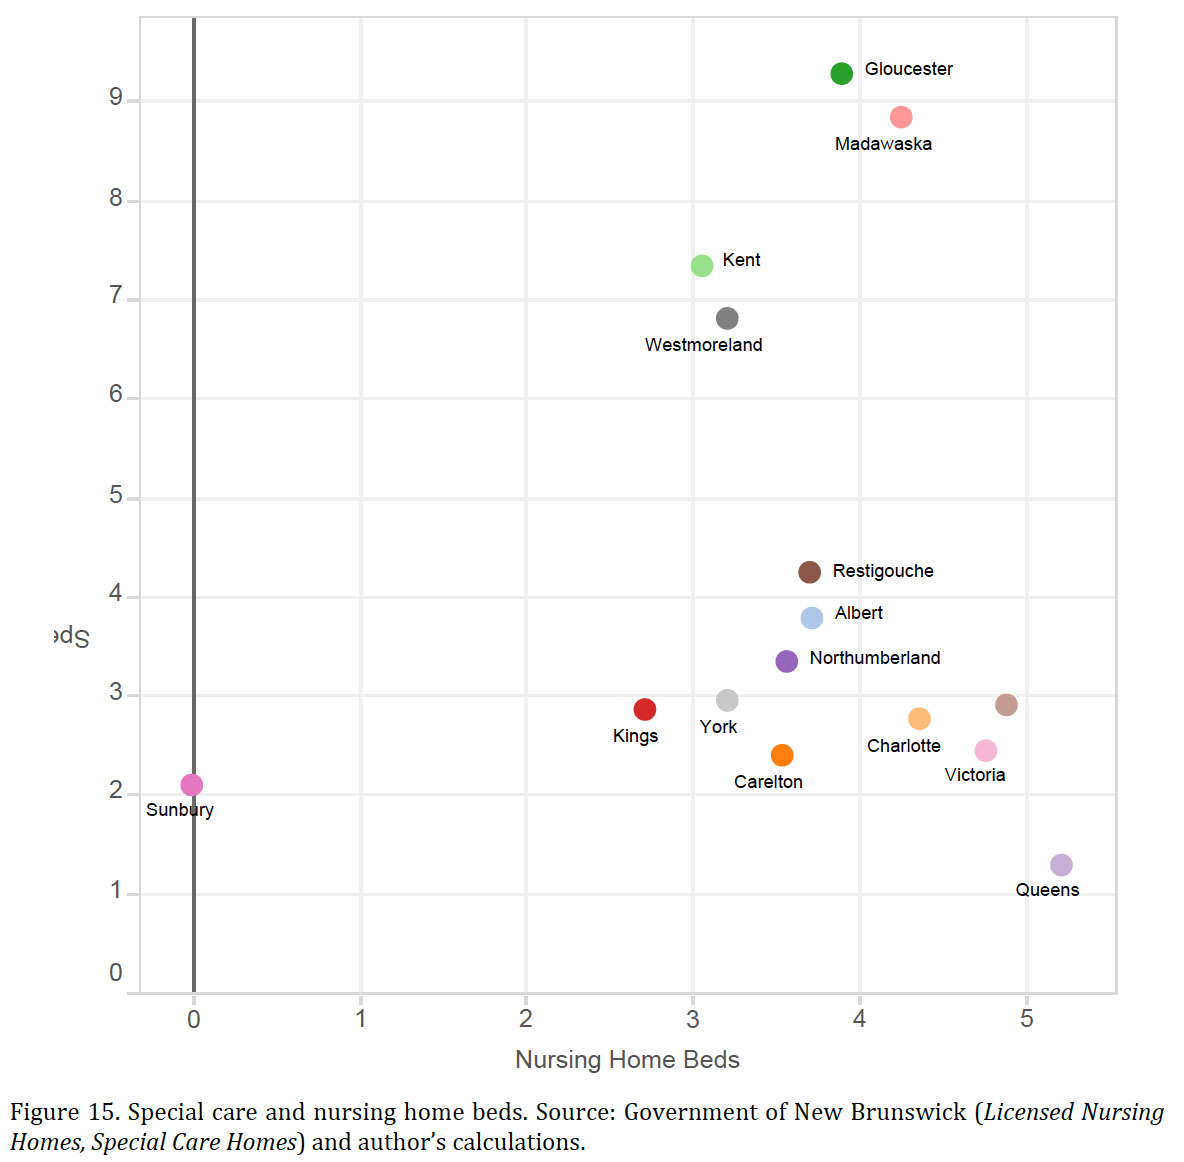 Display large image of Figure 15
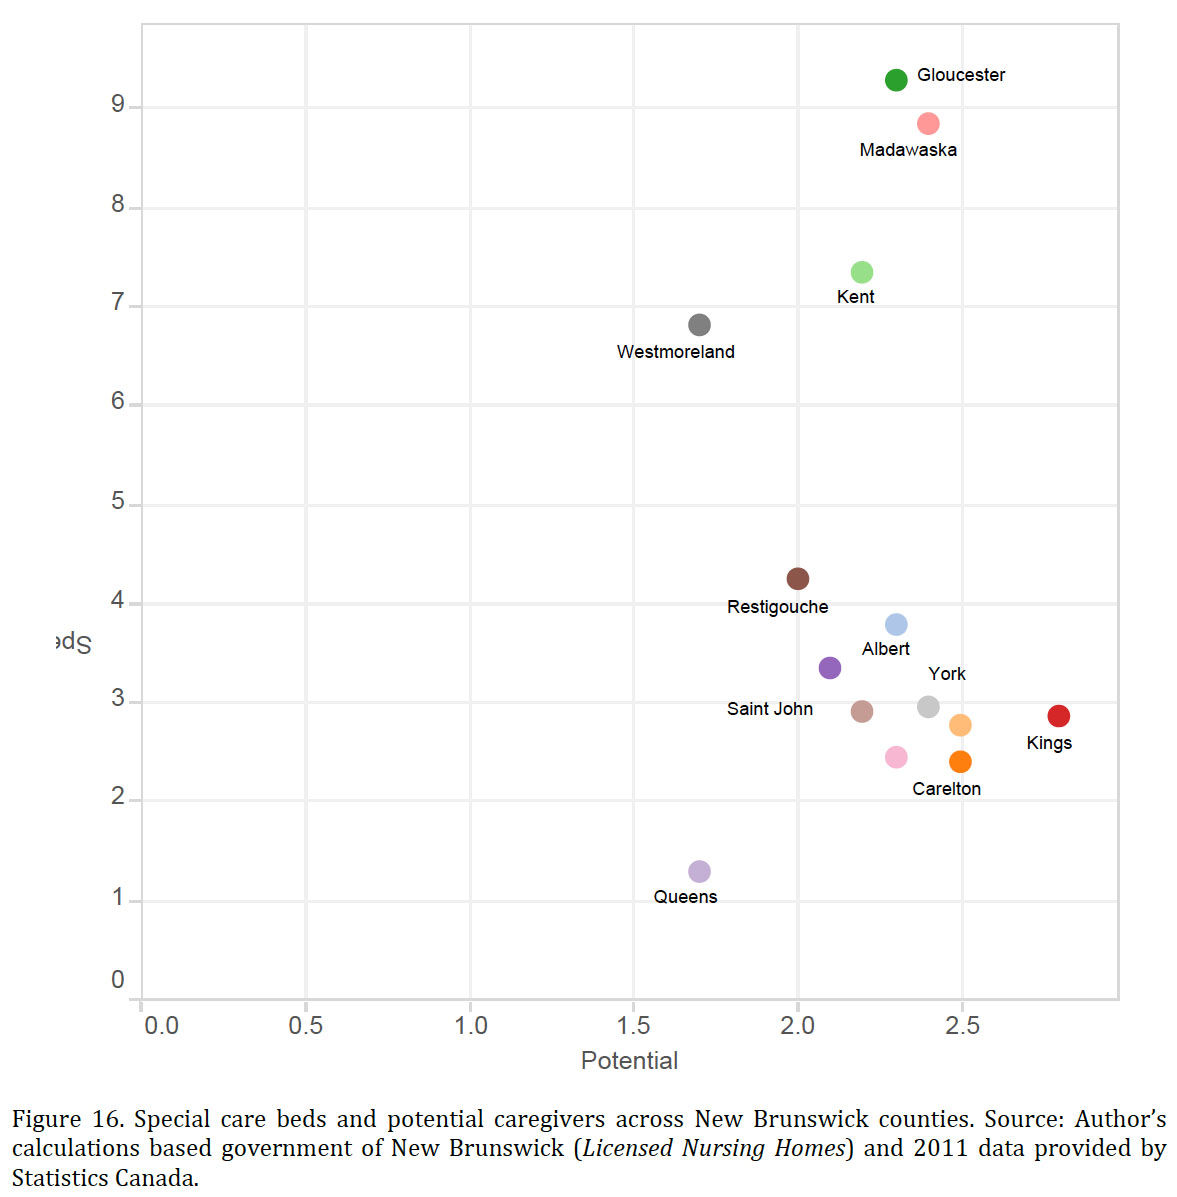 Display large image of Figure 16
Conclusions
27 This study examined challenges posed by the rising tide of dementia cases in New Brunswick expected over the next twenty years. The evidence presented indicates the importance of geographic and demographic factors when thinking about the issue. In particular, this study used the metaphor of a population tornado to argue that in many but not all parts of the province, early diagnosis and in-home care will become increasingly difficult to obtain. Because early diagnosis and in-home care are two critical strategies for coping with the crisis in a cost-effective way, the dementia challenge in New Brunswick is more significant than suggested by studies that are based on national aggregates.
28 This study has also noted that special care homes might play an important role in coping with the dementia challenge. Indeed, because special care homes are for-profit businesses, it is possible that the market might effectively fill the gaps in care. However, economic variables do not explain the current distribution of special care home beds across the province, and there remain strong reasons to be skeptical about a market solution. Further research is needed to understand the process of bed creation in the for-profit special care home sector and to explain the variation across the province and between language communities.
Technical Appendix
Cost of Dementia and Time Spent on Informal Care
29 The estimates of cost and time spent providing informal care in New Brunswick were generated using the national estimates produced in Rising Tide: The Impact of Dementia on Canadian Society and Statistics Canada’s projections (scenario M1, CANSIM 052–0005). As the authors of the former study note, “The data in Rising Tide were determined through RiskAnalytica’s specialized Life at Risk® evaluation framework, combined with the Alzheimer Society’s extensive network of leading researchers and clinicians.”
30 The estimates for New Brunswick were generated in three steps. First, the national estimates of dementia cases (n), cost (C), and hours of informal care (H) for 2010 and 2036 reported in Rising Tide were combined to produce the cost-per-case (C/n) and the informal care-per-case (H/n). Second, the 2010 and 2036 data on cost-per-case and hours-per-case were used to interpolate annual data for the 2010–36 period. The interpolated series is based on the assumption that both costs- and hours-per-case grow at a constant annual rate. Third, it was assumed that the costs-per-case and hours-per-case estimated in Rising Tide are reasonable estimates of cost-per-case and hours-per-case in New Brunswick, and, furthermore, that total costs and total hours in New Brunswick could be approximated by (C/n)*N and (H/n)*N, respectively, where N is the number of cases of dementia in New Brunswick estimated in this article.
31 The model used to develop cost forecasts in Rising Tide results in a growth rate in cost of 5.9% per year, which exceeds the rate of growth that one would reasonably expect for the Canadian economy. Because the Bank of Canada is committed to a 2% inflation target and historically real GDP growth has generally fallen to the 2% to 3% range, one would expect a 4% to 5% nominal GDP growth.
Population Estimates
32 The size of the cohort evolves as Pi,t+1 = Pi,t+NMi,t−Di,t , where Pi,t+1 is the number of people in cohort i in the next census year, Pi,t is the number of people in cohort i in the previous census year, NMi,t is the number of net migrants (which can be positive or negative) into or out of the i cohort between the two census years, and Di,t is the number of people in cohort i who died between the two census years. Data are available for Pi,t+1 and Pi,t for the 2001, 2006, and 2011 census years, and it is possible to calculate a rate of change between census years for each cohort in each jurisdiction as follows: (Pi,t+1 − Pi,t)/ Pi,t= (NMi,t − Di,t )/ Pi,t. = βi,t+1.
33 The calculated βs play a critical role in the population forecasts. To illustrate how the βs are used, consider the following concrete example: suppose the population between 15 and 19 in 2001 is 1,000 and the population between 20 and 24 is 1,000. Five years later, we find that the population between 20 and 24 is 800 and the population between 25 and 29 is 900. The calculated β for the 15 to 19 cohort is (800–1,000)/1,000 = −0.2 and the β for 20 to 24 cohort is −0.1. Now, suppose that the 2011 Census finds that the population between 25 and 29 is 750; the calculated β is (750–800)/800 = −0.0625. Notice that the population 25 to 29 in 2011 is the cohort that was aged 15 to 19 in 2001. The population forecasts use the βs from two cohorts to estimate an age group β j*. The age group βj* is the average of the two cohort βs. In our example, the βj* for the 20 to 24 age group is the average of −0.1 and −0.0625, or −0.08125. Our forecasts for future periods assume that the age group β*s remains constant throughout the forecast period.
34 One problem with this simple technique is that it does not account for increases in life expectancy. Consequently, one would expect the simple model to underestimate the population in each of the cohorts in the over-sixty-five age group. To account for life expectancy, the population estimates for cohorts sixty-five and older are adjusted to make the provincial forecast from the simple model equal to the forecast produced by Statistics Canada using scenario M1. The missing seniors are then allocated to census divisions and subdivisions using 2011 population shares.