Articles
Uneven Renaissance:
Urban Development in Saint John, 1955-1976
Abstract
This article discusses urban development in Saint John from the mid 1950s to the mid 1970s. Saint John is a mid-sized port city subject to boom-bust economic cycles. In the post-World War II era, business and political leaders promoted an urban renaissance to modernize the city and make it more attractive for investment. Four interrelated policy areas of that renaissance are discussed in this article: urban renewal, transportation infrastructure development, industry and business promotion, and housing. Largely because of amalgamation in 1967, the city’s population peaked in the early 1970s and then began to shift to suburban municipalities. Urban renewal, bridge construction, and highway construction displaced up to 5,000 residents, largely working-class tenants, a minority of whom ended up in public housing. Towards the end of the period, more attention was paid to the social costs of development, but Saint John’s urban renaissance stressed infrastructure and industry over neighbourhoods.
Résumé
L’article étudie le développement urbain à Saint John du milieu des années 1950 jusqu’au milieu des années 1970. Saint John est une ville portuaire moyenne sujette à des cycles d'expansion et de ralentissement économiques. Après la Seconde guerre mondiale, les personnalités du monde des affaires et les dirigeants politiques ont promu une renaissance urbaine afin de moderniser la ville et la rendre plus intéressante pour y faire des investissements. Dans cet article, quatre secteurs de dépenses interdépendants liés à cette renaissance sont abordés : la rénovation urbaine, le développement de l’infrastructure de transport, la promotion de l’industrie et des affaires et les logements. L’amalgamation adoptée en 1967 a fait que la population de la ville s’est accrue au début des années 1970, et a ensuite migré vers les municipalités de banlieue. La rénovation urbaine, le pont et la construction routière ont contribué au déménagement de jusqu’à 5 000 personnes qui étaient, en grande partie, des locataires de la classe ouvrière; une minorité d’entre eux se sont installés dans des logements sociaux. Vers la fin de cette période, davantage d’attention a été prêtée aux coûts sociaux du développement, mais la renaissance urbaine de Saint John a exploité l’infrastructure et l’industrie avant les voisinages.
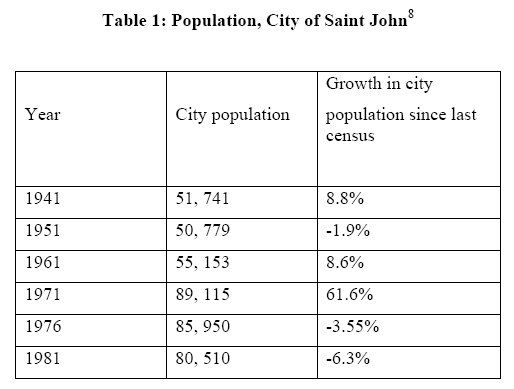
1 Recent social and economic indicators in the City of Saint John, as opposed to the Saint John Census Metropolitan Area (CMA), are worrisome. The population, which peaked in 1971, fell to less than 70,000 by 2001. With the closure of the local shipyard and the sugar refinery, manufacturing jobs continue to decline. The port, once a mainstay, employs only a fraction of the workforce of the 1970s. 1 Retailing has shifted to the eastern fringes of the city; recently, the last supermarket in the central core closed. Almost one family in four in 2001 was headed by a single parent, and more than a quarter of the population lived below the poverty line. In 2001 nearly half the population lived in rented dwellings, higher than the national urban average and substantially above the provincial average. Areas of the South and North Ends of the city show the classic signs of urban decline. 2 The assessed value of downtown property fell by 11% between 1990 and 2000. In spite of all of these signs of decline, business leaders and development agencies, as they have since the 1960s, speak confidentially of the Saint John region’s economic future. 3
2 This paper reviews urban development in Saint John from the mid 1950s to the mid 1970s. 4 During this period, in response to a boom-bust economy and a deteriorating physical environment, the municipality, aided by senior levels of government, invested heavily in slum clearance, public and private housing development, transportation, infrastructure and industrial expansion. The region also benefited from the province’s Equal Opportunity Program of municipal restructuring, and federal regional and industrial development policies. The basic question is: who benefited from Saint John’s attempted “urban renaissance”? For the purposes of this paper, development includes private-sector initiatives such as industrial expansion and residential and commercial property development as well as large public projects such as urban renewal, highway construction, and other infrastructure projects.
Saving the Post-Second World War City
3 The most visible public policy issue affecting Canada’s cities in the second half of the 20 th century was urban renewal. Originally conceived as federally-assisted slum clearance under the 1956 National Housing Act, urban renewal was a cost-shared program that permitted land to be developed for commercial purposes. According to Bacher, although Canadian urban renewal projects did provide some public housing, their chief beneficiaries were “local commercial and real estate elites.” 5 The literature on municipal governance stresses that urban renewal was not simply the result of government initiatives but of growth coalitions. These included downtown business interests (retail, banks, real estate, developers); municipal, state/provincial and federal politicians; bureaucrats; the media (particularly mass-circulation daily newspapers); utility/transportation companies; workers and unions, self-employed professionals; and universities. 6 Growth coalitions have not always agreed on the details of urban renewal; like their critics, they have been divided. Yet during the urban renewal era (c. 1950-79) they operated on the premise that the removal of blighted housing and the enhancement of the downtown core would benefit the entire city. The characteristics of the classic urban renewal period included top-down planning, growing civic budgets, the loss of population to suburbs, the use of exclusionary zoning, the clearance of slums, and public housing investment and architectural modernism in the central business district (CBD). The chief tactic of growth coalitions was to compete for federal government funding and private investment. 7
4 Historical interpretations which stress the role of the private sector in urban policy formulation focus on how commercial interests such as real estate lobbies utilized urban renewal programs to efficiently assemble land (either working-class housing or older industrial and transportation zones) for investment and economic development. Municipalities benefited from higher tax revenues, while non-business groups such as organized labour, ethnic/racial minorities, or liberal reformers supported renewal because of social amenities such as public housing, new schools, parks, and playgrounds. Real estate lobbies opposed slum rehabilitation and social housing in principle but in practice accepted limited efforts as part of the price of political support. 9
5 American urban studies literature stresses several negative effects of 1950s-70s renewal. First, modernist redevelopment replaced historic buildings with utilitarian, uniform structures of concrete and steel. Second, slum clearance resulted in a net loss of affordable housing. Third, the eradication of “blighted” areas dismantled entire neighbourhoods or communities, often with inadequate compensation. Fourth, individuals and families displaced by renewal often faced higher housing costs. 10 Fifth, as the displaced were pushed out, adjacent neighbourhoods deteriorated. Sixth, urban renewal, with the destruction of tenement zones and small businesses, and the construction of large public housing projects, enhanced racial segregation. 11 Seventh, renewal meant a loss of shopping and wholesaling in the central city, as small businesses and jobs relocated to outlying retail and service strips, malls, and industrial-commercial parks near highways and increased fragmentation of the community. Critics from Jane Jacobs (1961) onwards have been critical of the motive and outcomes of post-Second World War North American urban redevelopment. 12
6 Where does Saint John fit into these issues? The literature on Canada’s post-1945 urban policies is less judgmental, in part because of the relative absence of the “race issue,” at least on the scale of the American situation. In contrast to large American industrial centres, Canadian cities have been affected by a strong welfare state, federal and provincial government spending, different attitudes towards law and order, the incremental nature of urban change, and the relative “livability” of most downtown cores. 13 Another important point is that Saint John was a mid-sized city, by North American standards, in the 1960s and 1970s. We know less about urban issues in small- and medium-sized cities than in centres such as Montreal, Toronto, and Vancouver, and less about cities in economically disadvantaged regions than in central and western Canada. 14 Finally, there is little academic literature on urban issues in twentieth-century Saint John.
Urban Issues in Saint John
7 In the post-war Saint John area, four interrelated issues dominated urban development: slum clearance, transportation infrastructure, industrial-business development, and housing. Greater Saint John contained three municipal governments: Saint John, the neighbouring city of Lancaster, and Saint John County. In addition, the largely rural parish of Simonds (15,000 residents in 1961) contained an urban population and heavy industries. The population of the greater Saint John area was largely white, native-born, and Anglo-Celtic, although it also contained small Acadian, African-Canadian, and Jewish-Canadian minorities. A royal commission in 1963 recommended the amalgamation of Saint John, Simonds parish, and Lancaster in order to equalize taxation and services and promote orderly growth. 15 The county council (dominated by the mayor and aldermen of Saint John) was an important entity, administering a large social welfare budget and owning and operating the Saint John airport. The city of Saint John by virtue of provincial legislation provided water and sewage services, for a fee, to its neighbours. In 1967, Saint John absorbed much of Simonds parish, Lancaster, and Lancaster parish, creating a municipality of 103 square miles. With a population of 89,000, Saint John was the second-largest city in Atlantic Canada. 16
8 In addition to the municipal governments, the main players in the politics of development were the Board of Trade, the Port and Industrial Development Commission, the metropolitan Town Planning Commission (in charge of zoning), the Urban Renewal Commission, the trade unions, and the provincial and federal governments and their agencies such as the Atlantic Development Board and the Central Mortgage and Housing Corporation (CMHC). 17 As will be explained below, the CMHC would be considerably active in Saint John. At the community leve,l neighbourhood improvement associations that usually sought tax reductions, exclusionary zoning, or additional services were active. 18 The Board of Trade, which considered itself the city’s economic steward, was the area’s most influential nongovernmental organization. Both the Board and organized labour supported municipal amalgamation and the politics of development, as did road and building contractors. 19 Added to the mix was the individualistic industrial tycoon K.C. Irving, whose investments by the 1960s were helping to maintain Saint John’s status as the Maritime region’s leading industrial centre. 20
9 Many issues of urban governance were affected by the 1965 announcement that New Brunswick’s Liberal government would implement most of the Bryne report. Bryne had called for the abolition of county councils and the assumption of provincial responsibility for property assessments and the delivery of education, justice, public health, and social welfare. In addition to property and business taxes, a higher sales tax would enable the provincial government to “equalize” services for have-not municipalities such as those in northern New Brunswick. 21 The Equal Opportunity Program (EOP) had major implications for the scale of municipal government. In 1966, for example, half of the city of Saint John’s $8.7 million budget covered schools. 22 In addition, under the EOP, the province supposedly would prohibit tax concessions to industry, in effect undermining a long tradition of municipal bonuses. Few big industries had located in the Saint John area without some type of taxation or water rate incentive. 23 Saint John was part of the “Six Cities” group that opposed the EOP; Irving, who controlled Saint John’s newspapers, led the business opposition to Robichaud’s “centralization” policies. 24 Municipalities would still be responsible for community planning and industrial promotion, although the Robichaud government (1960-70) embarked on a mega-project strategy of industrialization and energy development. 25 In keeping with the climate of the era, the provincial government also became involved in regional planning and public housing.
10 In terms of local industry, the principal forces were the Irving interests, which included a $50-million oil refinery (opened in 1960), a shipyard (purchased in 1959), a pulp mill, and a growing number of other businesses. The two former were located in Simonds parish. 26 Despite having a winter port dating from the 1890s, rail facilities operated by both Canadian National and Canadian Pacific, and a number of small- and medium-sized industrial enterprises, Saint John itself had attracted little in the way of new industry since the 1920s. 27 Much of the area’s heavy industry was a new phenomenon, located in adjoining communities. Prominent examples of older industries were the aging McAvity-Crane plant in Simonds and Simms Brush factory in Lancaster. The sugar refinery on the city’s southern peninsula at one point had 1,200 workers. Newer operations included the $33 million Rothesay Paper Corporation and the $4 million Oland’s Brewery plants that opened in 1965. 28 Power for industry was provided by the New Brunswick Electric Power Commission’s new thermal plant in Simonds parish on Courtenay Bay. Industrial expansion and growth of the service sector was reflected in an 8.5% increase in population in the CMA between 1961 and 1971 (with 6.0% accruing in the 1960-66 period). 29 This took place in a decade when the province lost 60,000 people to outmigration. 30
11 During the 1960s, many traditional family-owned retail and service businesses continued to thrive in the somewhat shabby-looking central business district (CBD) anchored on King Street. Legal, financial, and insurance services and the wholesale trade also were significant employers. The downtown benefited from the expansion of private sector employers such as the New Brunswick Telephone Company. A growing service sector was reflected in the female labour force participation rate, which reached 31.9% by 1961. 31 Modernity reached the downtown in 1965 with the construction of a 14-storey office tower near the waterfront, which otherwise exhibited a drab appearance. 32 Public sector employment, notably in health care and education, also was important, although the city, neither a provincial capital nor a regional headquarters for federal departments and agencies, was relatively neglected. The city failed to dominate New Brunswick as Halifax dominated Nova Scotia because government services and higher education were clustered in Fredericton, and wholesaling and distribution was relocating to Moncton. 33
12 At the same time, the CBD, which had developed in the era of pedestrian traffic, department stores, and streetcars, was being challenged in the retail field by the area’s first malls, Fairview Plaza in the North End and a new K-Mart department store in Lancaster, where customers parked for free. Saint John’s first enclosed mall was planned for Simonds parish for the late 1960s. Downtown retailers, many of them locally owned, fought back. In 1964, the mayor bragged that Saint John had added several hundred parking spaces in the CBD. In addition to retail malls, a familiar North American style commercial ‘strip’ dotted by car dealerships, motels, restaurants, and service businesses was developing along the main highway to the east of the city. 34
Slum Clearance
13 Saint John’s first “master plan,” the Merrett report of 1946, had identified the city’s aging, polluted, and crowded built environment as a serious issue. Press exposés dating back to the 1920s and 1930s had already established the city’s reputation for poverty and a lack of decent, affordable housing. Saint John needed new housing both for existing residents and for the expected post-war population growth. Slum clearance was an established idea by the 1950s, but other than demolition of small numbers of dilapidated or abandoned dwellings, it had not been widely adopted in Saint John, where large numbers of tenants in the East and North Ends lived in former single-family homes converted into flats, many without central heating. The Merrett report also noted problems such as air pollution, untreated sewage piped into the harbour, and the proximity of working-class housing to the noise, dust, and pollution of railroads and industry. The federal government was not supporting slum clearance at this time because of a severe housing crisis following the Second World War. 35
14 Throughout the 1950s, support grew within the municipal government, the media, and the business community for cost-shared urban renewal. Facilitated by an amended National Housing Act ( NHA), renewal was primarily a strategy for revitalizing CBDs or adjacent neighbourhoods. The three obstacles were land assembly, land costs, and the rehousing of working-class populations. 36 The 1956-57 Potvin report, highlighting a number of issues relating to urban blight, became the basic document of the classic period of Saint John’s urban renewal. The report, echoing a 1944 study, cited a lack of new housing in the central core and the deterioration and overcrowding of existing buildings, many of them owned by slum landlords. Potvin recommended that one third of the city’s housing be destroyed and a further third repaired. Only 1,000 dwelling units were classified as “good.” Slum housing concentrated low-income families with high birth rates, which exacerbated social problems such as illegitimacy and juvenile delinquency. The health of the poor, furthermore, was affected by railways, industrial sites, poor drainage, and backyard dumps. Poorly built and maintained tenements, Potvin argued, also lowered property values and municipal assessments. 38
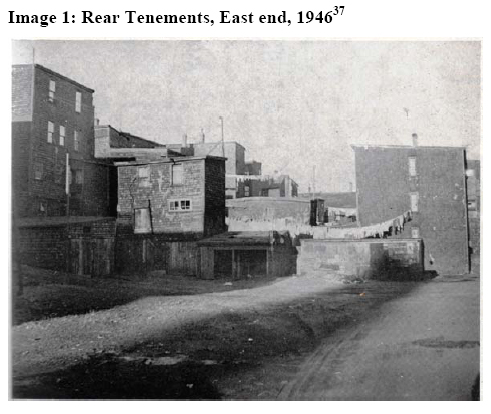
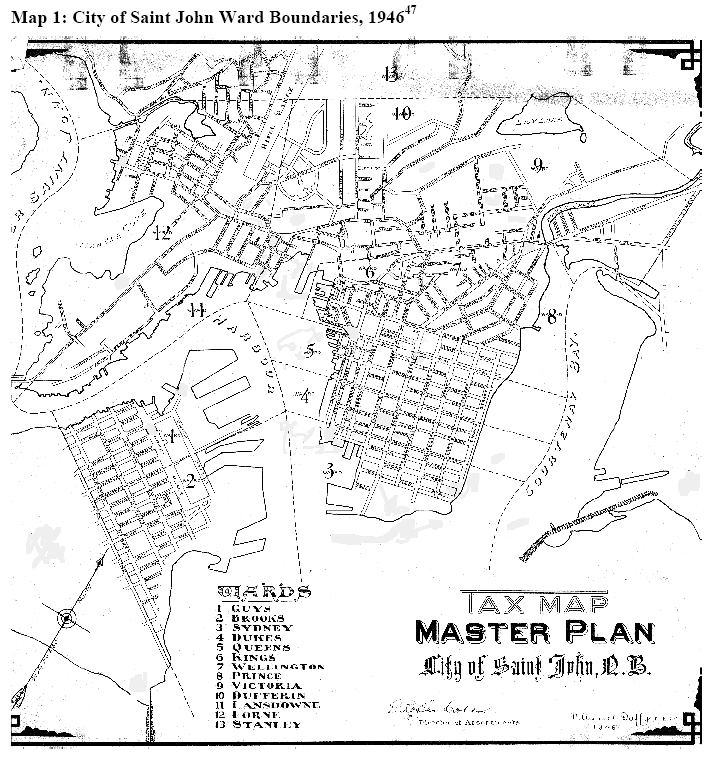
15 All of the above arguments were used to justify the partial destruction of the East End, a working-class community of tenements and run down commercial and industrial buildings between Waterloo Street and Courtney Bay. The so-called St. Patrick Street area had been given priority in the Potvin report, which classified less than 2% of the dwellings as “good.” More than 80% of the families were tenants. The Board of Trade viewed renewal tied to federal dollars as “a wonderful opportunity to modernize areas of the city.” 39 Even critics of urban renewal agreed that conditions in many parts of the East End were intolerable. Because of blight and an irregular street pattern, it was decided to remove 300 buildings and 600 families from the 57-acre site, which was situated in Prince ward (see Map 1). The cost of land expropriation and slum clearance was shared unevenly among the three levels of government. 40 The federal government covered 50% of land assembly costs and 75% of relocation housing costs. The total cost for the project was $4.5 million. 41 According to the city’s redevelopment officer, most of the money paid to acquire the land was reinvested locally. Changes to the National Housing Act later permitted the municipality to access federal funds for the installation of municipal services such as paving, sidewalks, sewers, water, electricity, and lighting. 42
16 The second renewal area consisted of central portions of the North End that included working-class tenements, small businesses, and the city’s 1930s-era railroad station, as well as a smaller zone on the western side of the harbour. 43 A former resident interviewed in 2008 described the North End as a thriving neighbourhood that contained both “respectable working people” and poorer residents who lived in slum conditions. 44 The North End community improvement area designated in 1963 was larger than the Courtenay development; as a project it also continued beyond the time frame of most CMHC ventures. Its geographic area, which included Market Slip at the foot of King Street, was also extended into the CBD in the early 1980s. Part of the land expropriated in these areas would be used for expressway development. Because these neighbourhoods (particularly the smaller West Side zone) were not as blighted as the East End, the level of destruction planned for 1967-74 would be relatively less dramatic. Yet much of the population of Lansdowne and Dufferin wards would be affected by Saint John’s second major urban renewal project. 45
17 The overall project area, comprising more than 350 acres, was mixed in terms of land use. By the mid 1960s, considerable territory had been acquired by a bridge-expressway project (see below), and buildings housing 150 families had been demolished. The North End-West Side scheme would affect few large employers, but it threatened marginal small businesses on the Main Street thoroughfare, whose chief customers were tenement dwellers in the streets north of the harbour. 46 In 1966, the project’s consultants divided the larger area into sub zones and recommended the “redevelopment” of five and the rehabilitation and conservation of four others. To varying degrees, the area was dominated by older, poorly-maintained multi-family rental units whose residents had lower levels of education and income than the city’s average. In typical “classic” urban renewal thinking, the consultants advocated a simple solution for poverty and low education levels of neighbourhood residents: destroy their housing and force more than 2,000 of them to relocate. Although the West Side zone was better off economically and supposedly exhibited a greater sense of community, the prognosis for large parts of the North End was not favourable, as the following excerpt from an urban renewal report suggested:
18 The federal government, in curbing the large-project approach to urban renewal in the late 1960s, had already admitted that it agreed with the critics. A federal review in 1969 acknowledged that earlier programs of slum clearance, expressway construction, and mass public housing destroyed viable neighbourhoods and isolated the poor—hardly social goals in the era of the “Just Society.” 49 Yet in Saint John, one urban renewal project was basically complete by this time, and the second was gaining momentum. Shared-cost projects, which had taken years to assemble, were not about to be stopped by intellectual arguments. By the time the various program dollars were spent, at least two neighbourhoods had been destroyed, dozens of small businesses relocated or closed, and thousands of residents forced out. One interviewee attributed the relative lack of opposition to the fact that most of the displaced were poor and working-class renters accustomed to being evicted, and that landlords stood to gain financially from urban renewal’s land assembly process. Former North End residents interviewed in 2008, although acknowledging the area’s housing and other problems, expressed regret at the loss of community. One described the “improved” urban renewal zone as a “wasteland.” 50
Transportation Infrastructure
19 Much of Saint John’s economic development in the post-Confederation period rested on its port, which in 1927 was placed under the National Harbours Board. Facilities on the West Side were rebuilt and expanded following a disastrous fire in the 1930s, and new berths were added following Second World War. Passenger traffic faded after the war. Although the tonnage of cargo exported increased during the 1960s, port businesses were concerned about competition from the St. Lawrence Seaway. Saint John had billed itself as Montreal’s winter port since the 1890s. 51 The Seaway opened in 1959; three years later, an icebreaking service enabled vessels to reach Montreal in winter. In the 1963-64 season, the port of Saint John exported 32 million bushels of Western grain; sugar was a leading bulk import. The importation of crude oil and sugar and the export of grain, refined petroleum products, and products such as packaged lumber was not as labour intensive as general cargo, and the number of longshore and related jobs began to decline. 52 The winter port, furthermore, was busy for less than half of each year. In a brief to the provincial government in 1964, a committee representing greater Saint John noted that the city’s traditional import-export role should shift to secondary industry and distribution. 53
20 Port modernization, which included fencing off and sprucing up the waterfront, continued and was largely financed by the federal and provincial governments. In 1964 the National Harbours Board opened a new terminal for perishable cargoes at Long Wharf. During the 1960s the port was shipping several million tons of cargo a year and rail facilities were expanded, further isolating the waterfront from the rest of the city. By the early 1960s, there were twenty-seven deep-sea berths, six coasting berths and sixteen transit sheds. The opening of the Rodney container terminal in the mid 1970s meant even less work for local longshoremen. But containers and general cargo handled through the publicly owned port were a fraction of overall harbour traffic, which came to be dominated by shipments of crude oil and petroleum products through separate Irving facilities in Courtenay Bay and at Mispec, a deep-water crude oil terminal located several miles up the Bay of Fundy. 54 Throughout the early 1950s and 1960s, the city government, the Board of Trade, and the Irving interests supported the Chignecto Canal, a proposed waterway to link the Bay of Fundy to the Gulf of St. Lawrence, offsetting Montreal’s competitive advantages. 55
21 Saint John’s major 1960s transportation project reflected the increasing prominence of the automobile: a harbour bridge and throughway designed to handle large volumes of traffic (90% of it local) at high speed. The increasing importance of cars and trucks to the local and regional economy was underscored by the decline of passenger rail service, symbolized in 1970 with the closing of the Union station, located near the harbour. Site of a possible commercial development, convention centre or sports stadium, the area, except for a small replacement station, remained vacant for almost two decades. 56 In the 1950s, an elevated viaduct had been built to carry automobile traffic over the nearby CPR marshalling yard. This was expanded in the late 1960s as part of expressway development. The result was to make the eastern half of Main Street a six-lane high-traffic expressway, which together with the throughway all but cut off pedestrian traffic between the North End and the CBD. 57
22 The bridge-expressway project, which required considerable land assembly for access ramps, tied in to urban renewal. As with other North American expressways, controversy developed, but it had little to do with the splitting of neighbourhoods or displacement of the poor. 58 The cost of the eastern section of the throughway, most of it to be built outside the pre-1967 city limits, would be shared by the province and the federal Atlantic Development Board. The Potvin report had recommended against an expressway, at least until the municipal government could raise the necessary financing to address the more immediate housing crisis. Despite this, a Harbour Bridge Authority incorporated in 1962 proposed a toll bridge across the Navy Island section of the harbour. The project was endorsed by the concerned municipalities, the Board of Trade, the Town Planning Commission, and the Port and Industrial Development Commission. Construction on the bridge piers and East Side approach began in 1965. The federal government’s contribution was not cash but a bond guarantee. 59
23 Saint John experienced no “freeway revolt” along the populist lines of Toronto, New York, New Orleans, or Milwaukee, but there was controversy. In late 1965, opposition from Lancaster and Simonds parish and various business interests brought construction to a temporary halt. A citizens “growth committee,” suspected of being a front for the Irving companies, protested the revised cost estimate of the bridge ($18 million) and argued that the route of the bridge and throughway would open up little new land for industry. 60 Furthermore, it would cut off areas of the city from the CBD, block industry from the waterfront and supposedly lower property values. Industrialist K.C. Irving, who also owned the two daily newspapers, a radio station, and a television station, favoured development to the north of the city, yet the growth committee spoke of the need to reserve territory near the harbour for industry. Irving, working with the county and Simonds Parish, had already begun to develop the Courtenay Bay area, east of Saint John’s harbour. 61 Irving also owned a steel fabrication plant, to supply his new refinery, on the northwestern shore of the harbour, which in many other municipalities would have been located in an industrial park, not near a residential area.
24 The growth committee’s counterproposal, an urban expressway and a bridge and arterial route crossing the Saint John river to the north of the harbour, through underdeveloped but largely residential Millidgeville, carried sufficient weight to invite federal government intervention. 62 Following a federal-provincial review and a number of design changes, work on the original project resumed in 1966. 63 The Harbour Bridge Authority successfully argued that the project was designed to smooth traffic flow, not open up land for development. Irving, having accepted that the bridge would be built, next argued that it could be completed for less than half the cost and that proposed tolls would hurt trucking businesses (notably his own). 64
25 The toll bridge opened in 1968; the outer sections of the throughway would not be completed until the 1970s. The $45 million highway project was financed by federal “growth centre” funds. 65 Although the construction of both the bridge and the highway would support a building boom during the first half of the 1970s, it served to isolate parts of the North End and damage its small businesses, and it facilitated the growth of a shopping mall zone in East Saint John. It also removed housing from an older but stable neighbourhood known as “the Valley.” A provincial government planning study of 1978 concluded that industrial development and modern traffic planning had left an unfortunate legacy: “Large unattractive and polluting industries flank the downtown area and the throughway has left an ugly scar across the city.” 66 The most unflattering landmark was the large Irving pulp mill near Reserving Falls rapids at the mouth of the Saint John River, a tourism destination. Despite the protests of a nascent environmental movement over air and water pollution, and industrial demands on the water supply, the city permitted an expansion of the mill in the early 1970s, and the province guaranteed a $10 million loan. 67
Industrial-Commercial Development
26 The business community’s chief interest was not in sprucing up Saint John’s slum areas, most of which were not located near the CBD, but promoting economic development, downtown enhancement, and real estate values. They also were desperate for industry. The Potvin report was more direct: “Saint John needs more industries,” ideally of the small-l and medium-size variety. 68 During the 1960s all three levels of government in New Brunswick were infatuated with secondary industry, and Saint John was designated a growth centre. In 1945, with more than 100 manufacturing enterprises, the city, in terms of gross value of product, was the most important industrial centre in the Maritimes. In 1958, including neighbouring Lancaster, Saint John still led the region in terms of the value of “factory shipments.” 69 Despite this, a disruptive railway strike in 1957 convinced the Atlantic Advocate that the city’s reliance on the port was short sighted; industrial investment, wages, and spin-offs would have to be increased. 70
27 Despite the relative importance of industry, employment growth had been slow in the sluggish period from 1945 to the early 1960s. The Board of Trade reported that more than half of the growth in employed workers for the period 1949-65 had taken place in the last year. 71 The message of the citizens’ “growth committee” was that the poor economic performance of the postwar era was attributable to a shortage of land for industry. 72 This type of thinking led to a simplistic belief that the provision of serviced land would attract new industries. In 1957, the old city of Saint John had less than 150 acres of industrial land. Potvin’s planning group, however, refused to endorse the rezoning of the South End for industry. 73
28 Saint John’s image as a “lunch bucket” town was not reflected in labour force statistics. In 1971, less than 12.0% of the workforce was in processing and manufacturing jobs, and much of the manufacturing (kraft paper, oil, sugar) did not produce finished goods. A further 11.8% were in construction and transportation, sectors that supported industry. In other words, the typical worker was an office, retail, or service clerk. 74 The percentage of the CMA’s workforce in manufacturing was only 16.3%; the national average was 19.8%. Although its manufacturing workforce was relatively smaller than in cities such as Montreal, Saint John, the “grey” port city, and New Brunswick’s major shopping and service centre, came to be viewed as an industrial town. 75
29 Most of the land cleared in the East End in the early 1960s went not for housing but non-industrial businesses. Courtenay Place, in contrast to Toronto’s Regent Park public housing project, ended up as a low-density and mixed land use area, dominated by a four-lane connector road that moved traffic in and out of the CBD. Although the development failed to retain an established local food processor, land was leased to a car dealership, a hotel, the plant of New Brunswick Publishing Limited (publisher of two Irving newspapers) and an office-warehouse complex. Eventually a building housing radio and television stations, both Irving-owned, would be constructed on the southeastern corner of the redevelopment area. 76 By 1969, the assessed value of the area was 600% higher than it had been a decade earlier. 77 The Potvin report had not been overly sanguine about commercial development at Courtenay Place, but its authors recognized that redevelopment in the core would be central to slowing down “ribbon spread,” the proliferation of businesses and jobs along busy roads leading out of the city. 78 The North End-West Side plan would make a belt of land near the east-west rail line available for light industry and commercial purposes. In 1970, the New Brunswick Housing Corporation reported that most of the Courtenay site had been redeveloped to produce “a balanced mix of family and senior housing, light industry, commercial and recreational facilities.” In the early 1970s a small, enclosed mall with underground parking opened on the southern perimeter of the area. Surrounded almost exclusively by low-income residents, it was doomed to a marginal existence. 79
30 Of larger importance was a deal reached in 1966 among the county, the Saint John Port and Industrial Development Commission, the provincial government, and the Atlantic Development Board to create the area’s first industrial park. Despite Irving’s wishes, there was limited land near the waterfront for industrial expansion; large areas were taken up by roads, railway marshalling yards, and rocky terrain. The industrial park site, between Grandview Avenue and the Old Black River Road in Simonds parish, would provide 100 acres of serviced land for business, complete with a railway spur line. Like Lancaster’s “Golden Mile,” it was easily reached by trucks. Two additional industrial parks would open in ensuing years. 80
31 Municipal amalgamation was not part of Premier Robichaud’s EOP, but the fragmented structure of greater Saint John was considered to be a barrier to industrial investment, let alone urban and regional planning. 81 The Board of Trade had supported amalgamation as a growth strategy since the 1950s. 82 Equal Opportunity made amalgamation more viable. On the other hand, Robichaud’s planned tax policies threatened firms such as Atlantic Sugar Refineries Ltd., New Brunswick Telephone, and Crane Canada Ltd., as well as Irving companies such as Irving Refining Ltd., Irving Pulp and Paper Ltd., and J.D. Irving Ltd. Starting in 1967, as mentioned above, Simonds and Lancaster, together with their industries, became part of Saint John. 83
32 Continued port development and “mega projects,” which perpetuated a boom-and-bust cycle for the construction industry, became the norm for Saint John by the late 1960s when it was selected as one of twenty two “growth centres” deserving federal funding for infrastructure and industrial promotion. By 1976, Ottawa had provided $78 million in grants to New Brunswick industry, $58.9 million in grants and loans, and $67 million in labour force training; much of the investment ended up in the Saint John region. 84 Major public works projects, notably the nearby Coleson Cove thermal power station and the Point Lepreau nuclear power plant, and the expansion in the early 1970s of the Irving refinery, employed large numbers of tradesmen and labourers. Irving’s $14 million “Canaport” deep-water oil terminal at Mispec Point east of Saint John, with a capacity for 90 million gallons, opened in 1970. Skilled workers had to be imported into the Saint John region with the result that by the early 1970s the vacancy rate for housing fell to less than 2%, and rents rose. 85
Housing
33 The problems of low-income housing in Saint John, a city of tenants, had been highlighted by the Potvin report, which had called for 4,000 new dwelling units. In 1961, less than half of the dwellings in the Saint John CMA had furnaces and nearly one in seven lacked toilets. 86 For the most part, politicians and planners preferred private housing solutions, principally low-density, single-family houses in subdivisions, or apartment buildings. Post-war consumer society was based on family stability and aspirations to middle-class status, including home ownership. According to the federal Task Force on Housing and Urban Development (1969), public housing supposedly clashed with “the general Canadian concept of social welfare and security,” which was based on providing the disadvantaged with sufficient income in private housing. 87 Yet in Saint John and other Canadian cities, public housing developed long waiting lists of hopeful tenants. The province became involved in 1967 with the establishment of the NB Housing Corporation, dedicated to building and operating low-income housing, providing loans for home improvements, and promoting seniors and cooperative housing. 88
34 Prior to the amalgamation of 1967, Saint John’s topography limited new housing to undeveloped sections of Millidgeville, between the old North End and the Kennebecasis River. Portland Place, a neighbourhood of Wartime Housing units that eventually were purchased by war veterans, had been one of the few major developments prior to the 1960s. It remains a fairly stable neighbourhood to this day. Public housing began in the mid 1940s with the municipally-owned Rockwood Court apartments. With nearly 400 units supported by CMHC (which took over from Wartime Housing in 1947), Rockwood Court was located north of the East End near a marshy area that later would be part of the route of the throughway. 89 In 1950, a tax-conscious Saint John Common Council turned down a proposal to work with CMHC to redevelop the East End with five hundred units of public housing. Instead, it opted to begin work on 88 units in the “Rifle Range,” an undeveloped area in the North End beyond Portland Place. The Rifle Range units, four-apartment duplexes, unofficially were reserved for military veterans. 90
35 Other than some possible infill projects, there was little suitable land for housing on the south peninsula or in the older sections of the North End, and few detached houses or apartment buildings were built prior to the 1960s. 91 One of the problems, because of geological features, was the high cost of development and services. Between 1963 and 1965, roughly 1,900 dwelling units, most of them houses, were built in the greater Saint John town planning area. From 1958 to 1965, 4,900 new building lots were created in greater Saint John, but only 2,980 were built on. 92 Huntington Valley, a 200-acre tract in Millidgeville, was a new type of development: a planned mixture of houses, townhouses, and small apartment buildings designed to house 5,000. In contrast to 1950s-style suburbs, one-sixth of the land was reserved for community open space, and land was reserved for businesses and schools. Although the first units were occupied in 1965, the project ran into difficulties. 93
36 With amalgamation came established and developing suburbs to the east and west, such as Forest Hills, Champlain Heights, Lakewood Heights, Fundy Heights, Greendale, and Quinton Heights, whose blue- and white-collar residents worked in Saint John’s shops, offices, and industrial establishments. 94 The expansion of these suburban districts, based mainly on the detached, single-family house, was fuelled by demographics and a rising standard of living. By 1971, 32.9% of the population of the CMA was under fifteen years of age. Increased numbers of children created a demand for new or expanded schools, churches, and recreational facilities. A case in point was a large “campus” high school, funded by federal dollars, planned for Millidgeville. This was a period when federal, provincial, and municipal officials envisioned massive industrial expansion on land to the west of the city, and predicted that the overall population would double. 95 Another was the new Simonds Regional High School. The dream of many families, whose parents had grown up in pre-war tenements, was a bungalow. Dick and Hood in 1978 were less than enthusiastic about Saint John’s “dormitory suburbs,” which were “aesthetically unpleasing, poorly serviced” and lacked “a sense of community.” 96
37 Until the early 1960s, most new housing in Canadian cities was built on vacant land, not redeveloped slum areas. 97 Saint John’s early 1960s urban renewal project was one of the largest ever supported by the NHA to that point. Yet less than ten percent of the project’s reclaimed land had been reserved for roughly 100 low-rental units for families displaced by renewal. The two-storey row houses of Courtenay Place, designed by the CMHC, included units with one to four bedrooms and parking spaces. Ottawa footed 75% of the construction costs under the NHA; the remainder was covered by the province. A private developer, assisted by the CMHC, built an apartment building nearby for senior citizens. In addition, a further 100 units of public housing were to be constructed in Thornborough, in the North End. 98 Part of the now expensive land near Courtenay Bay was reserved for a recreation field adjacent to a children’s recreation centre. 99 Another low-income housing site, for 99 units, was developed at Stanley Gardens in Millidgeville in 1965. The units were designed to house part of the population displaced from the East End. In this case, the CMHC loaned 80% of costs of construction to the city, which built the development through a city-sponsored company, First Limited Dividend Housing Ltd. Tenants who rented the one- and three-bedroom apartments were not permitted to earn more than $3,650 a year. 100
38 As of 1967, the social housing situation in Saint John was as follows: 582 units of public housing (with an approximately 20% turnover each year), 449 units of fixed-rental housing reserved primarily for veterans, and 99 units of limited dividend housing. The North End-West Side redevelopment scheme did not include housing as an official budget item, but its 1967 report advised that the city would need an additional 70 public housing apartment units and 30 units of limited dividend housing. Part of the 800 North End households to be evicted, it was concluded, could be accommodated in existing public housing because of annual turnover; the bulk of the families would have to rely on the private sector. 101 Interviews indicated that many families wanted to find their own accommodations; others held “very negative attitudes towards public housing” or believed that they could not afford the minimum rents. Only 25-30% of the residents in the Courtenay Place area had gone into public housing. 102 Residential mobility may have been an established factor. Like those of Montreal, Saint John tenants often moved each year in May. Press reports suggested that many of the dispossessed moved into South End flats, adding to urban social problems. 103
39 Municipal politicians accepted public housing as a necessary part of urban renewal, particularly when much of the cost of land and buildings was covered by senior levels of government. By 1967, on the national level, federal politicians debated the “housing crisis.” The New Brunswick Federation of Labour advocated more low-rental public housing; the local property owners association, in contrast, urged a moratorium on public housing. 104 Despite the protests of private landlords, the market failed to meet the demand for new housing; in the period 1966 to 1970, an average of only 250 units were added each year. One reason for the low numbers was that most builders in the Saint John area were small scale, and they assembled the land themselves. There was little speculative building; contractors waited until a buyer appeared before beginning a project. 105
40 During the 1960s the Baby Boom fostered growth in the western, eastern, and northern areas of the amalgamated city. Between 1961 and 1971, the population of the South End declined by 20% and middle-class families became a rarity. The South and North Ends continued to be characterized by low levels of owner occupancy (in the former, 85% of the population lived in rented premises). Almost half of the private dwellings in the CMA by 1971 were flats or apartments. Between 1971 and 1974, the cost of housing outpaced the relative growth of income. Despite (or perhaps because of) progress in urban renewal and social housing, many residents of the South End, the former East End, and the older sections of the North End lived in older, poorly maintained, crowded flats. A study in 1969 indicated that 30% of the city’s housing had been built before 1900 and 55% before 1930. 106 In 1971, 46% of the CMA’s private housing was more than 25 years old. 107 The construction boom of the 1970s (the Coleson Cove thermal plant, the Point Lepreau nuclear reactor, the dry dock and refinery expansions, and the throughway) produced a peak demand in 1974-75, with more than 1,400 units constructed. 108 Despite the spike in housing starts, the mayor in 1976 identified affordable housing as a major issue. 109
Social Planning
41 Urban growth coalitions tended to emphasize physical infrastructure, property values, investment, and jobs over social issues. 110 Yet supporters of the welfare state had long pointed to the need to provide safe, affordable housing. Social work, educational, and medical authorities endorsed slum clearance and public housing, as did organized labour. The building trades also supported large construction projects such as apartment buildings, office towers, port facilities, new roads, and power generation infrastructure. The business community, at least as represented by the Board of Trade, was not always in favour of redistribution of income. A large part of the resistance to Robichaud’s EOP was based on its redistributive features; Saint John was a “have” county compared to most of rural New Brunswick. Federal “Just Society” programmes also were criticized. The Board of Trade, suspicious of the expanding welfare state, viewed the 1970 provincial White Paper on Social Development and Social Reform as a call for “more socialism.” 111 The Board’s brief to a Senate committee chaired by David Croll in 1970 emphasized that poverty was best fought through industrialization, infrastructure improvement, and urban redevelopment, and stated that the topic of “welfare” could be a divisive force in a community. Universal health and welfare policies, it argued, were unrealistic and harmful, and welfare fraud was a growing problem. 112 The organization, which viewed itself as a watchdog over municipal budgets, held a closed-door meeting with the mayor and council in 1970 to discuss the implications of a major expansion of municipal services funded by a federal-provincial agreement, a new community plan, and plans for port and industrial expansion. 113
42 In the 1960s, a number of organizations dealt with and spoke for the disadvantaged in Saint John, such as the Social Services Council of the United Way, which represented more than 100 private agencies, and the Community Workers Association. Other than the New Brunswick Association for the Advancement of Coloured People (NBAACP), disadvantaged persons had little representation of their own. Anti-poverty and tenants’ rights activism became more of a force in the late 1960s and early 1970s, although there were glimpses of community voices in the media. In 1964, residents of the Rifle Range protested that public housing suffered from a negative public image. 114 In 1969, the NBAACP released a study supposedly based on interviews with 95% of the city’s black population. The results were discouraging, with complaints over discrimination in housing, education, and employment. The largest cluster of black families was found in North End public housing projects. 115 In the late 1960s outreach workers from the Company of Young Canadians, a federally-sponsored volunteer and community organizing group, helped to organize a tenants’ association for Crescent Valley public housing. A South End tenants’ association, representing residents of private flats and apartments, also developed. 116
43 With the growth of the welfare state, the poor became objects of increased state and professional scrutiny. In 1965, the city was chosen to be part of a national study on urban poverty by the Canadian Welfare Council. It concluded that incomes in Saint John, especially for the aged, were well below the national average, education levels were low, social welfare was behind the times, and the city had a severe housing problem. 117 A Comprehensive Community Survey, funded by the county, the province, and Ottawa, was authorized in 1966. Consultants Proctor, Redfern, Bousfield, and Bacon were tasked with studying the social, economic, and physical characteristics of greater Saint John. 118 One result of this effort was the formation of a North End-West Side Social Planning Council, representing more than thirty public and private agencies. 119
44 Another body of evidence was the work of the Senate (Croll) committee on poverty, which held hearings in Saint John in 1970. Despite the city’s negative image, Saint John’s income and employment levels, relative to the rest of New Brunswick, were fairly good. As the committee’s chairperson reminded his Saint John audience, poverty rates were actually higher in Ontario and Quebec than in the Maritimes. Saint John was also better off than many other parts of New Brunswick. 120 On the other hand, Saint John income and education levels generally were below the average for urban centres in Atlantic Canada. In 1971, for example, less that 4% of the adult population of the Saint John CMA had a university degree, and the average family income was below that of Fredericton, Moncton, Charlottetown, and Halifax. 121 In the Saint John CMA, 56% of families earned under $8,000 a year in 1971, compared to 40.2% in the Halifax CMA, 45.4% in Fredericton, and 47% in Moncton. Of 137 urban centres with more than 10,000 people, the Saint John CMA in 1971 ranked 98 th in terms of family income. 122
45 Housing continued to be a pressing need for low-income residents, many of whom had migrated from rural and small-town New Brunswick. Statistics from 1961 indicated that the province had the highest percentage of substandard dwellings in all of Canada, and among the highest rates of overcrowding. 123 Conditions would have been worse if the CMA’s population growth rate had not decreased after 1965. Compared to other towns and cities in the region, the Saint John CMA in 1971 had a high proportion of “apartments” (44.6% of private dwelling units), but few were in modern apartment buildings. A labour leader described Saint John’s system of public housing, where the poor and the middle class lived and attended school in distinct neighbourhoods, as a form of “segregation.” 124 The poor quality of private rental housing was a related issue. A member of a tenants’ association complained that if the City of Saint John were to enforce the building code and health and safety regulations, “they would have to move out a quarter of the population overnight.” 125 The 1973 Community Plan advised that 25-40% of the population of Saint John required some type of housing subsidy. 126
46 In 1976, concerns that social issues had taken a back seat to development led to the creation of the Saint John Human Development Project, designed to represent the poor, women, tenants, the handicapped, and consumers. Among the issues raised by the consultation: the segmented layout of the city, poor housing conditions, the deteriorating urban core, absentee landlordism, inadequate public transit, the primacy of industry, pollution, the concentration of the poor and aged in the city centre, and the city’s negative image. The study identified the shelter needs of the working poor, whose income was too high for public housing, as especially acute. This process led to the founding of a Human Development Council, which raised awareness and lobbied on issues such as adult literacy, housing, and health. 127
Conclusion
47 Saint John’s urban development in the 1960s and early 1970s was driven by a private sector-friendly agenda, supported by all three levels of government and the local media. 128 The process had its casualties: at least 1,500 families, up to 5,000 people—a large part of the working class population of the pre-1967 city—were uprooted. The minority found themselves in public housing, most of which was located in the North End, and were isolated from the “respectable” working class and the middle class, who now lived in suburban areas. Between 1971 and 1975, the city’s share of the CMA fell from 83.4% to 76%, the beginning of a decline that continues to this day. Many of those surveyed in the 1960s noted that they would have preferred to stay in their old neighbourhoods to be close to work. Part of the remaining majority may have gone on to buy or rent housing in more stable neighbourhoods, but we can only assume that the bulk of the displaced “urban villagers” ended up in substandard rental accommodations in the South End or in deteriorating sections of the North End that escaped renewal. 129
48 Urban renewal moved into the CBD in the 1970s with a private-sector development on King Street, an office tower-mall-hotel complex, replacing a turn-of-the-century department store and hotel. Three levels of government were involved in land assembly. Planners and municipal politicians supported more apartments for middle-class professionals and office workers in the city centre in order to offset the declining population. They also envisioned a civic centre for cultural events and increased reliance on tourism and conventions. More balanced approaches to planning were emerging. The 1973 Comprehensive Community Plan endorsed “preserving the pace, lifestyle, and landscape of the city centre” through accessing federal Neighbourhood Improvement Program grants, encouraging pedestrian traffic, expanding public transit, and preserving historic buildings. 130
49 By the early 1970s, urban planning and renewal had changed. There was less emphasis on large projects funded by the federal government and more on flexibility, conservation, and rehabilitation, such as the use of bylaws to conserve residential areas. The CMHC, for example, promoted mixed land use, social heterogeneity, and the redevelopment of waterfront and railway lands. No new large public housing projects were begun, but CMHC supported non-profit and cooperative housing, much of it in refurbished Victorian and Edwardian houses. The brick-and-stone houses and commercial buildings of the post-1877 “fire limits” area of the CBD/South end, most of which had escaped urban rental demolition, would attract more attention from planners and politicians in the 1970s, resulting in the formation of a heritage district. Also, given the negative associations of slum clearance and public housing, there was new attention to community input and participation. 131
50 In 1973, Saint John adopted a Comprehensive Community Plan, which based its optimistic growth projections on continued provincial and federal support for industrialization and port expansion. It projected a total of 250,000 residents in metropolitan Saint John by the mid 1980s. In reality the city’s population was in decline; physical and population expansion was on the fringes. The population of suburban communities beyond Saint John’s municipal boundaries grew by 10% between 1971 and 1976. 132 A series of mayors and councils in the late 1970s and 1980s, with the support of the business community, adopted the risky policy of incurring debt to fund major downtown enhancement projects that included a restored theatre, an aquatic centre, a waterfront festival marketplace, a trade and convention centre, and a hockey sportsplex.
51 Like Montreal, Baltimore, and other older port-industrial centres, the city’s population fell (by 9,000 between 1971 and 1981), the CMA’s population grew, and the number of manufacturing jobs declined. Yet Saint John, in comparison to its regional rivals (Moncton and Halifax) actually increased its reliance on industry in the 1980s (dangerously so according to De Benedetti). 133 This business-driven agenda, aided by three levels of government, had not created an urban renaissance. The middle-class, the skilled, and the educated were clustered in suburban communities, some of them in nearby King’s County. Nearly three decades after the beginning of urban renewal in the city, a provincial report faulted Saint John for its air pollution, deteriorating downtown, suburban sprawl, industrial encroachment upon residential areas, weak cultural and entertainment sectors, and narrow retail base. On almost every measure, “progress” had helped to worsen many of the community’s underlying structural problems. 134
Greg Marquis teaches Canadian and North American history at the University of New Brunswick Saint John. In addition to researching criminal justice, social, urban, and cultural history, he has researched and advocated on contemporary public policy issues, including aboriginal rights, heritage, and immigration.
Research for this paper was supported by the University of New Brunswick and the Social Sciences and Humanities Research Council of Canada and assisted by Jason Smith and Wren Crandall. Map courtesy of Harold Wright.