Predicting New Product Success or Failure:
A Comparison of U.S. and U.K. Practices
David BerkowitzUniversity of Alabama, Huntsville, U.S.A.
Brent M. Wren
University of Alabama, Huntsville, U.S.A.
E. Stephen Grant
University of New Brunswick, Canada
We propose a model that allows managers to assess new product development (NPD) projects, combined with the anticipated strategy, prior to introduction and to estimate a probability of success. This model allows for an evaluation and prioritization of resource commitments. A test of this model that compares companies within the United States (U.S.) and the United Kingdom (U.K.) is provided.
Introduction
1 It has been estimated that on average more than 35% of firm revenues are generated from products that did not exist 5 years ago. In many high tech industries the percentage is substantially greater (Nambisan, 2003; Griffin, 1997). Realizing the impact of new products on the revenue stream, firms spend significant amounts of money developing and commercializing "fresh", "new and improved", "competitively superior" products for the marketplace. However, the new product failure rates continue to remain high, with only slightly more than half of all products launched attaining any degree of commercial success. A commercial failure has both monetary and non-monetary (e.g., brand equity, image) implications for a firm.
2 Given the amount of resources that are devoted to new product launches, and the potential downside consequences of a product failure, it is critical that new product development (NPD) managers focus on engaging the most appropriate strategies and activities to help ensure commercial success. One of the most important issues that managers face is determining which products and technologies have the potential to be successful, prior to risking precious capital, time, and human resources. To complicate matters, often times it is not the product alone that contributes to the level of success, but rather the strategy employed by the firm to help position the product in the marketplace.
3 While there have been studies that have tried to link strategy with new product introduction (c.f. Gatignon and Xuereb, 1997; Souder and Song, 1997), few studies have explored the role of strategy as it interacts with product introduction. Furthermore, in the absence of data and prior to product launch, it is difficult to predict whether a product will achieve success. It is critical that the manager have some tools to help assess the likelihood of project success before committing significant additional capital. In this paper, we explore the similarities and differences in NPD in the United States (U.S.) and United Kingdom (U.K.) in order to develop a profile of attributes combined with the strategies used, that have led to new product success. The technique that we use allows for the manager to assess the project, combined with the anticipated strategy, prior to introduction and to estimate a probability of success.
4 The rest of the paper is organized as follows. Using the previous literature on success, we develop a conceptual model of NPD success, then test the model in the two countries. We analyze our data by developing a logistic regression model to predict the success of high tech NPD projects in the U.S. and U.K. We conclude by providing a discussion of findings and managerial implications.
Literature Review
Conceptual Model Development
5 The development of our model was influenced by previous studies in NPD. Recent literature reviews helped us develop the constructs and relationships explored in our conceptual model. Specifically, we have relied on the work of Gatignon and Xuereb (1997), Souder and Song (1997), Song and Parry (1996), Brown and Eisenhardt (1995), Montoya-Weiss and Calantone (1994), and Song, Souder, and Dyer (1997).
6 Gatignon and Xuereb (1997) develop a structural model to investigate strategic orientation and new product performance. They evaluated three facets of orientation: customer orientation, competitive orientation, and technological orientation. Taking a contingency approach, they found that (under different market conditions) different orientations were more influential moderators of success. Specifically, they found that firms wanting to produce superior products relative to competition required technological orientation, while firms that were in high-growth markets were better positioned with competitive orientation. Alternatively, firms that were in uncertain markets were better performers when they had a consumer and technology oriented strategy. Finally, the competitive orientation was important when demand was more certain.
7 Souder and Song (1997) developed a model that incorporates strategic trade-offs as a predictor of commercial success. Song and Parry (1996) identified two important determinants of new product success. They found that cross-functional integration and product competitive advantage were critical for new product success. Brown and Eisenhardt (1995) combined three major streams of research. Their research suggests that an efficient process, an effective product, and large markets were all contributors to financial success. Song, Souder, and Dyer (1997) developed a causal model, which embodies the above findings. Their model proposes that five factors lead to marketing and technical proficiency, which in turn determined product quality and ultimately new product success or failure.
8 Thus, the previous empirical work leaves two gaps in our understanding. First, the previous work has focused only on understanding success within the context of various antecedents, while not including moderating effects of variables such a strategy, that are likely to influence the outcome of success. Second, with the exception of Song, Souder and Dyer (1997), previous research has focused primarily on success for NPD within U.S. firms. Our research hopes to further our understanding by incorporating antecedents as well as moderators of success, while extending our knowledge beyond U.S. firms. Figure 1 is a conceptual figure which depicts our model.
Figure 1. Conceptual Model Development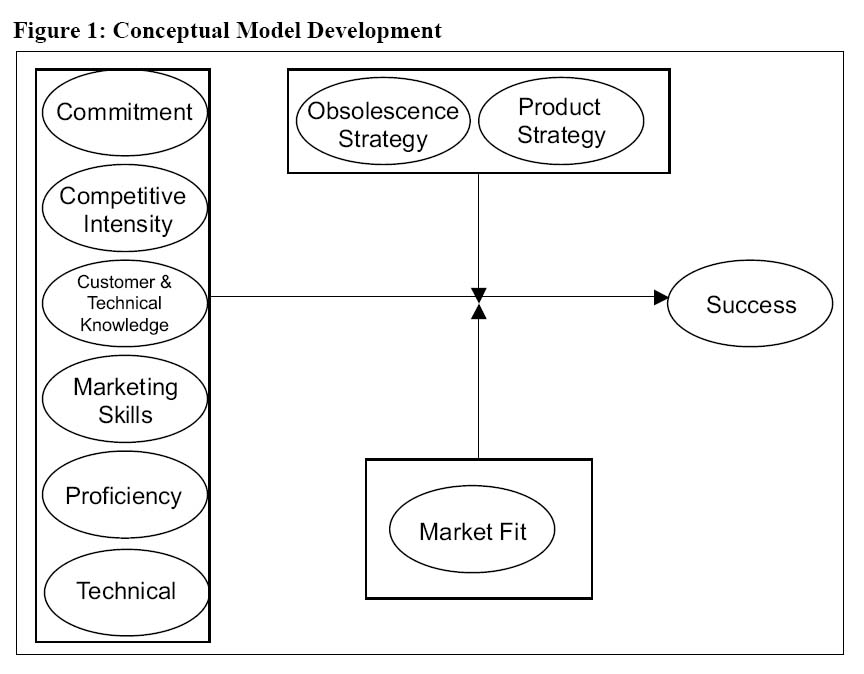
Construct Definition and Hypothesis Development
Success
9 We define the dependent variable Success, as the perception of commercial product success or failure. This is defined as the extent to which the commercial outcome of the project is consistent with the firm’s prior expectations. Expectations are defined in terms of the original goals set for the product. Specifically, the goals were defined in terms of sales, market share, return on investment, profit, customer satisfaction, contribution to technology leadership, and contribution to market leadership.
Knowledge
10 Knowledge can be broken into two components: customer knowledge and technical knowledge. Firms can use this knowledge as one of the resources that help generate a sustainable competitive advantage (Barney, 1991; Wernerfelt, 1984). However, the two types of knowledge must be recognized and accounted for separately in order to determine their relative effect on success. Firms make strategic decisions to invest in technical competencies in order to build sustainable competitive advantages. They also invest in customer relationships to build an understanding of each customer and the unique needs that are required. This can also be used to help build a sustainable competitive advantage. Thus, the more knowledge that a firm has about its customers (in the requirements of the technological phenomenon for the project) the more likely they are to succeed in producing a product that is consistent with the desires of the customer. Therefore, they are more likely to succeed in the marketplace as well. We define Knowledge as the firm’s information about the customer’s requirements and its understanding of the technological aspects of the project. This is a four-item measure. Consistently, our hypothesis can be stated as:
- H1: The firm’s knowledge is related positively to commercial success.
Technical Strength
11 Consistent with previous findings, we develop the construct of technical strength and anticipate it to be positively related with success in the marketplace. Previous research has found that firms that are strong in technical competence and find themselves in marketplaces that are relatively uncertain are more likely to have success (Gatignon & Xuereb, 1997). For this study, Technical Strength is defined as the extent to which the firm’s research & development, engineering, and manufacturing are at both the appropriate level and compatible with the project’s requirements. To measure this, we use a six-item measure and state the following formal hypothesis.
- H2: The compatibility between the project team’s technical skills and technical requirements of the project are positively related to commercial success.
Proficiency
12 For our purposes, we evaluate two types of proficiency: Proficiency in Product Development and Proficiency in Product Launch. Proficiency in Product Development reflects the development process and is the project team’s perception of how proficiently it performs the exploratory, concept development, prototype development, and testing stages of the NPD process. Proficiency in the development stage implies shorter cycle times. In turn, shorter cycle times imply that the product gets to the marketplace faster and thus brings greater returns to the organization. This also implies that firms are more likely to perceive that the product was a success.
13 However, this is not the entire force behind success. Proficiency in Product Launch is critical as well. Proficiency in Product Launch is defined as the perception of the product team’s proficiency in developing manufacturing, marketing, and technical service start-ups. Proficiency in product launch implies that the firm has the ability to execute a strategy to make the product appear in the marketplace. By being proficient in executing the marketing strategy, the firm is likely to be successful. Therefore, the two constructs are interrelated. For example, while a firm can be proficient in product development, they may have a downfall in product launch and, therefore, the success of the entire project is in jeopardy. On the other hand, firms that execute and are proficient in both product launch and product development are likely to be more successful. Therefore, we define Proficiency as the timeliness, thoroughness, and quality in conducting product development and launch processes. We use a seven-item measure to capture this construct. Our formal hypothesis is stated as:
- H3: A project team’s proficiency in product development process is related positively to the firm’s perception of new product commercial success.
Commitment
14 Previous research has shown that top-level management’s involvement and commitment of resources are critical to the success of many projects. We measure top-level management’s involvement, the overall level of resources, the quality of resources, and the degree of planning and control for the project. We define Commitment as the firm’s allocation of resources to the project. We use a four-item measure for this construct. Our hypothesis is stated as:
- H4: The firm’s level of commitment of top management support and resources is related positively to the perception of commercial success.
Competitive Intensity
15 The more competitive a marketplace is, the less likely that a new product introduced into this marketplace will enjoy success. Therefore, it is important to understand the level of competition in markets before attempting to develop products for these markets. The construct of Intensity is defined as the level of competition for this product. This two-item measure seeks to provide insight into the competitive intensity of the marketplace. We stayed our hypothesis as:
- H5: Greater levels of market intensity are negatively related to the perception of commercial success.
Marketing Skill
16 The competency of the firm’s marketing skills has been identified as antecedents to the development and launch proficiencies, and to new product success. The literature does not make a distinction between competency and appropriateness in marketing skills analogous to the above distinction for technical skills. This is a four-item measure. Thus, Marketing Skill is defined as the firm’s ability to implement the marketing strategy. Therefore, we hypothesize the following:
- H6: The firm’s marketing skills are related positively to commercial success.
Company Fit
17 Company Fit defines the similarities among the firm’s existing markets, product lines, and marketing skills and the new project requirements. Consistent with experience and commonsense, products that "fit" the firm’s existing product lines, markets, and skills have repeatedly been found to exhibit higher success rates (Souder and Song, 1997). Fit, as defined here, is based on the notion that it reflects a sufficiency to denote "the matching of abilities with requirements" (Baker, Mapes, New, & Szwejczewski, 1997). Clearly, firms that "know" and operate in a market are better suited to develop new product for the market. These firms have greater access to potential customers and users. In addition, products that are developed with the assistance of lead users are generally more market-oriented. We use a two-item measure to better understand how the company fits with this product.
18 The notion of how the company fits with the product being developed implies that this variable moderates the impact with the previously defined constructs. Therefore, we position company fit as an interaction moderator of the previous constructs. We therefore hypothesize the following:
- H7a: The interaction of company fit and knowledge are related positively to the perception of commercial success.
- H7b: The interaction of company fit and technical strength are related positively to the perception of commercial success.
- H7c: The interaction of company fit and project propensity are related positively to the perception of commercial success.
- H7d: The interaction of company fit and commitment are related positively to the perception of commercial success.
- H7e: The interaction of company fit and intensity are related negatively to the perception of commercial success.
- H7f: The interaction of company fit and marketing skill are related positively to the perception of commercial success.
Strategy
19 Our final variables are strategy variables. The strategy used by the firm could be flawed and thus hinder the ability of the firm to be successful. Specifically, we are investigating whether the company has employed an obsolescence strategy, a product strategy, or both. Our product strategy is further broken into a diversification strategy: a market penetration strategy, a product development strategy, or a market development strategy (Kotler & Armstrong, 1999). Each strategy has a different level of associated risk. Therefore, we have used indicator variables to control for the type of strategy employed by the firm for this project. We anticipate that the strategy variables will have a moderating effect on success.
Data Gathering and Analysis
20 The data for this study were gathered using interviews administered to U.S. and U.K. managers. Therefore, the response rate was 100 %. The focus of the interviews was to provide insights into management’s perceptions of the project and success. Managers were questioned about each construct of interest. In addition, they were asked to provide a perceptual measure of success for each NPD project. This provided a clear understanding of the relationship between the management of the project and the eventual outcome.
21 The sample used for analysis was randomly selected from the total dataset. A random selection was done to ensure a matched sample size of 40 successful projects and 40 unsuccessful projects for each country. Thus, 160 out of 213 (111 U.S., 102 U.K.) observations were used.
Measure Development
22 The attitude questions were developed in order to assess the constructs listed above. Previous items found in the literature were used as a starting point for the measure development process. In addition, an original pool of items was generated to tap the constructs.
Reliability and Unidimensionality
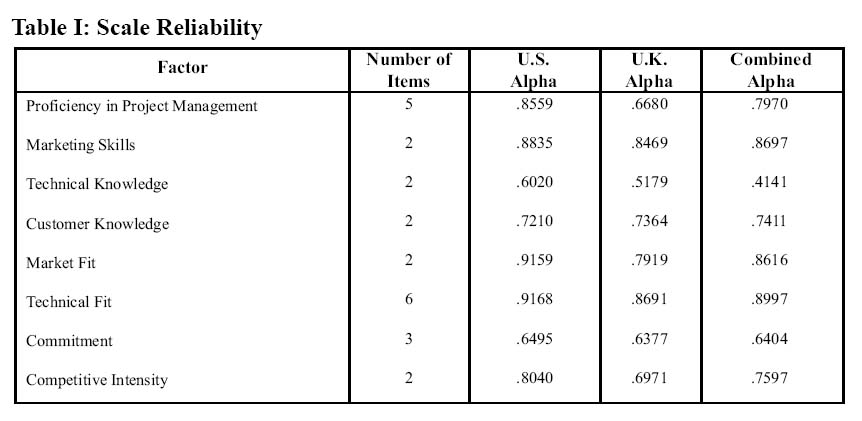
23 The test of reliability used is calculation of Cronbach’s alpha (Cronbach, 1951). Cronbach’s alpha is regarded as the lower bound on reliability for a set of congeneric measures (Bollen, 1989). It assumes each of the items within the scale contributes equally to the underlying trait (Zeller and Carmines, 1980). The alphas are reported in Table I. As indicated by the reliabilities, the measures are relatively homogeneous for the construct they purport to measure. Typically, reliabilities greater than .7 are considered adequate for measurement analysis (Nunnally, 1978). All but two measures in our analysis meet this standard. Knowledge and commitment are just below the threshold set by Nunnally (1978).
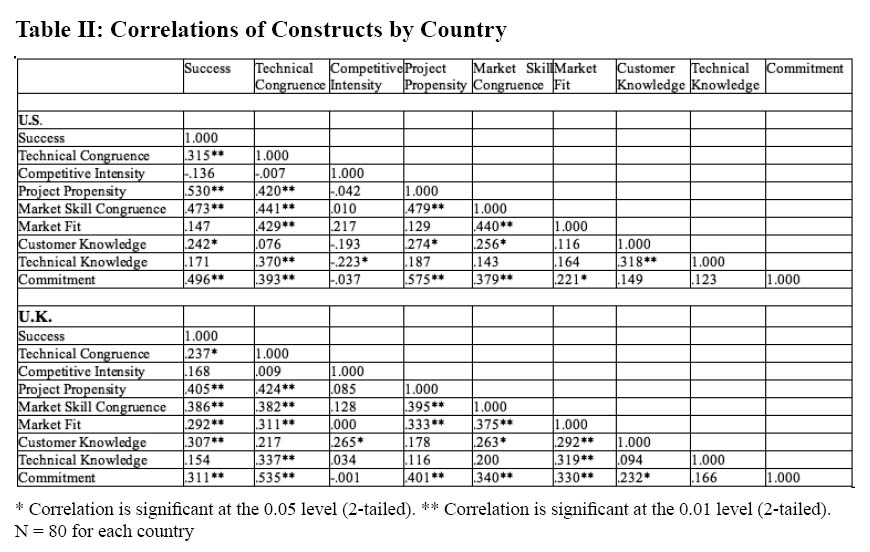
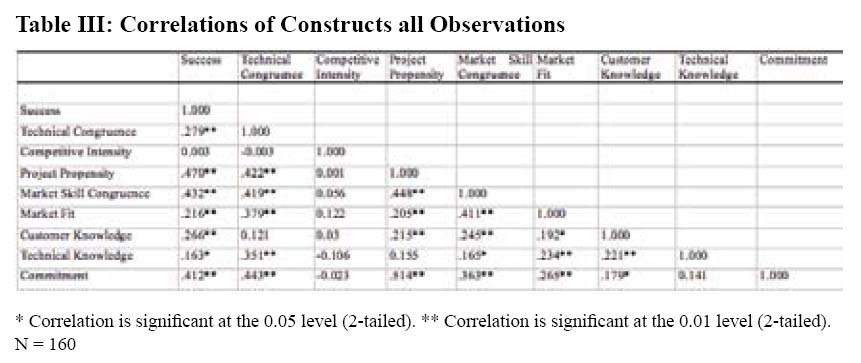
24 Table II shows the correlation matrix by country used for the analysis. Table III shows the correlation matrix used for the combined dataset. As you would expect, the correlations between the independent variables and the dependent variable success are statistically significant. Only Intensity is not significantly correlated to the dependent variable. In addition, we note that the correlations are below .6 for all constructs. This is an indication that there is little multicollinearity between the constructs.
Table I: Scale Reliability
Display large image of Table 1
Table II: Correlations of Constructs by Country
Display large image of Table 2
Table III: Correlations of Constructs all Observations
Model Building
25 The resulting data allowed for matching the project management information through to the success or failure of each NPD project. The survey was then analyzed to provide insights into the potential relationship between the constructs of interest and the dependent variable success. Since success can be coded as either a yes or no, logistic regression analysis was used to analyze the data. Thus, the original measure of success was re-coded into two categories. The first category coded as ‘1’ indicated that the project was below expectations and thus was not successful. The second category coded as a ‘2’ indicated that the project met or exceeded expectations and thus was a success.
Logistic Regression
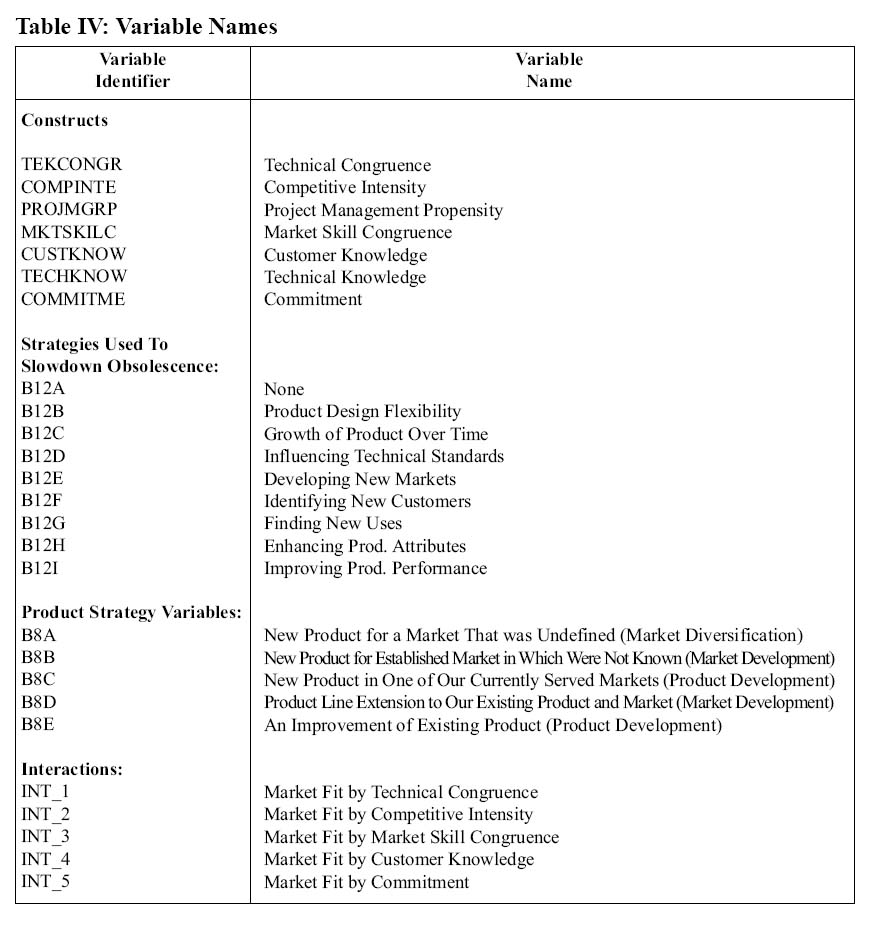
26 A logistic regression model can be used if the dependent variable only has two conditions. The logistic regression model was developed to segment the sample into two groups: successful projects and non-successful projects. A logistic regression analysis is useful in developing linear composites of the predictor variables. This enables the user to predict the probability of outcome for an event (Greene & Tull, 1978). The advantage of using the logistic regression procedure is that one can overcome some of the assumption violations that are present in the use of techniques such as multiple regression. For example, with multiple regression it is unreasonable to assume that the distribution of errors is normal. In addition, the predicted values cannot be interpreted as probabilities. That is, they cannot be constrained between 1 and 0. Logistic regression relaxes these assumptions. Thus, if the dependent variable has two categories, it is preferable to use logistic regression. Since only two groups were being classified in this case (successful projects and non-successful projects), a logistic regression analysis was used for classification. Table IV provides a list of the variable names used in the logistic regression model.
Table IV: Variable Names
Interpretation of Results
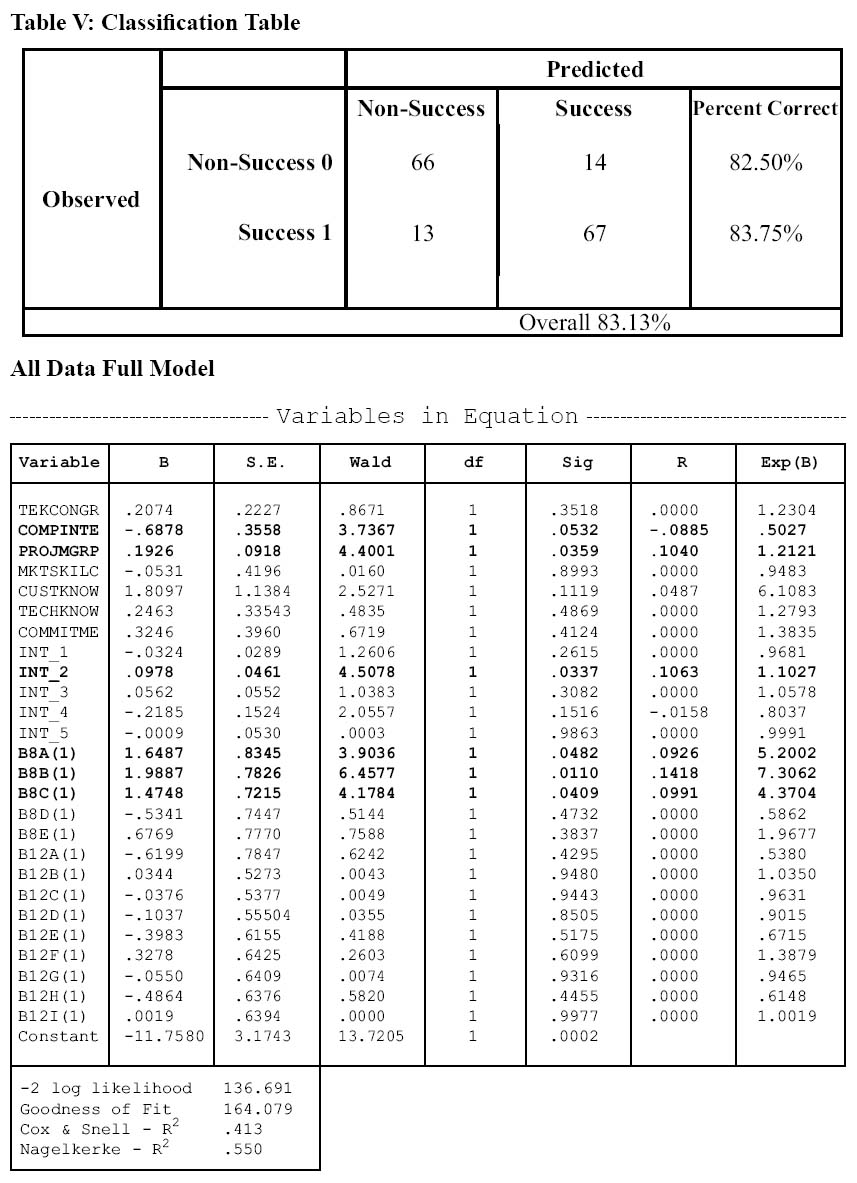
27 From the results in Table V, it is clear that the overall model does sufficiently well to warrant looking at the individual models by country. The overall model achieves a prediction rate of about 83 % correct. The model performs equally well in predicting both successes and non-successes. Overall prediction for the non-success category is 82.5 %, while prediction for the success category is 83.75 %. The implication is that the overall model properly classified 83 % of our observations, given the constructs we have hypothesized.
Table V: Classification Table
Display large image of Table 5
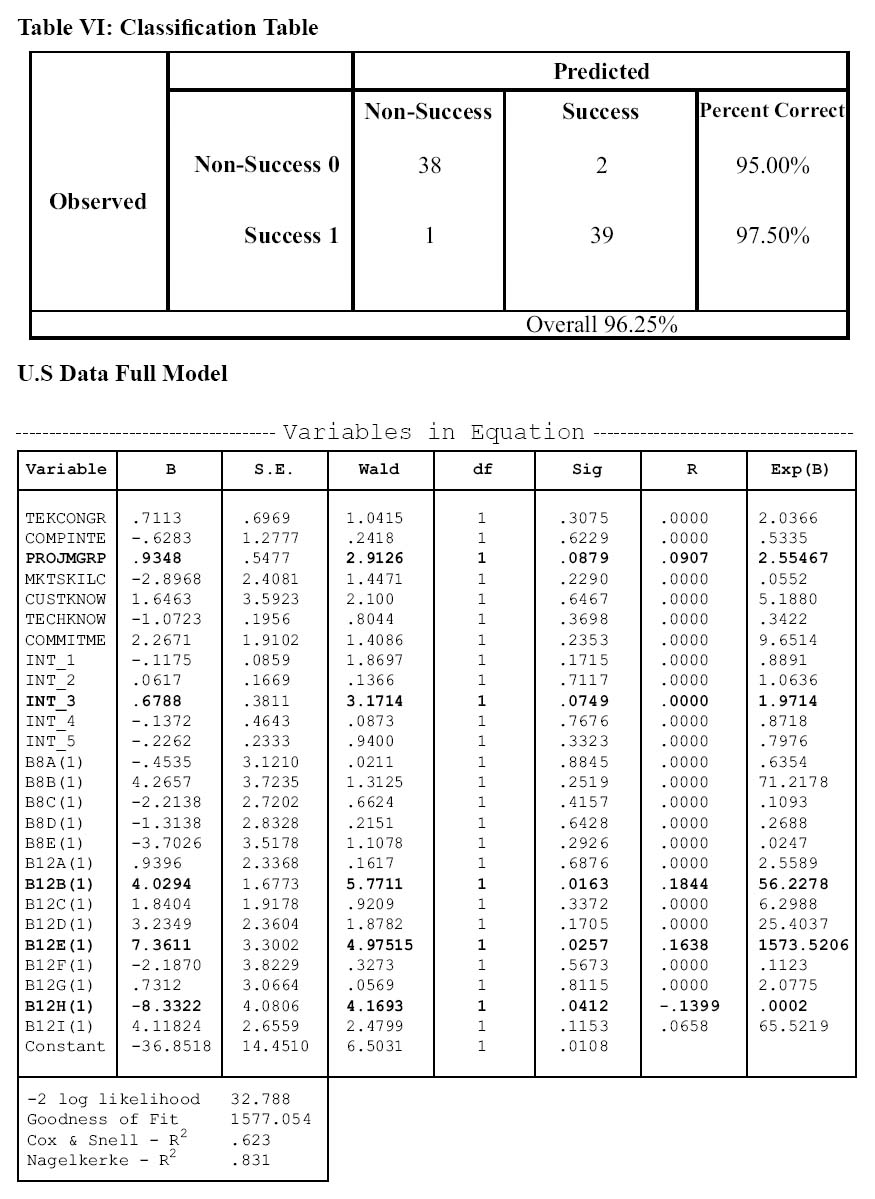
28 A more detailed analysis by country shows that the U.S. data are better at predicting success than the U.K. data. In Table VI, the U.S. data show an overall prediction rate of greater than 96 %. Our model performs well in predicting both successes and non-successes. The total misclassification is only three observations. This is a remarkably strong indicator that our variables are important in predicting success. In Table VII, the U.K. data show an overall prediction rate of 85 %. With this data there is a better prediction rate for non-successes. Still, the model only classifies 12 of the 80 observations incorrectly. Once again, this provides evidence to suggest that the variables we have included in our analysis are meaningful in predicting success. One particularly interesting finding is that the individual country models perform better than the aggregate model. This suggests that there are differences in direction between the two countries, and a generic model is not necessarily the best predictor of performance.
Table VI: Classification Table
Display large image of Table 6
Table VI: Classification Table
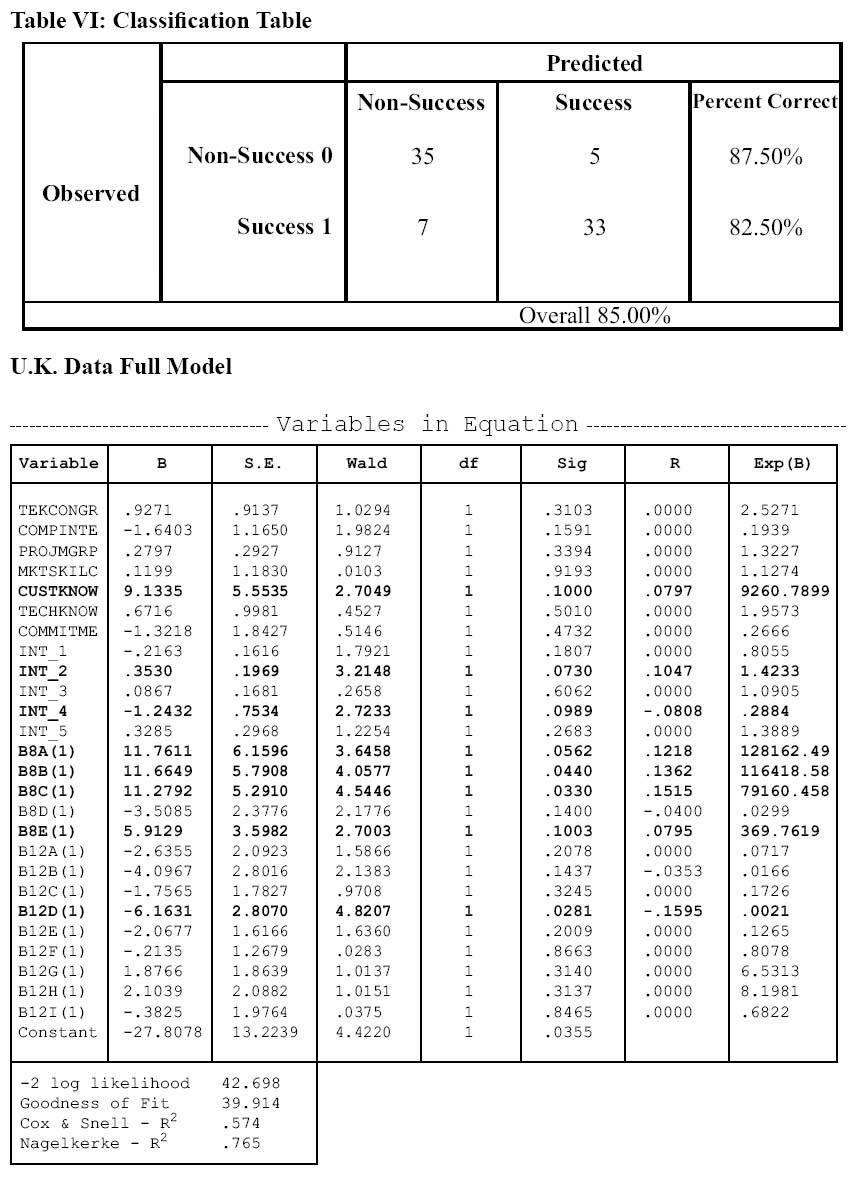
Display large image of Table 7
29 If we look at the individual variables that are significant in our model, we discover some very interesting findings. In the overall model, the following variables are significant at .1 or less: (i) competitive intensity; (ii) project management propensity; (iii) the interaction between competitive intensity and market fit; (iv) new product for a market that was undefined; (v) new product for an established market in which we were not known; (vi) new product to one of our currently served markets; and (vii) the constant. While significance of individual variables is important, it is not the only indicator of importance in logistic regression. The variable Exp (B) reports the odds ratio for each variable. This ratio can be interpreted as the effect of the independent variable on the dependent variable, ultimately increasing or decreasing the odds of the dependent variable.
30 In Table 5, we see the variable that has the greatest odds of increasing success is new product for an established market in which we were not known (7.30602). This implies that we are 730 times more likely to be successful if we adopt this strategy. However, the second most important variable with respect to odds (customer knowledge, 6.1083) is not significant at the traditional levels. In general, the three strategy variables give the firm the greatest chance of increasing success. The diversification strategy of generating new products for the defined markets or markets for which we are not known provides the best odds of success. Still, developing a new product for a currently served market has a far greater impact than any of our individual skills, except customer knowledge. The most important variable that would hinder success is competitive intensity (.5027). This is as expected. The greater the competitive intensity, the more likely NPD projects will not succeed.
31 The U.S. model has the following variables significant at.1 or less: (i) project management propensity; (ii) the interaction between the market fit and market skill; (iii) product design flexibility; (iv) developing new markets; (v) enhancing product attributes; and (vi) the constant. With this model, a much different picture emerges with respect to the odds of success. Specifically, developing new markets is by far the overwhelming strategy for success (1573.5206). All other variables pale in comparison to the overwhelming favorable odds of employing this strategy. On the hindrance side, enhancing product attributes (.0002) appears to have the most dramatic influence on non-success. Thus, the strategy of enhancing product attributes is likely to be viewed as unsuccessful.
32 The U.K. model has the following variables as significant at the.1 or less: (i) customer knowledge; (ii) the interaction between competitive intensity and market fit; (iii) the interaction between customer knowledge and market fit; (iv) new product for the market that was undefined; (v) new product for established market in which we were not known; (vi) new product in one of our currently served markets; (vii) an improvement in existing product; (viii) influence and technical standards; and (ix) the constant. An altogether different picture emerges with respect to the odds of success for the U.K. Here it can be noted that several variables have tremendous influence on the odds of success. With three strategy variables noted in the overall model, all strongly influence success. Developing a new product for an established market or an undefined market is a clear way to increase your odds for success. On the downside, the firm in the U.K. is most likely to hinder success by trying to influence technical standards.
Conclusions and Directions for Future Research
33 The overall model properly classifies 83 % of our observations. The U.S. data were slightly better at predicting success than the U.K. data, 96 % accuracy versus 85% accuracy. This provides evidence to suggest that the variables that we have included in our analysis are meaningful in predicting success. One particularly interesting finding is that the individual country models perform better than the aggregate model. This suggests that there are differences in direction between the two countries, and a generic model is not necessarily the best predictor of performance. In terms of specific predictors of success/failure (competitive intensity, project management propensity, the interaction between competitive intensity and market fit), three specific strategy variables were found to be most important considerations.
34 A substantial proportion of firm revenue is generated from "new products." With so many variables affecting product success, it is hard to predict which products will succeed or fail prior to launch. Given the amount of resources that are devoted to NPD activities, it is critical that NPD managers focus on engaging the most appropriate strategies and activities to help ensure commercial success. This paper provides a method that managers can use to predict product success prior to launch, allowing for an evaluation and prioritization of resource commitments.
35 While the model performs well in the current application, it was applied on only two countries. Future research should be conducted to further evaluate its generalization to other countries. Also, we evaluated new product success on a dichotomous variable (success/fail), whereas many companies view success as a matter of degree. Future research could expand the definition and operationalization of success.
References
Baker, J.C., Mapes, J., New, C.C., and Szwejczewski, M. (1997). Hierarchical Model of Business Competence. Integrated Manufacturing Systems, 8 (5): 265-272.
Barney, J. (1991). Firm Resources and Sustained Competitive Advantage. Journal of Management, 17, (1): 99-120.
Bollen, K. (1989). A New Incremental Fit Index for General Structural Equation Models. Sociological Methods and Research, 17: 303-16.
Brown, S.L. and Eisenhardt, K.M. (1995). Product Development: Past Research, Present Findings, and Future Directions. Academy of Management Review, Vol. 20 No. 2, pp. 343-378.
Clark, T. (1990). International Marketing and National Character: A Review and Proposal for an Integrative Theory. Journal of Marketing, Vol. 54, October, pp. 66-79.
Cronbach, L. J. (1951). Coefficient Alpha and the Internal Structure of Tests. Psychometrika, 16 (September), pp. 297-334.
Gatignon, H. and Xuereb, J.-M. (1997). Strategic Orientation of the Firm and New Product Performance. Journal of Marketing Research, 34 (1): 77-90.
Greene, P.E. and Tull, D. (1978). Research for Marketing Decisions, EnglewoodCliffs, NJ.
Griffin, A. (1997). PDMA Research on New Product Development Practices: Updating Trends and Benchmarking Best Practices. Journal of Product Innovation Management, 14(6): 429-458.
Kotler P., and Armstrong, G. (1999). Principles of Marketing, 8th edition, New Jersey: Prentice-Hall International.
Montoya-Weiss, M.M. and Calantone, R. (1994).Determinants of New Product Performance: A Review and Meta Analysis. Journal of Product Innovation Management, Vol. 11 No. 5: 397-418.
Nambisan, S. (2003) Information Systems as a Reference Discipline for New Product Development. MIS Quarterly, 27: 1, 1-18.
Nunnally, J.C. (1978). Psychometric Theory. 2nd ed. New York: McGraw-Hill Book Company.
Song, M.X. and Parry, M.E. (1996). The Determinants of Japanese New Product Success. Journal of Marketing Research, Vol. 34, February, pp. 64-76.
Song, M.X., Souder, W.E. and Dyer, B. (1997). A Causal Model of the Impact of Skills, Synergy, and Design Sensitivity on New Product Performance. Journal of Product Innovation Management, Vol. 14 No. 2, pp. 88-101.
Souder, W.E. and Song, M.X. (1997). Contingent Product Design and Market Strategies Influencing New Product Success and Failure in U.S. and Japanese Electronics Firms. Journal of Product Innovation Management, Vol. 14: 21-34.
Zeller, R.A., and Carmines, E.G. (1980). Measurement in the Social Sciences. New York: Cambridge University Press.
Wernerfelt, B. (1984). A Resource-Based View of the Firm. Strategic Management Journal, 5, 171-180.