International E-Banking:
ICT Investments and the Basel Accord
Hong-Jen LinCity University of New York, U.S.A.
Winston T. Lin
State University of New York at Buffalo, U.S.A.
This study investigates how the Basel Accord and Information and Telecommunications Technologies (ICT) investments affect the commercial banking industries across countries. We employ the stochastic frontier approach to explore a data set composed of commercial banks from 51 countries. We find that telecommunications investment reduces, and the Basel Accord proxy enhances, the cost efficiency of commercial banks under study. Moreover, it is found that ICT investments improve cost efficiencies of commercial banks for countries in which the regulations are consistent with the international supervision.
1. Introduction
1 During the past decade, commercial banks have witnessed dramatic change in information and telecommunications technologies (called ICT hereinafter). For instance, the use of electronic communication, such as electronic bill paying, home banking, and internet transaction, has been altering the relationship of business-to-business (B2B) and business-to-customer (B2C). The marketing accessibility of financial institutions is extended and increased to remote areas or countries via the new telecommunications technology. Hence, the role of ICT investments becomes more important in the banking industry. This trend is also called e-banking.
2 The impacts of ICT in banking are categorized into three categories: 1) globalization, 2) deregulation, and 3) consolidation (Nieto, 2001). First, commercial banks can outreach remote clients via electronic communications devices to the extent that foreign customers are able to process transactions across national borders. Thus, the banking markets are marching toward globalization. Second, accompanying globalization, deregulation in the banking industry prevails in many countries in order to improve the competitive strength of the financial industry of a nation. Third, new technologies also enlarge the capacities of financial institutions and thus improve their cost efficiency. Therefore, more and more commercial banks have merged together to attain a higher level of efficiency than before.
3 These issues on e-banking are international. Since the consolidation of financial institutions may take place across countries with different regulatory rules, the international supervision on the banking regulation is urgent. In other words, we must set up proper international banking regulations in order to satisfy the needs of the international e-banking. Via the efforts of international regulations such as the Basel Accord,1 customers can be securely protected, transactions can be smoothly processed, and operations are tightly monitored by the supervisory bodies who join this Accord. The Basel Accord requires commercial banks in member countries to maintain adequate capitals and disclose related information to the public. Consequently, commercial banks become more transparent across countries and thus, more efficient than ever before.
4 This paper differentiates itself from previous studies in several aspects. First, this research is devoted to the impact of ICT investments in commercial banking. Many previous studies (e.g., Hunter and Timme, 1991, among others) have explored the ‘technological change’, instead of the ICT investments, of commercial banks, while the concept of technological change is too broad. Second, not many efforts have been made on the international comparison in commercial banking. One of the few exceptions is Allen and Rai (1996). Nevertheless, their efforts do not involve commercial banks in emerging economies. Third, previous IT research focuses on the effect of IT investments on the productivity of non-financial industries (or across industries) rather than the effect of ICT investments on the banking industry. Fourth, this is a pioneering attempt to link the impact of ICT investments to that of international banking regulations.
5 The objective of this study is twofold: first, to address the question-‘do ICT investments contribute to commercial banks?’ and, second, to investigate the question- ‘does the countries joined the Basel Accord outperform those non-Basel Accord countries in terms of cost efficiencies?’ In essence, we would like to explore the sources of the cost efficiency of international commercial banking: is it from regulations or from ICT investments? or from both? In the methodological issues, it is worth noting that the efficiency analysis has become dominant in the research of financial institutions. We follow this convention but adopt a more generalized stochastic frontier approach to estimate cost efficiency (Wang and Schmidt, 2002). Our approach is shown empirically and theoretically superior to previous ones. The remainder of this research is structured as follows. Section 2 discusses the methodologies used and Section 3 provides the data sources and statistical hypotheses. Section 4 presents and analyzes empirical results. Finally, Section 5 concludes.
2. Methodologies
6 This section is designed to specify the estimation models on which the analysis is based. We explain the measure of cost efficiency, often used in the literature of financial institutions.
7 The present section consists of three subsections. Subsection 2.1 introduces notations of the variables used and details the choices of ICT proxies. Subsection 2.2 discusses methodological issues regarding cost efficiency. Finally, Subsection 2.3 specifies the estimation models.
2.1 Notations and ICT Proxies
8 The variables used in this study are classified into five categories: dependent variables, output variables, input prices, control variables, and ICT proxies, where output variables and input prices are key variables in the traditional stochastic frontier analysis. The notations used are described as follows:
The dependent variable of the cost frontier is LNTCit where:LNTCit = ln (TCit / TAit)
TCit = the sum of a bank's operating and interest costs
TAit = total assets
and the subscripts i and t denote bank i at time t. The output variables are represented by a vector of output yit that includes:LNLN it = ln(LN it /TAit )
LNTD it = ln(TDit /TAit )
LNFI it = ln(FI it /TAit )
whereLN it = the sum of personal loans, commercial loans, property and real estate loans, and industrial loans
TDit = the sum of demand and term deposits
FI it = the sum of long - term and short - term investments
LN it / TAit = the ratio of total loans to total assets
TDit / TAit = the ratio of total deposits to to total assets
andFI it / TAit = the ratio of financial investments over total assets
9 The vector of input prices is denoted by pit: (e.g., the wage of labor and price of capital), which is listed as follows:2
LNWit = ln(wit /TAit )where wit is the wage rate,LNC it = lnrit
and rit is the real deposit rate,rit = price of capital in real term
10 Note that the scales of different banks in different countries vary widely, so do the variance of the firm-specific variables for different banks in different countries. In order to account for such heteroscedastic nature of commercial banks, TCit, TDit, FIit, LNit, and wit are measured in the comparative ratios to total assets. That is, the outputs, total costs, and wage rates are divided by the amount of the total assets (TAit) of the bank i at time t.
11 The control variables represented by country risk variables are:
FIN it = country financial riskPOL it = country political risk
ECO it = country economic risk
12 The three control variables are country-specific. Thus, they stay the same for different banks within a country and differ for banks for different countries. Although the dependent variable, the output variables, and the wage of labor are firm-specific, it is insightful to use country-specific control variables since the Basel proxy B and the ICT investments proxies are also country-specific variables (detailed in the following paragraphs).
13 This study uses three country risk indicators, financial risk, political risk, and economic risk as control variables, which are used in Chen and Lin (1994) and compiled by the PRS (Political Risk Services) Group Inc. (2001). Their country risk rating systems are detailed in Appendix. Since these three types of country risk indices reflect the time-varying and comparative risks of a country, it is necessary to incorporate them into the model as control variables while evaluating the impact of ICT.
14 ICT-related variables for a financial institution are not readily available, so the country-level proxies are used. The e-banking variables are not available, either, so we are forced to use ICT proxies as the substitutes of e-banking variables.
15 In previous studies, either the country level IT capital stock (Dewan and Kraemer, 2000, and Daveri, 2001) or firm-level IT stock (Hitt and Brynjolfsson, 1996; Lin and Shao, 2000; and Shao and Lin, 2000, 2001, 2002) is used to describe the contribution of IT to productivity or productive efficiency. We follow Dewan and Kraemer (2000) for two reasons. First, our focal point for an international comparison is similar to theirs. Second, the firm-level data of IT capital stock is not available for many other countries. Thus, the country-level variables are used as proxies. In other words, the same ICT proxies apply for banks within a country.
16 Here, the growth rate of the IT capital stock (ITCS) is adopted and calculated as follows:

17 Telecommunications investments have increased rapidly in order to foster progress in IT, caused by the rapid development of the internet and telecommunications. Thus, the growth rate of telecommunications capital investments (COMCI) is used and calculated as follows: Based on the specification of IT and COM, we can examine how new technologies (ICT) influence the performance of financial institutions across nations.

Based on the specification of IT and COM, we can examine how new technologies (ICT) infuence the performance of financial institutions across nations.
18 The data of both ITCS and COMCI are defined as total revenue paid to vendors (including channel markups) for hardware, data communications, software, and services. Hence, these two variables are not seriously impacted by the various accounting methods of capital investments in different countries. Moreover, IT and COM are growth rates of ITCS and COMCI, which reduces the problems of measuring errors caused by different currencies in different countries. And the results based on this data set are comparable across countries. Given that other official data sources are not available, this is the only source of information technology investments data for a large cross-section of countries in the 1990’s.
19 Since it is difficult to quantify what extent to which a country complies its regulations with the Basel Accord, we rely on dummy variable to deal with this problem. The Basel Accord variable B is defined as one if a country joins the Basel Accord, while B is equal to zero if a country does not.
2.2 Cost Efficiency
20 The stochastic frontier analysis is the one-step approach by Wang and Schmidt (2002). The one-step cost efficiency frontier model is applied to pool the cross-section of time-series (i.e., panel) data culled from commercial banks throughout the world to explore the dynamically and stochastically shifting patterns of the cost (in)efficiencies of banks over time.3
21 The one-step model consisting of Equations (1) and (2) to examine the cost efficiency of commercial banks is illustrated as follows:
lnTC it = f(Y it , Ρ it ; β) + Ζ it ϒ + U it + V ti [1]andU it = g (IT it , COM it , B it ; α) + ε it [2]
where
β : the traditional vector of unknown parameters to be estimated,
γ : the vector of unknown parameter to be estimated,
U it : a random variable to account for the truncated normally distributed cost inefficiency at the mean of the g-function,
V it : a random variable to describe the normally distributed disturbance, and
f (⋅): the optimized cost function of a given output vector and input prices.
22 ITit and COMit in the g-function are the ICT variable.4 zit is a set of country-specific control variables. B is the Basel Accord dummy. B=1, when a country joins the Basel Accord, Otherwise, B=0. α is the vector of unknown parameters to be estimated in the inefficiency itu . itε is a truncated random variable (half-normally distributed) to account for the error term of the cost inefficiency. That is,

2.3 Specifications of the Models
23 In Equations (1) and (2) the output vector yit (cf. Lin and Lin, 2005) consists of three output, LNit, TDit, and FIit. Due to the limitation of the availability of data, we are forced to use total deposits rather than demand deposits that have often been used in the related studies.
24 The elements of the input price vector (pit) include wit and rit. Following Allen and Rai (1996), Rai (1996), and Lin and Lin (2005), the wage of labor is obtained by dividing the total staff expenses by the total number of reported employees of a bank. The total staff expenses and total number of reported employees for a given bank are collected from its financial statements. The price of capital is measured by the loan interest rate of the country. In Equation (2), both ITit and COMit are utilized to describe the ICT proxy over time, as mentioned earlier. The cost function in Equation (1) takes a translog form, the most frequently used form of the cost frontier in the banking literature, while the g-function in Equation (2) is assumed to be linear. (cf., e.g., Lin and Lin, 2005).
25 The translog functional Equation (1) can be re-written as follows:

whereY1it = LNit / TAit
Y2it = TDit / TAit
Y3it = Flit / TAit
P1it = Wit / TAit
P2it = rit
26 Based on the model specifications above, we are able to employ the performance measure of cost efficiency to assess the ICT effect and the international supervision across countries.
3. Data Sources and Statistical Hypothesis
27 This section summarizes data sources, and statistics of variables. We also display the statistical hypothesis to be tested.
3.1 Data Sources
28 Our analysis is based on the variables from the financial statements (firm specific and microeconomic variables). Nevertheless, the country-level attributes are introduced to control the overall economic climates for different countries. The observation period ranges from 1993 to 2000. Due to the problem of missing values, unbalanced panel data are used. All data are dated at the end of the year.
29 We categorize variables into two levels: firm-level and country-level. The firm-level variables are based on the financial statements gathered from the World Scope CD.5 A problem arising from the use of international accounting data is that accounting principles used in different countries differ, and there are diverse transformations of different foreign exchange rates. Nevertheless, the World Scope has made efforts to standardize the data. Moreover, by using a broader category of a variable, we alleviate the problems of varying definitions and measurement errors of accounting practices among different countries. Even though our firm-level data do not exhaust all banks in a country, they nonetheless represent a majority of the players of the industries in a country.
30 The country-level data are collected from the International Financial Statistics (IFS) published by the IMF and the World Development Indicator Database compiled by the World Bank. The base year of both data sets for all countries and all variables has been adjusted to the end of 1995. The two data sets that follow a universal format of variables serve as the comparable foundation across countries. In order to conduct cross-national comparisons, all monetary items have been denominated into US dollars.
31 Following Dewan and Kraemer (1998, 2000) and Daveri (2001), the ICT variables (including ITCS and COMCI) are obtained from the International Data Corporation (IDC), a private consulting firm specializing in high-tech industry research. The ITCS variable is defined as the total revenue paid to vendors (including channel markups) for hardware, data communications, software, and services. Since other official data sources are not available, this is the only source of ICT investments data for a large cross-section of countries in the 1990’s.
3.2 Summary of Variables
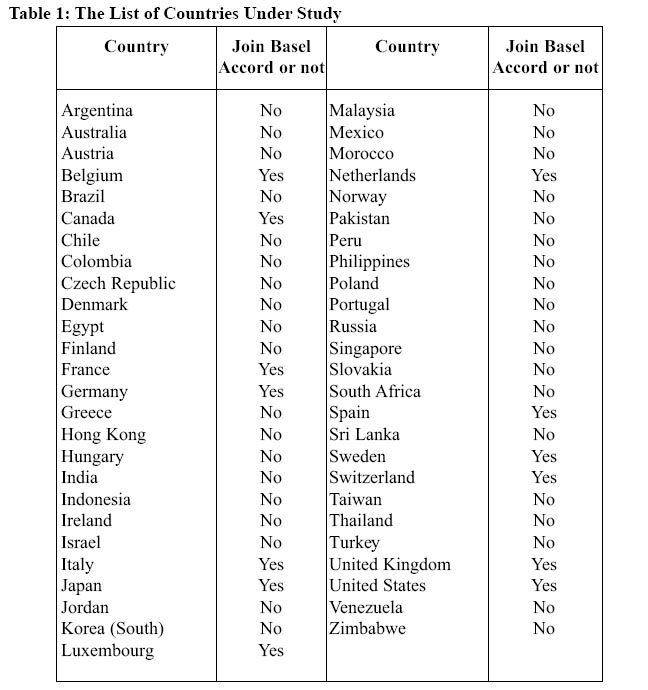
32 The countries under study are listed in Table 1, where Belgium, Canada, France, Germany, Italy, Japan, Luxembourg, the Netherlands, Spain, Sweden, Switzerland, UK and US participate in the Basel Accord, while the other countries are classified as non-Basel countries. The countries joining the Basel Accord are supervised by their domestic regulatory bodies in terms of the required capitals (called Basel I).
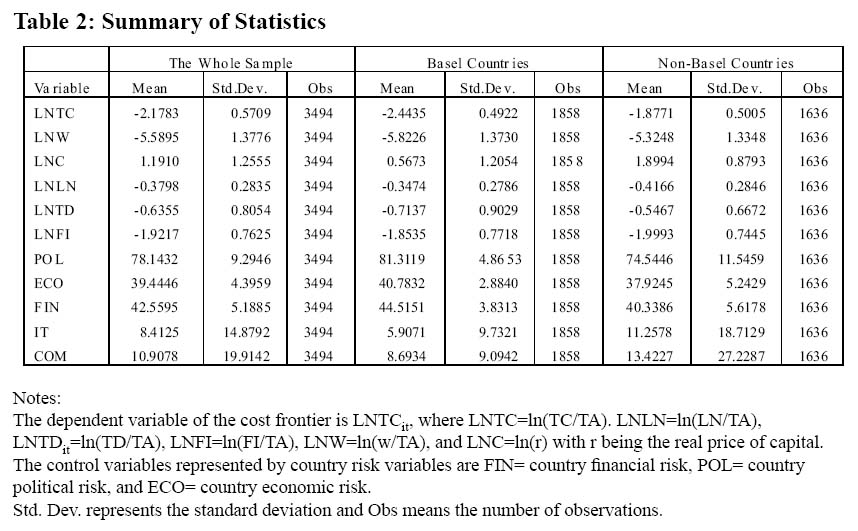
33 Here, for the purpose of comparison, we further split the whole sample into two sub-samples: Basel countries and non-Basel countries. The Basel group consists of thirteen countries and the sub-sample of the non-Basel group is constituted by thirty-eight countries. Table 2 shows statistic summary of the variables in the whole sample and sub-samples.
34 The whole sample contains 3494 observations from 51 countries under study; the sub-sample of Basel countries is composed of 1858 observations; and the sub-sample of non-Basel countries consists of 1636 observations.
35 It is insightful to compare the means of variables in different sub-samples. The comparative total costs of commercial banks (LNTC) in the Basel countries are lower than those in the non-Basel countries (-2.4435 vs. -1.8771). Very obviously, the total costs of the Basel countries must be larger than those of the non-Basel countries in terms of absolute value. Hence, we can conclude that the Basel countries are more cost-saving than the non-Basel countries in the comparative measure. Similarly, LNW of the Basel countries is smaller than that of the non-Basel countries (-5.8226 vs. -5.3248). Moreover, the cost of capital of Basel countries (0.5673) is again smaller than that of the non-Basel countries (1.8994). All these shows that the comparative input prices and total costs of the non-Basel countries are higher than those of the Basel countries.
36 Regarding the means of the three output variables LNLN, LNTD, and LNFI, we find that the Basel countries produce more LNLN and LNFI (-0.3474 vs. -0.4166 and -1.8535 vs. -1.9993, respectively) but less LNTD (-0.7137 vs. -0.5467) than the non-Basel countries in the sample. This outcome shows that commercial banks in the Basel countries are bigger in terms of scale, amounts of loans, and the balances of financial investments (including long-term and short-term) than their counterparts in the non-Basel countries. The Basel countries benefit from sound regulations in banking and freedoms of international capital flows, so their banks are able to make more loans to companies in both Basel and non-Basel countries, which results in the higher LNLN in the Basel countries. They also enjoy a variety of financial instruments that allow their commercial banks to diversify their risks. Thus, the commercial banks in the Basel countries invest more heavily than those in the non-Basel countries. In contrast, people in some developing countries (all of them are non-Basel countries) tend to deposit a majority of their disposable incomes. Thus, the LNTD in the non-Basel countries is larger than that in the Basel countries.
Table 1. The List of Countries Under Study
Display large image of Table 1
Table 2. Summary of Statistics
Display large image of Table 2
37 The means of the three z control variables POL, ECO, and FIN for the Basel countries are unanimously bigger than those for the non-Basel countries (POL: 81.3119 vs.74.5446; ECO: 40.7832 vs. 37.9245; and FIN: 44.5151 vs. 40.3386). This comparison signals that the Basel countries bear lower political, economic, and financial risks than the non-Basel countries.
38 The IT and COM variables for the Basel countries are on average smaller than those for the non-Basel countries (IT: 5.9071 vs. 11.2578 and COM: 8.6934 vs. 13.4227, respectively). Since many non-Basel countries are emerging economies that have enjoyed rapid technological changes in recent years, their ICT investments are larger in terms of growth rates. In addition, the standard deviations of all variables are listed for references.
3.3 Statistical Hypotheses
39 In this study, we are interested in the impact of the international supervision in accordance with the Basel Accord and that of the affect of the ICT investments. Therefore, two hypotheses H1 and H2 are proposed. These two hypotheses are tested on the basis of the two-equation model. These three hypotheses are:
- H1: B (the proxy for the Basel countries) has a positive impact on cost efficiency. (i.e., B is statistically negative in Equation (2).)
- H2: IT investments exert a positive effect on cost efficiency. (i.e., the coefficient of IT is statistically negative in Equation (2).)
- H3: COM investments have a positive impact on cost efficiency. (i.e., the coefficient of COM is statistically negative in Equation (2).)
40 If H1 is not rejected, it is efficient for a country to join the Basel Accord to improve the operations of commercial banking. If H2 is not rejected, the IT investments would lead to the increase in the cost efficiency of the banks in the Basel countries and the non-Basel countries as well. If H3 is not rejected, it is efficient to invest in COM to improve the operation of commercial banks. Moreover, if neither H1, nor H2, nor H3 is rejected for the whole sample, then ICT investments and the international regulations are the essential factors (sources) that improve the cost efficiency.
4. Analysis of Empirical Results
41 This subsection discusses the empirical results of Equations (1) and (2). Table 3 shows estimates of the cost frontiers of the whole sample and two sub-samples and Table 4 demonstrates results of the sub- time periods of years 1997, 1998, and 1999.
Table 3. The Empirical Results of the Cost Frontiers
Display large image of Table 3
4.1 Analysis of the Whole Time Periods
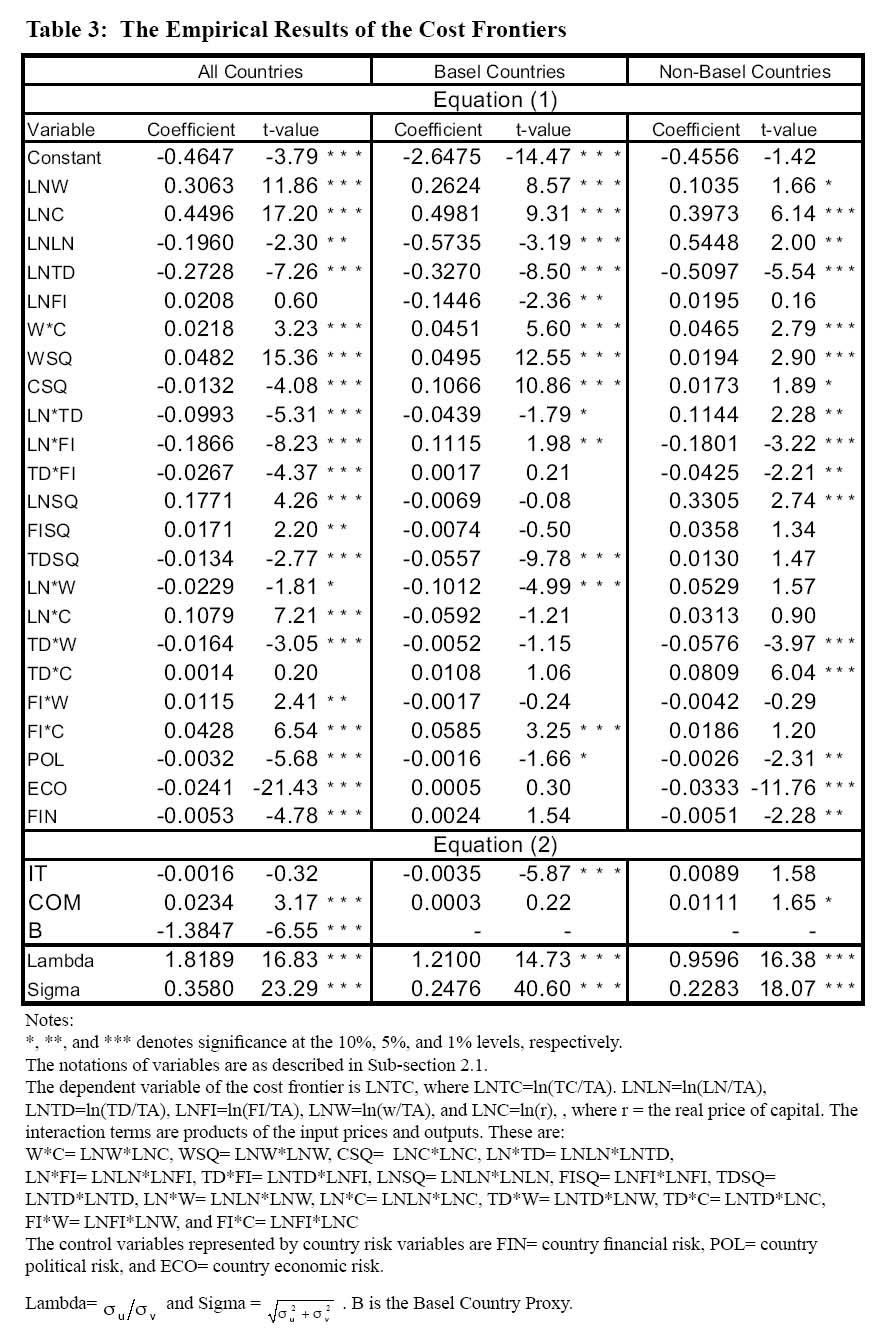
42 According to Table 3, in the whole sample, our empirical result of Equation (1) shows that the input prices LNW and LNC are positively related with the total cost (LNTC) and two outputs (LNLN and LNTD) are negatively linked to LNTC, while the other output variable LNFI is insignificant. The three control variables POL, ECO, and FIN are significantly and negatively associated with LNTC. Since high control variables represent a low risk, our result reveals that the lower risk a country bears, the lower the total cost of banks in that country is.
43 In Equation (2), IT reduces the cost inefficiency itu but the impact is insignificant. Nevertheless, COM strongly contributes to the cost inefficiency significantly at the 1% level. Moreover, the Basel Accord proxy B is significantly and negatively related to the cost inefficiency, implying that the international regulations improve on the cost efficiency of the banks in the sample countries. The absolute value of the coefficient of B is larger than that of COM (-1.3847 vs. 0.0234) and its absolute t-value is also larger (-6.55 vs. 3.17). This outcome signals that the telecommunications investments seriously deteriorate the cost efficiency of the banks in the countries under study, and the both the IT and the Basel Accord proxy B are more important factors in improving the cost efficiency of commercial banks than COM. That is, H1 is not rejected in the whole sample.
44 We further divide the whole sample into two sub-samples: Basel countries and non-Basel countries and concentrate on the results of Equation (2). Interestingly, it is observed that IT mitigates the cost inefficiency of commercial banks in the sub-sample of the Basel countries, while the impact of COM on the cost inefficiency stays insignificant. That is, H2 of IT is not rejected but H3 of COM is rejected for the sub-sample of the Basel countries. In the sub-sample of the non-Basel countries, IT does not exert a significant impact on the cost inefficiency and the effect caused by COM is significant only at the 10% level. In other words, H2 of IT and H3 of COM are rejected for the non-Basel countries.
45 This outcome signals that 1) commercial banks in the non-Basel countries cannot align the ICT investments with their operations; 2) IT investments alone, but COM investments alone do not, enhance the cost efficiency of commercial banks; and 3) the COM investments are capital-using for the whole sample and the sub-sample of the non-Basel countries, and they seem indifferent toward the cost efficiency for the sub-sample of the Basel countries. Without good supervisory regulations, the commercial banks in a country cannot outperform their counterparts by using the COM investments. In other words, IT investments help banks save cost only when appropriate regulations and standards are well-established.
46 In addition, we have investigated the lag effect of ICT investments on the cost efficiency but the impact stays insignificant. Therefore, the results are not shown here. The empirical results related to the lag effects of IT and COM are available upon request.
4.2 Analysis of Years 1997, 1998 and 1999
Table 4. The Empirical Results of the Cost Frontiers for Years 1997, 1998 and 1999
Display large image of Table 4
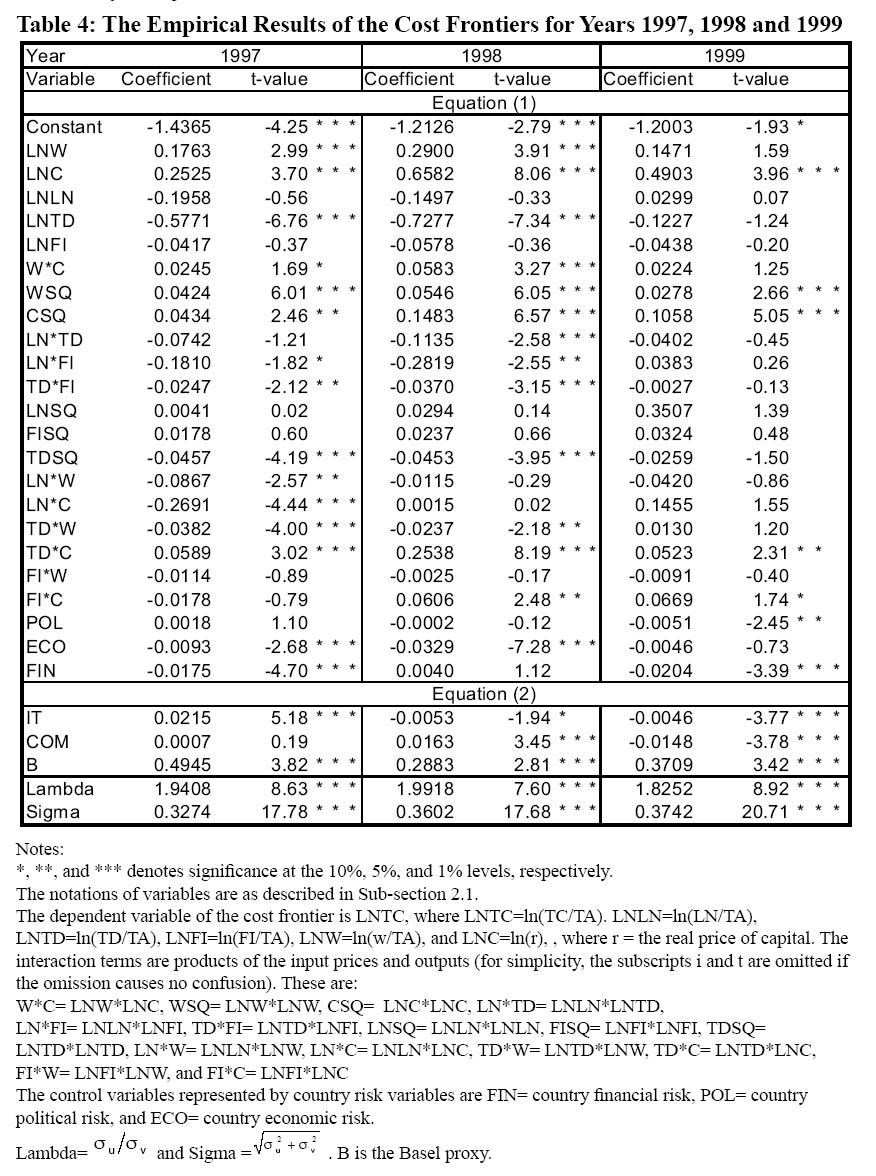
47 It is insightful to analyze the empirical results of sub-periods. By doing so, we can depict the time-varying patterns of the cost efficiency for different years. Unfortunately, the empirical results of the stochastic frontiers for 1993, 1994, 1995, 1996, and 2000 are not obtainable due to the wrong skewness of the dependent variable. Therefore, the results for these years are not shown here.
48 In Table 4, we find that the input price variables LNC and LNW are positively related to the LNTC for 1997, 1998 and 1999. Therefore, the input prices contribute positively to the total costs. Two output variables LNTD and LNFI are negatively related to the total costs for 1997, 1998 and 1999 while LNLN is negatively related to LNTC for 1997 and 1998 but positively related to LNTC in 1999. In addition, the results of the z variables of country risks vary from year to year.
49 The results of ICT (IT and COM) investments and the Basel proxy from Equation (2) are our focal point. We find that IT is positively linked to the cost inefficiency for 1997 but negatively and significantly associated with the cost inefficiency for 1998 (at the 10% significance level) and 1999 (at the 1% significance level). These estimates over time suggest that the IT investments tend to contribute to the cost efficiency of commercial banks more and more deeply as time goes by. The COM variable remains insignificant for 1997 and positively related to the cost inefficiency for 1998. However, it mitigates the cost inefficiency (i.e., enhances the cost efficiency) for 1999. Consequently, COM tends to reduce the cost efficiency for 1998 but improve it for 1999. In other words, the changing pattern of the effect of COM on the cost efficiency is shifting favorably through time.
50 Moreover, the estimated coefficients of the Basel proxy B indicate that the international supervision on commercial banks unanimously increases the cost inefficiency significantly at the 1% level for all the three sub-periods, 1997, 1998, and 1999. This evidence reveals the fact that it is capital-using for a bank to align its operations with the international Basel Accord for each year, though it is beneficial to banks in the long run (i.e., the observation periods are longer than one year) as shown in Table 3.
5. Conclusions
51 This article has explored the impacts of the ICT (IT and COM) investments on the cost efficiency of commercial banks for 51 nations including both countries joining the Basel Accord and the other economies. In the analysis via the stochastic frontier approach, we have found that IT investments are significant in improving the cost efficiency of the banks in the countries in the Basel Accord. COM investments tend to affect the cost efficiency negatively, particularly for the whole sample combining the Basel and the non-Basel countries. Furthermore, the analysis for the three sub-periods has indicated that participating in the Basel Accord is capital-using in the short run (i.e., in the cross-sectional analysis) but cost-saving in the long run (i.e., in the whole panel data set). In addition, the impacts of the ICT investments on the cost efficiency become stronger and stronger from 1997 to 1999. In other words, the time-varying patterns of the effects of IT and COM upon the cost efficiency are favourable.
52 Obviously, our analysis contributes to technology policy and management, international e-banking, and international supervisions in banking. We have found that IT investments, instead of the telecommunications investments, of a country are important source of the cost efficiency of commercial banks. Moreover, this study provides a strategic implication for the international banking market. Once the deregulation across countries takes place, financial institutions facilitated with IT investments in highly efficient countries would invade the banking markets in the countries with low IT investments and cost efficiencies. On the other hand, the banks in the non-Basel countries can adopt successful e-banking models and international supervisions to leapfrog over their counterparts in the Basel countries.
53 Given this research project, there are some possible extensions. First, the new Basel Accord (usually called Basel II), which will be implemented, calls for the three-pillar regulations. Therefore, an extended new analysis is needed in exploring the impact of the new Basel Accord. Second, different ownership structures of financial institutions such as public-owned and private-owned may be considered in the field of international e-banking. Third, commercial banks in several countries (e.g., U.S.) have started to sell life insurance policies to clients. Consequently, the boundary between the banking and insurance industries is becoming blurred. New research on this new wave of conglomerates of financial institutions is necessary. And fourth, an in-depth discussion on how ICT investments under the new Basel Accord improve the cost efficiency of banks is imperative. It is not satisfactory to find out that the countries in the Basel Accord outperform others in the cost efficiency of commercial banking. We want to know the details of the procedure of adopting new technologies and supervisions to improve cost efficiency.
54 All in all, the ultimate goal of the ICT investments is to maximize a firm’s market value of stocks through the improvement of cost efficiency. Consequently, it is important to investigate how ICT investments are linked to the profit and stock prices of a firm at the microeconomic level and to the GDP of a country at the macroeconomic level in future research. These interesting empirical problems await future efforts to solve them. The solution to these problems will further enrich and benefit the practice of international banking.
55 In closing, the present study has made multifold contributions to the literature of finance and banking: theoretically sound, methodologically correct, and empirically rich.
Appendix: Definitions of Three Country Risk Indicators
56 The political risk rating (POL) measures the political stability of a country. It is composed of 12 components: government stability, socioeconomic conditions, investment profile, internal conflict, external conflict, corruption, military in politics, religion in politics, law and order, ethnic tensions, democratic accountability, and bureaucracy quality. The economic risk (ECO) components include GDP per Head, Real GDP Growth, Annual Inflation Rate, Budget Balance as a Percentage of GDP, and Current Account as a percentage of GDP. The financial risk index (FIN) is rated by the Percentage of Foreign Debt to GDP, Foreign Debt Service as a Percentage of Exports of Goods and Services, Current Account as a Percentage of Exports of Goods and Services, Net International Liquidity as Months of Import Cover, and Exchange Rate Stability. For these three indicators, the higher rating means lower risk.
References
Allen, L. and Rai, A. (1996). Operational Efficiency in Banking: An international Comparison. Journal of Banking and Finance 20:655-672.
Berger, A. N. and Mester, L. J., (1999). What Explain the Dramatic Changes in Cost and Profit Performance of the U.S. Banking Industry? Working Paper 1999-13, Federal Reserved Bank.
Chen, Y. H., and Lin, W. T. (1994). Political Risk and Adjusted Present Value. International Journal of Systems Science 25:2207-2220.
Daveri, Francesco. (2001). Information Technology and Growth in Europe. Working Paper, University of Parma, and Innocenzo Gasparini Institute for Economic Research IGIER).
Dewan, S. and Kraemer, K. L. (1998). International Dimension of the Productivity Paradox. Communications of the ACM, 41:56-62.
Dewan, S. and Kraemer, K. L. (2000). Information Technology and Productivity: Evidence from Country-Level Data. Management Science, 46:548-562.
Hitt, L.M. and Brynjolfsson, E. (1996). Productivity, Business Profitability, and Consumer Surplus: Three Different Measures of Information Technology Value. MIS Quarterly, 20:121-142.
Hunter, W. C. and Timme, S. G. (1991). Technological Change in Large U S. Commercial Banks. Journal of Business, 64:339-362.
Lin, W. T. and Shao, B. B. M. (2000). Relative Sizes of Information Technology Investments and Productive Efficiency: Their Linkage and Empirical Evidence.Journal of the Association for Information Systems, 1, Article 7, pp. 1-35.
Lin, W.T. and Lin, H. J. (2005). The Cost and Profit Efficiencies and Scope Economies of Commercial Banks with Evidence from Taiwan and China. under the 3rd review by the International Review of Finance.
Nieto, M. (2001). Reflections on the Regulatory Approach to E-finance. BIS Papers, No 7, part 10.
PRS Group Inc. (2001). International Country Risk Guide, East Syracuse, New York.
Rai, A. (1996). Cost Efficiency of International Insurance Firms. Journal of Financial Services Research, 10:213-233.
Shao, B. B. M., and Lin, W. T. (2000). Examining the Determinants of Productive Efficiency with IT as a Production Factor. Journal of Computer Information Systems, 41: 25-30.
Shao, B. B. M., and Lin, W. T. (2001). Measuring the Value of Information Technology in Technical Efficiency with Stochastic Production Frontiers. Information and Software Technology, 43: 447-456.
Shao, B.B.M. and Lin, W. T. (2002). Technical Efficiency Analysis of Information Technology Investments: A Two-Stage Empirical Investigation. Information & Management, 39: 391-401.
Wang, H. J. and Schmidt, P. (2002). One-Step and Two-Step Estimation of the Effects of Exogenous Variables on Technical Efficiency Levels. Journal of Productivity Analysis, 18: 129-144.
Endnotes