Growth and Persistence of Large Business Groups in India
J. Dennis RajakumarICFAI Business School, India
John S. Henley
The University of Edinburgh, UK
The international business literature is belatedly recognizing the significance of large family-controlled business groups in emerging markets. Most research has focused on analyzing the impact of concentrations of private wealth on economic development in home countries using panel data. This paper examines the growth and persistence of business groups since 1951 in one country – India. Since Independence, the government has attempted to operate an economic policy framework that had, amongst its prime objectives, the curbing of the tendency of business groups to concentrate economic power. As their growth was seen as synonymous with concentration of wealth, business groups became obvious candidates for regulation. Various policy instruments were introduced, such as the Industries (Development and Regulation) (IDR) Act 1951 and the Monopolies and Restrictive Trade Practices (MRTP) Act 1969, with the aim of erecting barriers to their growth. In 1991, economic reform ushered in the removal of the legislative barriers to business group growth. The analysis in this paper concludes that large business groups expanded their share of wealth between 1951 and 1969, but this growth was arrested between 1970 and 1990, and since 1991, it has dwindled. The pre-eminent position of Tata and Birla, as the two largest business groups, remained unchallenged from 1951 until the emergence of the Reliance Group in the late 1990s. However, there has been frequent change in the relative positions of other groups in and out of the Top-20. After economic liberalisation accelerated from 1991, there was significant change in the ranks of business groups in the Top-20. Existing smaller groups or newly emerging groups, particularly in the IT and telecommunications sectors, have replaced many of the previously dominant older groups. This is interpreted as indicating the central role of entrepreneurship in combination with technological innovation, and the opening up of the Indian economy to international competition, in disturbing established business hierarchies in India. More generally, policy intervention appears to have been less effective in breaking up concentrations of economic power in India than economic liberalization and increased competition.
Introduction
1 The presence of large business groups in emerging markets has stimulate considerable interest in whether their performance has a positive or negative effect on the host countries’ general economic performance. Fogel (2006), for example, finds that greater oligarchic family control over large corporations is associated with worse economic outcomes, interventionist governments and underdeveloped market institutions in a group of 41 countries including India. Khanna and Palepu (2000) and Khanna and Rivkin (2001) suggest, by contrast, that oligarchic family groups operate efficiently by creating their own internal capital and managerial talent markets, functioning largely independently of the institutional environment characterised by bureaucracy, ‘red tapeism’ and market failure. This, of course, neatly sidesteps the issue of the direction of causality and the extent to which large business groups through the process of internalising capital and labour markets undermine the weak and inefficient institutional structures of the wider society. It seems implausible that large family-controlled business groups will not at times use their economic power to protect or enhance their positions. Even if this is not true, Morck and Yeung (2004) argue that large firms have significant scale advantages in dealing with government. Certainly reducing or eliminating this size advantage is one of the key drivers behind the World Bank’s campaign to improve investment climates in all countries and for all sizes of firms (World Bank, 2006 & 2007).
2 From the beginning, the founders of modern India were concerned to ensure that the economic system did not concentrate wealth. These concerns are enshrined in the Constitution of India which places an obligation on the government of the day to control the concentration of wealth and, by implication, the growth of large business groups.1
3 In newly independent India, in the early 1950s, it was feared that the accelerated growth being predicted by economic planners would further concentrate economic power. Curbing any such tendency became an integral part of formal economic policy. All firms in India were required to operate in a tightly controlled and regulated policy environment, exemplified by a complex licensing regime, or ‘license raj’, the disparaging name it was popularly known by. This obliged firms to seek prior permission to issue capital, to raise money from financial institutions and to obtain foreign exchange. A high tariff regime was imposed on imported capital goods and raw materials.
4 The effectiveness of government controls as a means for checking the accumulation of wealth attracted a wide debate, even among policy makers (GOI, 1965, pp. 3-10). The Schumpetarian (1934) argument that economic growth requires constant rejuvenation through the destruction of the old and the creation of new firms with new technologies was not part of the dominant orthodoxy of the day. Nor was the idea that the removal of controls would facilitate the emergence of new entrepreneurs and lead to a diminution of concentration accepted in official circles. Only in the early 1990s and after a severe financial crisis, did decontrolling economic activity become central to economic policies. Since then, the Government has initiated wide-scale removal of controls and taken steps to reduce the regulatory burden on business. Competition has been increased in the domestic market by progressively removing equity caps on foreign direct investment (FDI) and reducing tariffs on imported goods.
5 This paper examines the growth and persistence of large business groups in India under different policy regimes.2 The growth of business groups is analyzed in terms of the increase or decrease in their share of four macroeconomic variables. These variables are chosen to represent different ways of measuring concentration.
6 The paper is divided into two parts. Part One identifies the various phases through which the policy regime to control the growth of business groups has evolved between 1951 and 2001. The growth of business groups is then mapped across changes in the policy regime. In Part Two, the persistence of large business groups is examined. The paper ends with some concluding remarks.
Part One
Growth of Business Groups, 1951 to 2001:
7 For four decades from 1950, the growth of business groups was regulated by two principal legislative instruments: the Industries (Development & Regulation) (IDR), Act, 1951 and the Monopolies and Restrictive Trade Practices (MRTP) Act, 1969. The IDR Act sought to prevent the concentration of wealth through a comprehensive system of licensing. The MRTP Act was designed to regulate the growth of assets and market power of business groups. Periodic amendments were made to the IDR Act and the MRTP Act was revised in 1982 and 1984.
8 As part of the economic reforms introduced after 1991, industries were de-licensed and the threshold limit on assets was repealed. These changes, together with relaxation of controls over capital and credit markets, and easing of sector-related policies, have removed all major policy barriers specifically targeted at large business houses. In effect, the government switched to relying on the forces of competition to satisfy their obligations under the Constitution to limit concentrations of wealth.
9 From 1951, three distinct policy regimes regulating business groups can be distinguished:
- Phase 1: From 1951 to 1969: Regulation through licensing under the IDR Act
- Phase 2: From 1970 to 1991: Regulation through a combination of licensing and the MRTP Act
- Phase 3: After 1991: Enhancement of market efficiency through de-regulation and progressive tariff reductions.
Growth of Business Groups Phase 1: 1951 – 1969
10 This phase covers India’s first three Five-year plans and three successive Annual plans. Development strategy during this period was designed to achieve higher economic growth, complimented by legislation to prevent concentration of wealth. The IDR Act, 1951, empowered the central government to reserve industries of national importance for the public sector. In other industries, where private firms could participate, the Act required firms to obtain a license to establish any new undertaking and seek prior permission to produce any new line or undertake any substantial expansion programme (Shaw, 1971). Two other important pieces of legislation that sought to reduce concentration of economic power were the Capital Issues (Control) Act, 1947, which was intended to ensure wide dispersal of share ownership, and the Indian Companies Act, 1956, which restricted inter-corporate investment and directorships.
11 In order to evaluate whether such policies were effective in curtailing the concentration of wealth, the Government constituted four important committees in the 1960s.3 Unfortunately, the committees defined business groups in different ways and used different parameters to measure concentration levels so making comparisons between the committees’ findings is difficult.
12 The Monopolies Inquiry Commission (MIC) classified a company as being part of a business group, if the group had a controlling equity stake of 50 per cent or more (GOI, 1965, p.33). The MIC, using an assets threshold of Rs. 5 crore4 or more, identified 75 groups (controlling a total of 1536 companies) in 1964 which it defined as ‘large business groups’.
13 In contrast, Hazari (1967, pp. 5-7) argued that a business group could be represented by ‘a series of concentric circles’ and so allocated group companies between in inner and outer circles. Units assigned to the inner circle had decision-making powers. Those in the outer circle were companies where the group had ‘fifty-fifty or minority equity participation’. Hazari identified 20 business groups which he referred to as complexes, but did not classify any group as large.
14 The Dutt Committee used the criterion of one-third or more of effective equity, defined as, ‘total equity capital minus holdings by the State-sponsored financial institutions, Governments, and Non-Resident Indians’ to identify large business group-controlled companies (GOI, 1969, pp. 4-15). The Committee then set a threshold of assets worth over Rs. 35 crore to identify 73 large business groups operating in 1966.
15 Hazari (1967) estimated the relative share of Indian business groups by total paid-up capital, net fixed assets, net fixed capital stock and gross capital stock, while the MIC (1965) used paid-up capital and total assets to classify large business groups. The findings of these studies are summarised in Table 1.
16 As can be seen from Table 1, the share of the top 20 business groups in private corporate assets increased during the 1950s. While the share of assets reported for the 1960s is not strictly comparable with that of the 1950s due to differences in definitions and variables used, there is again a discernible increase in the relative share of business groups.5 This was widely attributed to ineffective policy implementation. For example, the MIC observed that controls actually helped existing large firms by restricting the entry of new firms.
Table 1. Share of business groups in private corporate assets in India, 1951-1968
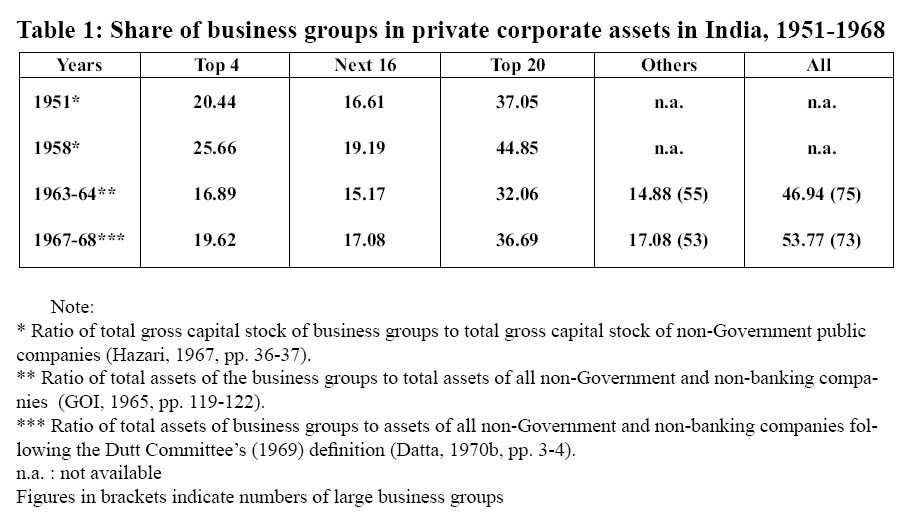
Display large image of Table 1
17 Smaller and newer firms, because they had fewer assets of their own, were normally exposed to the full rigour of the licensing regime if they wished to undertake a new venture. Large business groups, by contrast, usually had the required financial reserves or in-house capacity to raise finance for new activities. They received preferential treatment from the licensing authorities and foreign collaborators were typically eager to participate with them in joint ventures. The Dutt Committee concluded, "Not only was no attempt made to use licensing to prevent the further growth of the Larger Industrial Houses, but the process actually worked in their favour" (GOI, 1969, p. 183). The analysis behind this conclusion was influential in framing the MRPT Act 1969.
Growth of Business Groups Phase 2: 1970 – 1991
18 This second phase of the analysis covers the period from the fourth to the seventh Five-year plan. During this period, the scope of legislation designed to curb the increasing concentration of private assets in large business houses was extended significantly by the passage of the Monopolies and Restrictive Trade Practices Act 1969.6 The license raj was also continued through the IDR Act.
19 The MRTP Act legislation used both asset and control criteria to classify large business groups. It covered undertakings whose assets individually or together with the assets of its interconnected undertakings, amounted to Rs. 20 crore or more. This limit was raised from Rs. 20 crore to Rs. 100 crore in 1985.7
20 The analysis below is based on information reported by the Monopolies Research Unit (MRU) in Company News and Notes. The MRU reported the assets of business houses, the paid-up capital, turnover and profit before tax (PBT) on a regular basis from 1971 until it was discontinued in 2003 with the abolition of the Department of Company Affairs.The MRTP Act’s definition of a Large Business House (LBH) is followed in the analysis.
21 In order to work out the share of different groupings of business houses in the three variables reported by the MRU, their respective population estimates were derived using the Reserve Bank of India’s (RBI) studies of the finances of both public and private limited companies. The RBI statistics are based on a sample of companies and so the sample results have to be extrapolated to arrive at aggregate values. Population figures for paid-up capital alone are available and so the ratio of ‘total paid-up capital of non-Government companies’ to the ‘paid-up capital of sample companies’ is used for extrapolation. A linear relationship is assumed to exist between the paid-up capital and the extrapolated variables.8 Table 2 presents the relative share of large business groups in total assets, turnover, and profit before tax (PBT) of the corporate sector.
22 As noted above, the asset floor defining a large business house was raised from Rs. 20 crore to Rs. 100 crore in 1985. This led to the de-registering of many undertakings that belonged to business houses. Sinha et al. (1990, Table 1, p. 2) estimate that as many as 309 undertakings were de-registered in 1985, following the raising of asset limits. It also resulted in a sharp fall in the number of large business groups covered by the MRU, from 157 to 61 between 1984 and 1985.
23 From Table 2 and Figure 1, two broad features can be observed. First, between 1972 and 1984, the share of the Top-20 large business houses in corporate India’s total assets declined, while that of other large business groups increased, particularly in the second half of the 1970s. Second, between 1985 and 1989, the share of large business group assets in total assets of the whole corporate sector declined. This suggests that policy measures succeeded in slowing the growth of large business groups between 1972 and 1989.
Figure 1. Share of Top 20 business groups in total assets of corporate sector in India, 1972-1989
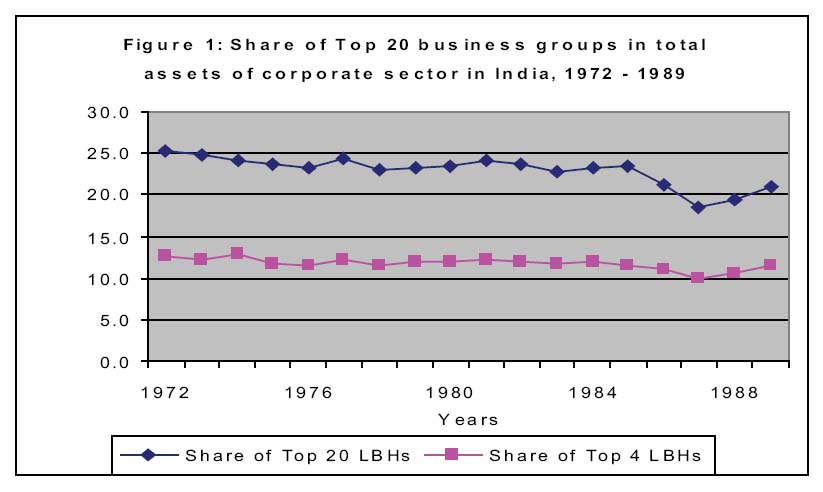
Display large image of Figure 1
Table 2. Share of business groups in assets, turnover and profits before tax of the private corporate sector in India, 1972-1989

Display large image of Table 2
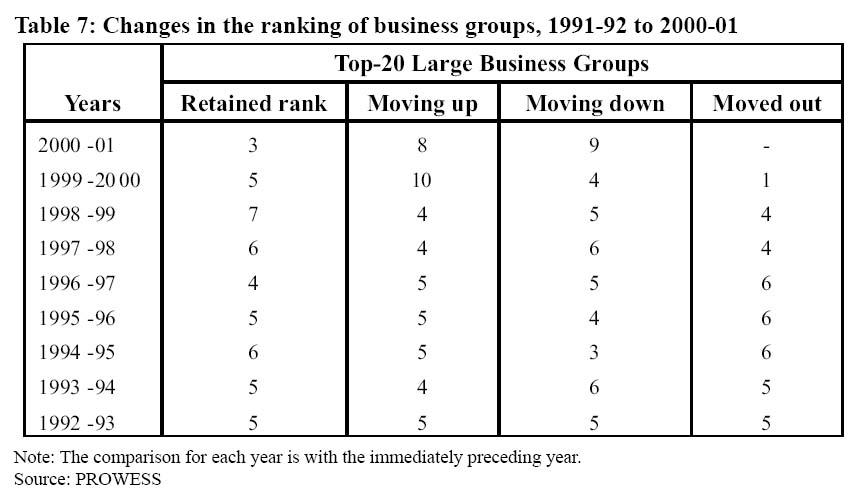
24 The share of the Top-4 business groups in turnover was approximately the same as that of their share in assets, while the next 16 and other large business groups had a proportionately higher share in turnover relative to their assets. This suggests that new entrants into the ranks of large business groups were either entering into new areas of economic activity with associated higher turnover per rupee of assets or reflects more efficient use of assets. However, an examination of trends in share of profits before tax (PBT) indicates that the Top-4 were able to increase the share of their operations in the PBT of corporate India. By contrast, large business houses outside the Top-20 suffered a significant reduction in their share in PBT, even though the number of large business houses above the Rs. 100 crore asset threshold, had increased from 47 to 58 between 1985 and 1989.
25 In summary, the evidence suggests that, while policy instruments may have facilitated the emergence of new large business houses, their operations had a limited impact on the profitability of the Top-20. Indeed, the Top-4 appear to have increased their share of the total profits of corporate India between 1985 and 1989, although they lost out significantly between 1976 and 1981 to new comers.
Growth of Business Groups Phase 3: After 1990
26 The year 1991 was a watershed in the history of the corporate sector in India. There was a decisive break in the underlying political philosophy behind the macroeconomic management of India and the associated microeconomic policy instruments, from state intervention towards economic liberalization. Reform measures, introduced from 1991, removed a large number of regulatory hurdles in order to increase competition in the domestic economy. As part of these policy changes, the MRTP Act was amended in 1991, abolishing the asset limits on its scope. Regulation of market dominance and abuse of market power was extended to the operations of all firms.
27 This section of the paper relies on data extracted from the PROWESS database developed by the Centre for Monitoring the Indian Economy (CMIE). PROWESS contains comprehensive information on firms, including coverage of all known affiliates of business groups.9 The CMIE follows a rigorous procedure in identifying an operating unit associated with a particular business group, relying either on publicly available information or accounts of management structures as described in company annual reports. In this study, after careful scrutiny of the companies identified as belonging to each business group in PROWESS, steps were taken to cross-reference firm membership with each major business group, to make sure the data-set used in the analysis contained all major units of each business group. The CMIE’s data-set was found to be reliable in terms of completeness over the time period from 1991-92 to 2000-01.10
28 Though a wide range of company information is available in PROWESS, three variables were selected for the analysis – gross value added, net fixed capital stock and market capitalization – for which aggregate estimates are available from official publications. Gross value added11 was chosen as a measure of income and is comparable with that of gross domestic product (GDP) as reported in the National Accounts Statistics (NAS).
29 Net fixed assets were re-valued at company level. To arrive at the total value for a business group, the assets of group companies were added together. On examination of the year of incorporation, unsurprisingly, it was noted that group companies were of differing vintages and so net fixed capital stock had to be estimated at the operating unit level. First capital stock was estimated for a chosen base year, 1999-200012 and then, using the perpetual inventory method. Such an exercise requires a revaluation factor (Rf) for each base year. To calculate this factor, the methodology of Srivastava (1996) was followed. It is given by

30 Net fixed capital formation was considered as a measure of capital formation and the implicit deflator as the price of capital (Base Year 1993/4 = 100). Following the Raj Committee (GOI, 1982: Table VII-1, p. 114), 20 years was considered as the average age of net fixed assets. The population net fixed capital stock was that of joint stock companies as reported in the NAS.
31 Market capitalization was worked out by multiplying ‘closing price of shares’ by ‘number of shares in issue’ as on the last trading day of the financial year, which is March 31 of every year. Aggregate market capitalization was the total capitalization of all companies listed on the Bombay Stock Exchange (BSE).
32 From Table 3, it can be seen that the relative share of gross value added of the Top-50 business groups in GDP has increased by about a third of a percentage point. While there was a rise in the share of gross value added to a peak in 1995-6 of 4.10 per cent of GDP at factor cost, this share has declined steadily since then. Over the decade, the overall rise in share has been accounted for by the Top-4 business groups, whereas that of the remaining 46 groups has shown a decline, particularly since 1996-97.
33 Against a background of the Indian economy expanding at nearly 6 per cent per annum, the Top-50 business groups’ share of net fixed capital stock has declined over the years from 73.7 per cent in 1992 to 41.6 per cent in 2001. Although the Top-4 business groups’ share has declined sharply from 39.5 per cent in 1992 to 23.1 per cent in 2001, they have actually managed to slightly increase their share of the diminished share of the Top-50 business groups. This is because there has been a dramatic near halving of the shares of the next 16 and the next 30 business groups in the net fixed capital stock of all joint stock companies.
34 As far as the Top-50 large business houses’ share in market capitalization is concerned, there is a clearly discernible rise from 32 per cent in 1997 to nearly 40 per cent in 2001. Closer examination of trends shows that most of the rise in market capitalization can be attributed to the performance of the Top-4, which together account for nearly a quarter of total market capitalization in 2001 up from 17 per cent in 1997.
35 The analysis presented above demonstrates that economic liberalization – the removal of controls and other entry barriers and increasing domestic competition – has been more effective in dispersing economic concentration than microeconomic policy interventions, as embodied in the IDR Act, 1951 and MRTP Act, 1969, however well-intentioned they may have been. The ensuing expansion of the Indian economy, in the 1990s and subsequently, has facilitated the entry and growth of many new enterprises, not belonging to already existing large business houses. There is also evidence that the momentum of the de-concentration process slackened after 1997. The growth in the share of market capitalization of the Top-4 large business houses does give rise to concern, although 1997 to 2001 was a period of considerable turbulence on the Bombay Stock Exchange and so may simply represent a short-term flight to quality in a time of uncertainty.
Table 3. Percentage share of business groups in macroeconomic indicators, 1991-92 to 2000-01
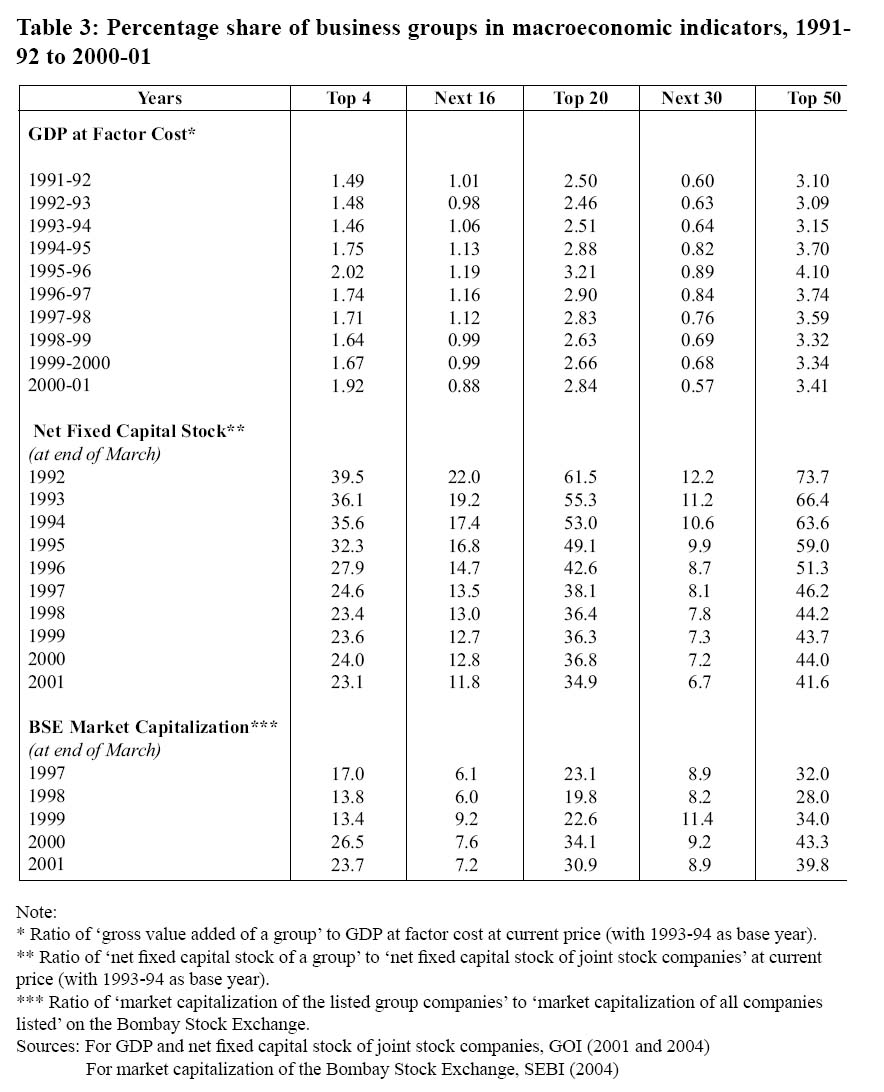
Display large image of Table 3
36 The second part of this paper examines in more detail the movement of large business groups in and out of the Top-50.
Part 2
The Persistence of Large Business Groups:
37 This part of the paper is divided into two sections. The first part covers the period 1951 to 1990, when the government of India was actively engaged in the microeconomic management of the growth of large business houses. The second part covers the period from 1991, when the government abandoned direct controls in favour of liberalization and progressive opening of the Indian economy to international investment and competition.
Trends in Business Group Rankings between 1951 and 1990:
38 The ranking of the Top-20 business groups in selected years from 1951 to 1990 is presented in Table 4. The procedure used to obtain these rankings was first, the Top-20 groups in 1990 were ranked in ascending order. Then, their rank in earlier years was benchmarked backwards until 1951. This exercise was restricted to those business groups that appeared at least once in the Top-20 in any year from 1951 to 1989. All rankings are based on total net assets, except for 1951 and 1958 when gross capital stock was used.
39 Despite the government’s policy interventions to restrict concentration of economic power, it is clear from Table 4 that this did not have the desired impact on the growth of very large business groups. For example, the Tata and Birla Groups maintained their position in the Top-2 all through the period of regulatory intervention. Moreover, J K Singhania, Thapar, and Mafatlal retained their positions in the Top-10 for eighteen years from 1972 to1990. The only major breakthrough into the top rank of Indian business houses was that of the Reliance Group, ranked 67th in 1976, but ranked third after 1986.
40 A less stringent test of the impact of the regulatory framework on the growth of business groups is to examine movements in and out of the Top-20. Here there is more evidence of changes in the ranking of business houses. For example, of the Top-20 in 1951, only eleven groups figure in the Top-20 ranking for 1972 and only nine survive into the Top-20 list of 1990. Furthermore, some of the groups in the Top-20 of 1990, were late entrants, such as MA Chidambaram that entered in 1985, Bajaj in 1979 and Modi in 1976. And, finally, most of the new groups, which entered after 1971, had moved up into the third quartile by 1989, while well-established groups, such as Bangur, Walchand, ACC and Shri Ram were pushed back from the top to the bottom half of the Top-20. Several groups belonging to the Top-20 in the 1950s and 1960s had disappeared from the Top-50 after 1970. Apart from European-controlled groups that were nationalised in the 1970s, notable losers were Indra Singh, Seshasayee, and Shapoorji.
Table 4. The Top-20 large business groups, 1951 to 1990

Display large image of Table 4
41 Table 5 summarises the overall movement of business groups in and out of the Top-20 by comparing movements over a one year time period for various years from 1972 to 1989.
Table 5. Changes in the ranking of business groups, 1972-1989

Display large image of Table 5
42 The data confirms that the proportion of business groups in the Top-20 retaining their rank from one year to the next increases between 1972 and 1989. Conversely more business groups drop out of the Top-20 in the earlier years. This implies that the large business groups were beginning to accumulate sufficient market power and assets to protect their positions of dominance in the Indian economy by the latter half of the 1980s.
Trends in Business Group Rankings after 1990:
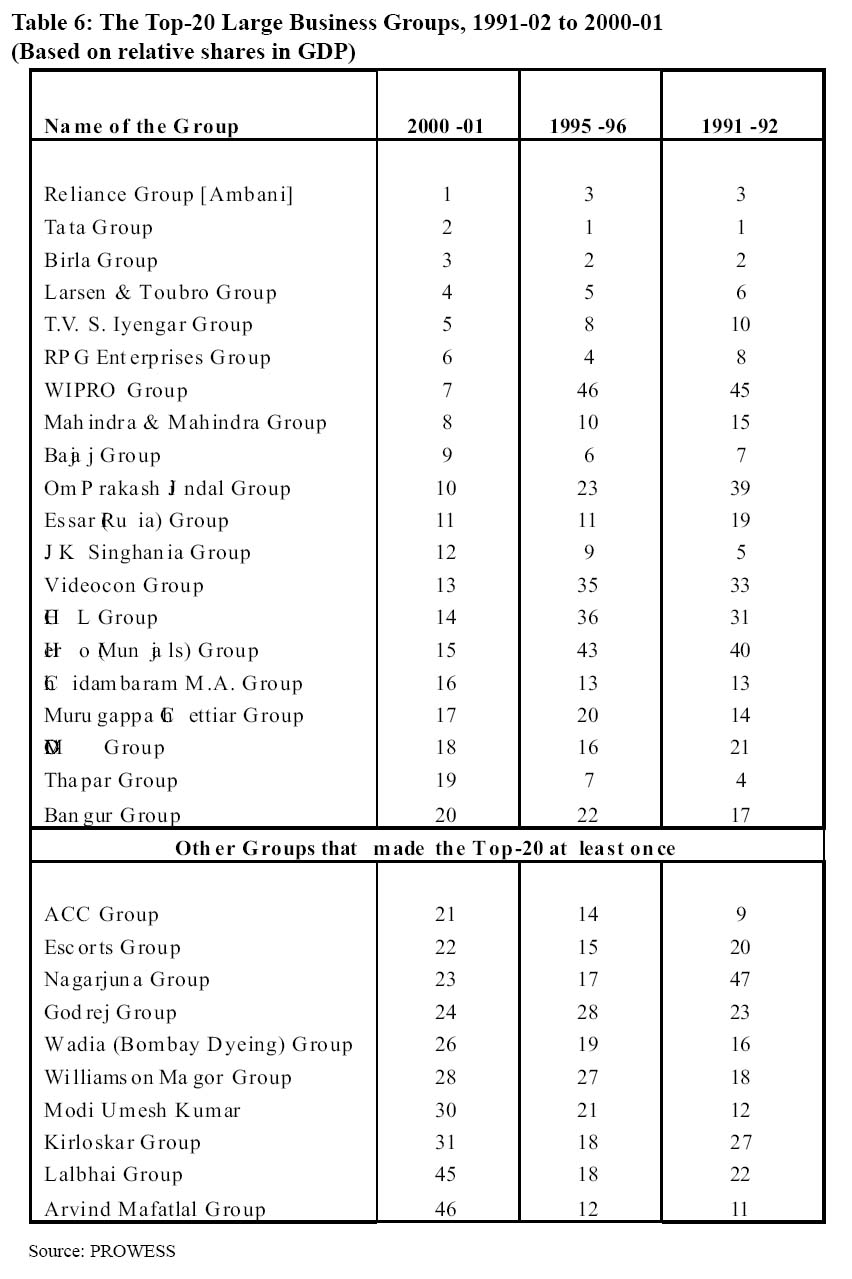
43 Since the mid-1980s, India’s Top-3 business houses have remained Reliance,13 Tata14 and Birla15 (Table 6). However, a major change has been the displacement of the Tata Group from the top position by the Reliance Group (Ambani). Lower down the rankings, six business groups have moved out of the Top-20 between 1991-92 and 2000-01. On a year-on-year basis, there is noticeably greater churn in business groups moving in and out of the Top-20 by comparison with the period 1972 to 1990 (Table 7).16
44 Closer examination of the companies moving into the Top-20 reveals the increasing prominence of groups heavily involved in the new economy, especially software-related businesses and telecommunications. A few of the older groups have moved up the rankings by exploiting new market opportunities. For example, Bajaj, Hero and TVS have all contributed to and benefited from the phenomenal growth in the demand for two wheelers from an increasingly affluent urban population in the 1990s.
45 Many of the business opportunities realised by rising large business groups are in part a product of the easing of controls over sector-related policies, such as, controls on the importation of computer hardware and telecommunications equipment. This relaxation of controls has enabled business groups such as WIPRO and HCL to exploit information technology and to operate in the global market place where demand for software services originates. Other groups, such as Hero and TVS, rely more on domestic demand, while the easing of policies has allowed them to obtain the necessary technology through collaboration agreements with foreign partners, mostly from Japan.
Table 6. The Top-20 Large Business Groups, 1991-02 to 2000-01 (Based on relative shares in GDP)
Display large image of Table 6
Table 7. Changes in the ranking of business groups, 1991-92 to 2000-01
Display large image of Table 7
46 Similarly, the de-reservation of certain strategic sectors like oil exploration and refining, petrochemicals, steel and telecommunications, which used to be the exclusive monopoly of the public sector until 1991, has also helped a few already large business houses to move away from their earlier core businesses and grow even larger. Thus the rapid growth of the Reliance Group, in the 1990s, owes more to its diversification into petroleum refining and petrochemical production than its original core business as a textile house and its bedrock in the 1970s and 1980s.
47 Economic growth stimulated by the reforms introduced after 1991 has also created new business opportunities. As domestic demand has grown, liberalization has encouraged market-seeking foreign investors to form alliances with business groups, thereby changing the profile of associated business groups in India. Though the very large business houses of the ‘old regime’ continue to become stronger, including through investing heavily in the new economy, economic reform has certainly facilitated the growth of new business groups. It has also reduced the relative performance of some of the older groups.
48 The survival, and indeed reconfiguration and expansion, of some of the old business groups testify to the persistence of entrepreneurship in India even in a highly restrictive business climate. Had Indian business groups grown only by deriving benefits from a restrictive and protective policy regime, they would not have survived or flourished in the competitive post-1991 business climate, nor would they be as prominent as they are today. The reform process has opened up new opportunities for growth, which were recognized and exploited by business groups. Entrepreneurship may have been seriously distorted by the license raj regime but it survived. The decline of some previously dominant business groups and the emergence of new ones lend credence to Schumpeter’s remarks on the rise and fall of the entrepreneurial class:
49 "... the entrepreneurial function is not only the vehicle of continual reorganization of the economic system but also the vehicle of continued changes in the elements which comprise the upper strata of society. The successful entrepreneur rises socially, and with him his family, who acquire from the fruits of his success a position not immediately dependent upon personal conduct. This represents the most important factor of rise in the social scale in the capitalist world. Because it proceeds by competitively destroying old businesses and hence the existence of people dependent upon them, there always corresponds to it a process of decline, or loss of caste, or elimination. … This is not only because all individual profits dry up, the competitive mechanism tolerating no permanent surplus values, but rather annihilating them by means of just this stimulus of the striving for profit which is the mechanism’s driving force; but also because in the normal case things so happen that entrepreneurial success embodies itself in the ownership of a business." (Schumpeter, 1934: pp.155-156)
Conclusions
50 This paper has examined the growth of Indian business groups in terms of the increase or decrease in the relative shares of business groups in some important macroeconomic indicators. Paradoxically, it was found that the Top-20 business groups grew between 1951 and 1969, even though the licensing regime was arguably at its most restrictive. However, this growth was arrested during the following period, from 1970 to 1991, when both licensing and controls over assets under the MRTP Act were in force. Since 1991 and the repeal of restrictive legislation, there has been a decline in the growth of some business groups together with consolidation of the position of the Top-3 large business houses – Reliance, Tata and Birla.
51 The paper then evaluated the persistence of business groups by analyzing changes in the ranking of individual groups. After 1991, it was observed that, except for the top three groups, there was considerable churning in the ranking of the remaining Top-20 business groups. A few of the highly ranked groups from before 1991 have survived in the Top-20 in 2000-01 but they do not retain their earlier and higher ranked positions.
52 The growth and decline of large business houses in India appears to be an evolutionary process. Many well-known groups of the 1950s could not survive in the 1960s, and hitherto unranked groups have surged ahead in the 1970s and 1980s. During the 1990s, while the Top-3 very large business groups have increased their market capitalization, new or already existing smaller groups have generally replaced erstwhile dominant groups. An important feature of this evolution is that large business groups together still define the landscape of wealth accumulation in India.
53 Inevitably, this leads to the question of whether such groups contribute towards the concentration of wealth in the economy, as was widely believed at the time of drafting the Indian Constitution. It remains an important question but cannot be answered without systematic analysis of the decision making and governance structures of large business groups which is beyond the scope of this paper.
References
Ahuja, P K. (1986). Corporate sector hnder the purview of the MRTP Act, 1969. Company News & Notes, Vol. XXIV (2), 1-6.
Baskar, M V. (1992). Concentration in Indian Manufacturing Industry, 1970-1990, Unpublished M. Phil Dissertation submitted to Jawaharlal Nehru University, New Delhi, Thiruvanthapuram: Centre for Development Studies.
Chandra, N K. (1981). Monopoly capital, private corporate sector and the Indian economy: a study in relative growth, 1931-1976. In AK Bagchi and N Banerjee (eds.), Change and Choice in Indian Industry. Calcutta: KP Bagchi & Co., 299-381.
Datta, B. (1970a). The monopolies legislation: A measure to prevent concentration of economic power, Company News & Notes, Vol. VIII (1&2), January 1 & 16, pp. 17, 27-31.
Datta, B. (1970b). Growth of industrial houses: a survey for the period 1963-64 to 1967-68, Company News & Notes, Vol. VIII (9&10), May 1 & 16, pp. 1-12.
Fogel, K. (2006). Oligarchic family control, social economic outcomes, and the quality of government, Journal of International Business Studies Vol. 37 (5): 603-622.
Government of India. (1965). Report of the Monopolies Inquiry Commission 1965, New Delhi: Ministry of Finance (Chairman: Shri. KC Das Gupta). Volume I and II: 3-10, 33.
Government of India. (1966). Industrial Planning and Licensing Policy Interim Report to Planning Commission, New Delhi: Planning Commission.
Government of India. (1969). Report of the Industrial Licensing Policy Inquiry Committee (Main Report) New Delhi: Ministry of Industrial Development (Chairman: Shri. Subimal Dutt), pp. 4-15.
Government of India. (1978). Report of the High Powered Expert Committee on Companies Act and MRTP Act, New Delhi: Ministry of Law, Justice, and Company Affairs (DCA).
Government of India. (1979). Report of the Committee on Industrial Licensing, New Delhi: Ministry of Industry.
Government of India. (1982). Capital Formation and Saving in India 1950/51 to 1979/80, Report of The Working Group on Savings, Department of Statistics, Ministry of Planning, New Delhi : Reserve Bank of India.
Government of India. (1985). Report of The Committee to Examine Principles of a Possible Shift from Physical to Financial Controls, New Delhi: Ministry of Finance, Department of Economic Affairs.
Government of India. (1999). New Series on National Accounts Statistics (Base Year 1993-94), New Delhi: Central Statistical Organisation, Ministry of Planning and Programme Implementation.
Government of India. (2001). National Accounts Statistics Back Series 1950-51 - 1992-93, New Delhi: Central Statistical Organisation, Ministry of Statistics and Programme Implementation.
Government of India. (2004). National Accounts Statistics, New Delhi: Central Statistical Organisation, Ministry of Statistics and Programme Implementation.
Goyal, S. K. (1970). The concept and measurement of concentration of economic power, Company News & Notes, Vol. VIII (3&4), February 1 & 16, pp. 1-6.
Hazari, R. K. (1967). The Structure of the Corporate Private Sector: A Study of Concentration, Ownership and Control, London: Asia Publishing House.
Khanna, T., and Palepu, K.G. (2004). The Evolution of Concentrated Ownership in India Broad Patterns and a History of the Indian Software Industry, NBER Working Paper 10613, Cambridge: NBER.
Khanna, T. and Palepu, K. (2000). Is group affiliation profitable in emerging markets? An analysis of diversified Indian business groups, Journal of Finance, 55 (2):867-891.
Khanna, T. and Rivkin, J. (2001). Estimating the performance effects of business groups in emerging markets, Strategic Management Journal, 22 (1):45-74. Morck, R. and Yeung, B. (2004). Family control and the rent-seeking society, Entrepreneurship Theory and Practice, 29 (4): 391-409
Piramal, g. (1 ). Business Maharajas, new Delhi: Penguin Books.
Rajakumar, J. D. (2003). How real are estimates of corporate investment? Economic and Political Weekly, XXXVIII (2) : 2155-2158.
Reserve Bank of India. Reserve Bank of India Bulletin, Bombay: Reserve Bank of India, various issues.
Schumpeter, J. A. (1934). The Theory of Economic Development, Cambridge: Harvard University Press.
Securities and Exchange Board of India. (2004). Handbook of Statistics on the Indian Securities Market, Mumbai: SEBI
Shanta, N. and Rajakumar, J..D. (1999). Corporate statistics: The missing numbers. Journal of Indian School of Political Economy, 11(4) : 655-668.
Shaw, G.A. (1971). Prevention of concentration of economic power and monopolies and restrictive trade practices through corporate laws. Company News & Notes, Special Number, Vol. 9 (1&2), January, pp. 41-48.
Sinha KAD, Behari, R., and Jhangiani, A. (1990). A review of undertaking registered under the MRTP Act, 1969 (As on 30th June, 1990), Company News & Notes, Vol. XXVIII (2), August, pp. 1 7.
Srivastava, V. (1996). Liberalization, Productivity and Competition: A Panel Study of Indian Manufacturing, New Delhi: Oxford University Press.
World Bank. (2007). Doing Business in South Asia 2007, Washington DC: World Bank, February.
World Bank. (2006). Doing Business in 2007—How to Reform. Washington DC: World Bank, September.
Endnotes