Foreign Direct Investment, Real Effective Exchange Rate and China’s Economy
N. LinUniversity of Finance and Economics, China
X. Pan
University of Science and Technology Beijing, China
Changes in China’s Balance of Payment (BOP) reveal that integration between China and the outside world is much closer. On the basis of these BOP changes, this paper examines Foreign Direct Investment (FDI) and Real Effective Exchange Rate (REER) in China because of their importance in economic growth. A number of important issues that may underlay China’s economy imbalance are discussed, and it is suggested that current account surpluses and FDI remain important contributors to the foreign exchange reserve accumulation. Using empirical methodology analysis, the relationships and interactions between FDI, REER and Gross Domestic Product (GDP) in China in the long-run is shown, which yield additional information about implications for the behaviors of REER and FDI in the Chinese economy.
Introduction
1 Over the last ten years, China’s Balance of Payment (BOP) kept its current and capital accounts continuously in surplus. In the first half of 2005, the BOP continued "a double surplus", and the key items of the BOP reflected the past development situation, whose trade scale continued to keep up with the very quick growth. From 1982 to 2004, the annual total scale of the Balance of Payment accounts’ increased by 31.6%, rising to US $1.91 trillion from US $0.054 trillion, which caused the percentage of the BOP by GDP to rise from 19% to 115%. In the first half of 2005, the Balance of Payment traded a total scale of US $1.14 trillion. This is an increase of 25.3% over the year. This shows that China’s openness goes much further, and integration with the outside world is occurring much faster.
2 The market-oriented economy can allocate resources to bring it to the points where they make higher profits, in order to realize the resources’ optimal allocation. In the course of the Chinese market economy’s construction, China’s economy has emerged as a great structure along with the progress of opening policy, which can be reflected in the country’s Balance of Payment structure, and this kind of structural change in turn affects China’s outward economic development. So the changes of China’s BOP structure must be taken into considerations, and related strategies and policies of foreign capital usage should be adjusted.
3 The paper is divided into the following sections. Section II starts with defining the concept of "impossible trinity" in policy making, and then examines the accumulation of China’s international reserves. A key finding is that the current account surpluses and FDI have remained important contributors to reserve accumulation. This section then presents a detailed picture of the Foreign Direct Investment (FDI) in China. China’s capital inflows have generally been dominated by FDI, which constitutes a preferred form of inflows since FDI tends to be stable and associated with other benefits such as transfers of technological and managerial expertise.
4 Section III gives an analysis framework that contains the economic condition for both internal equilibrium and external equilibrium. In this framework, one can select different policy instruments, such as interest rates and foreign exchange rates, to make a policy combination, which can help in adopting measures that would fulfill the specific policy objectives. The relationship between FDI and current account (CA) in China is presented, along with the impact of the exchange rate on FDI and the Balassa-Samuelson effect. Then a detailed description of the Real Effective Exchange Rate (REER) is presented, which will be a very important variable in the analysis of the next section.
5 Section IV shows the data analysis and empirical methodology to testify the relationships and interactions among FDI, REER and GDP in China. In this section, the co-integration test is used as an econometric measure, which can help in finding the implications for the behaviors of REER and FDI in the economy. The co-integration equation between FDI, REER and GDP was not found. Information can be obtained from the impulse response function about the GDP response to the impulse of FDI and REER.
6 Section V concludes this paper.
Policy Allocation Problem and Foreign Direct Investment
Policy Allocation Problem—"Impossible Trinity"
7 With globalization and the integration of economies around the world, capital regulation policies are confronted with more challenges, especially when a centre bank wishes to retain monetary autonomy at a relatively fixed exchange rate regime. The links between exchange rate management, capital mobility, and monetary policy are best expressed in the form of the "impossible trinity" (Figure 1).
Figure 1: Impossible Trinity in the Open Economies

Display large image of Figure 1
8 For most countries, the macroeconomics objective is to achieve internal stability (or economic growth) and external equilibrium in the form of the sustainability of the balance of payment structure. Under capital mobility and the fixed exchange regime, independent money policy is almost the result of the disequilibrium of the BOP, especially with the speculative capital inflows or outflows. If the monetary authorities want to maintain the exchange rates stability, governments may be compelled to limit either the capital movement or their own monetary policies.
9 Under perfect capital mobility the monetary authorities must choose between retaining monetary autonomy and fixing the exchange rate. The logic is that, if the exchange rate is fixed, any exogenous change in domestic credit would create an incipient money market disequilibrium, which would put pressure on the domestic interest rate to derivate from its uncovered-parity level.
10 China’s exchange rate system has evolved over the last half century and has changed at an accelerating speed during the last fifteen years. Before July 21, 2005, China’s exchange regime was tightly managed floating. The fluctuation of the exchange rate between RMB/US$ was only permitted within a 0.3% band, and it was firmly administered to a system wherein the exchange rate was unified and stabilized via a market based managed floating.
11 On July 21, 2005, officials announced that the exchange rate of RMB was determined by a currency basket, which did not only contain the US dollar, but also contained currencies of other countries that had a close trade relationship with China. This means that the real managed floating exchange rate regime was established in China. Although RMB has not yet been a complete convertible currency, especially under the capital account item (with the speed of capital account liberalization being faster), authorities will have much more freedom in dealing with the policies allocation and policy-making problems.
Foreign Direct Investment (FDI) in China
12 Under the condition that RMB has not yet been a completely convertible currency, FDI has a significant weight in the capital and financial account. Foreign Direct Investment (FDI) in China carries a great weight in fixed assets investment in a large total amount, which is not only higher than the developed countries, but also higher than the average level of the new emerging economies. FDI promotes the capital accumulation of China, and also became the capital engine of the Chinese economy. At the same time, there are strong pressures of appreciation of RMB that are due to sustainable strong GDP growth, current account surplus (due to robust export performance), large capital and financial account surplus (due to a large volume of capital inflow), and errors and omissions account surplus (due to strong appreciation expectation, especially the hot money inflow).
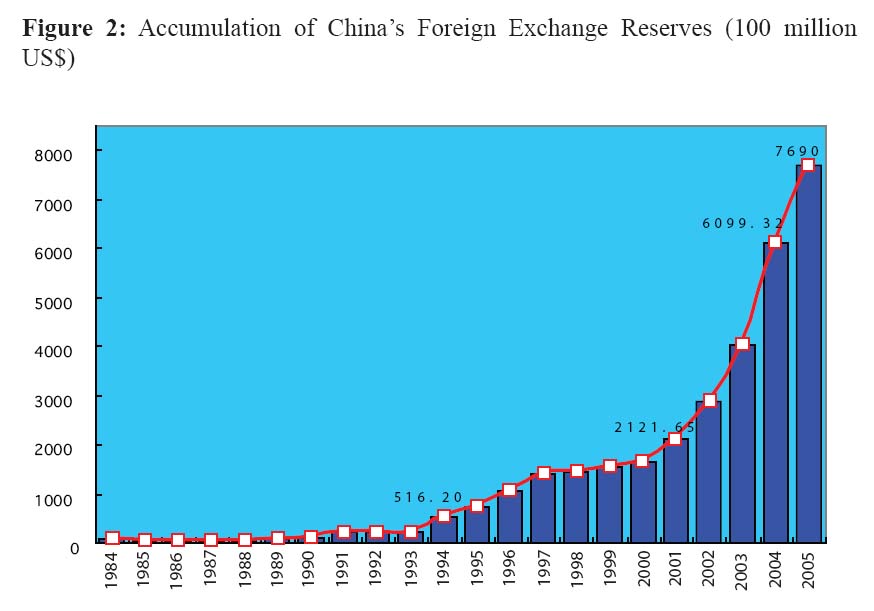
13 After 1997, China’s foreign exchange reserve increased very quickly, and during the years 2003 and 2004, the capital and financial account had a large surplus, from US $52726 million to US $11060 million. At the same time, the foreign exchange reserve increased by US $206681 million (Figure 2). This is simply because of the high expectation of RMB’s appreciation and hot money thronging into China for profits. Of course the "double surplus" of China’s BOP is the basic cause of the very high level of foreign exchange reserve, as one knows that the current account surpluses and FDI have remained important contributors to reserve accumulation.
Figure 2: Accumulation of China’s Foreign Exchange Reserves (100 million US$)
Display large image of Figure 2
14 FDI has made great contributions to the foreign exchange reserve accumulation, as one can see from the capital and financial account item’s surplus in recent years. Besides this, FDI usually has a stabilizing effect on a host country’s economy. FDI most often occurs when multinational firms establish foreign affiliates, whose commitments are often long-term. The potential for long-lasting commitments is what makes FDI a stabilizing influence on a nation’s economy. For many emerging economies, how to attract FDI is a vital policy issue. However, some countries still advocate capital controls on the capital flows. Just as discussed above, under the condition of the "Impossible Trinity", many governments do a lot of interventions to balance the internal or external unbalance of the economy. Controls on the capital inflows may prove to be effective in the short run and slow the pace of short-term inflows.
15 Over the past decade, China has accounted for about one-third of gross FDI flows to all emerging markets, and about 60 percent of these flows to Asian emerging markets. More recently, the weaknesses in the global economy resulted in a slowdown inflows from industrial countries to most emerging markets, China, however, remained an essentially fast growing economy. China’s capital inflows have generally been dominated by FDI, which constitutes a preferred form of inflows since FDI tends to be stable and associated with other benefits such as transfers of technological and managerial expertise.
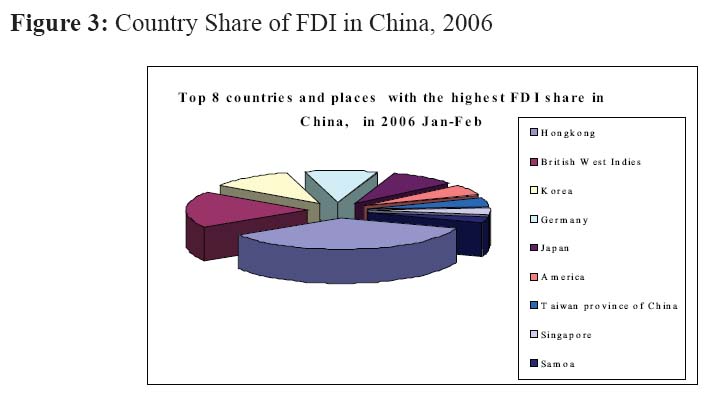
16 Accompanied continuously with foreign capital inflows, China has already become the world’s most appealing host country in attracting foreign capital. From January to February 2006, 5136 new foreign corporations invested in China, with an actual amount of foreign capital funds of US $8589 million. Where are China’s FDI inflows coming from? In January and February 2006, for instance, Hong Kong, Japan, Korea, Taiwan Province of China, and Singapore accounted for a large percentage of China’s FDI inflows. A lot of China’s FDI comes from these relatively advanced Asian economies, suggesting that these flows do bring the usual benefits associated with FDI, including transfers of technological and managerial expertise (Figure 3).
Figure 3: Country Share of FDI in China, 2006Methods
Framework
17 Figure 4 presents an analytic framework, which is made up of three main parts, external equilibrium, internal equilibrium, and economic levers. Each part contains some key factors.
18 In part 1, external equilibrium, refers to the convertibility of the BOP’s accounts, which contain the current account and the capital account. Besides this, some capital allocations in tradable and non-tradable factors occur in this part.
19 In part 2, internal equilibrium, refers to economic growth (this is especially true now for China). In this part, there is a chain that contains the economic growth, capital stock, capital price, and some prices of tradable and non-tradable goods. As can be seen from the figure, both the external and internal economy parts make a circle of economic growth and expansion, which is very critical for economic development.
20 In part 3, economic levers, refers to the nominal interest rate and nominal exchange rate. They are the capital prices, which are not only indicators of the economy, but also influencers of the economy, just like levers in physics. As can be seen, economic levers can affect both the external and internal economy. Aside from the main parts of the external economy, internal economy, and economic levers, there are still some vital variables that can create an impulse from outside or just inside the economy, such as Foreign Direct Investment (FDI), real exchange rate, and real interest rate. As one knows, the real interest rate and real exchange rate comes from the nominal variables adjusted by the price level. A concrete example can be seen in part B of this section.
Figure 4: Analytical Framework

Display large image of Figure 4
21 In Figure 4, there are also items (1), (2), and (3), which represent, (1) how FDI affects the BOP; (2) how exchange rate affects FDI, and (3) the Balassa-Samuelson effect.
(1) FDI affects on the BOP
22 The new trade theories reveal a complementary relationship between the growth of FDI and international trades. The multinational enterprises are usually international market-oriented. This can demonstrate to the Chinese business enterprises how to survive in the international market. The trades and foreign countries’ investments now occupy an important position in the balance of payment, not only in terms of specific weight, but also in business activities internationally. In addition, trades and foreign countries’ investments have become the focus of the current account item and the capital financial account items in the BOP.
(2) Exchange Rate affects on FDI
23 The affect of the exchange rates on FDI has been examined with respect to changes in the bilateral level of the exchange rate between countries, and also in the volatility of exchange rates. Froot and Stein (1991) presented an imperfect capital markets hypothesis to explain why a currency appreciation may actually increase foreign investment by a firm. Blonigen (1997) used industry-level data related to Japanese mergers and acquisitions activities into the United States to test this hypothesis and found strong support for increased inward acquisitions. Lipsey (2001) studied the United States FDI in three regions as they experienced currency crises (Latin America in 1982, Mexico in 1994, and East Asia in 1997) and found that FDI flows are more stable during these crises. Desai, Foley, and Forbes (2004) compared the performance of the United States foreign affiliates with local firms when faced with a currency crises and found that the United States foreign affiliates increased their investment, sales, and assets significantly more than local firms during and after to the crises.
(3) Balassa-Samuelson Effect
24 If the productivity factors grow deterministically, the deviation of the real exchange rate from a deterministic trend should be a stationary process. There are several explanations for why purchasing power parity (PPP) does not hold. The Balassa-Samuelson focuses on the role of non-traded goods. Balassa and Samuelson argued that a high income country is technologically more advanced than a low income country, yet the technological advantage is not uniform across sectors. The technological advantage of the high income country is greater in the tradable sector than in the non-tradable sector. By the law of one price, the prices of tradable goods will be equalized across countries; however, this would not be the case in the non-tradables sector, where the law of one price does not hold. Increased productivity in the tradable goods sector will increase real wages, and as a result lead to an increase in the relative price of non-tradables. Long-run productivity differentials would thus lead to trend deviations from PPP. Balassa and Samuelson also examined the affect that deviations of exchange rates from PPP have on inter-country income comparisons. Balassa provided empirical evidence that the real price structure of a large group of countries shows a systematic correlation with the level of per-capita income; in particular, the lower the per-capita income of a country the lower the domestic price of services. This reasoning runs counter to the predictions of the absolute version of PPP, which states that exchange rate conversions based on PPP yield unbiased income comparisons.
Real Effective Exchange Rate (REER)
25 The effective exchange rate, which is a measure of weighted-average value of a currency relative to two or more other currencies, is a good indicator to grasp a country’s international competitiveness in terms of its foreign exchange rate (to predict currency crisis), it also provides information about the residents’ living levels. The weighted average of one country’s exchange rate versus other major currencies are calculated using the value of its trade with the respective countries and areas as its weights, and is converted into a single index using a base period (a base year serves as a reference point in time). As one knows, because the effective exchange rate is a weighted average of bilateral or multilateral exchange rate, economists must select weights, which are a means of placing greater emphasis on the more important currencies in the currency basket and less emphasis on the less important currencies in the currency basket.
26 In concrete empirical work, the effective exchange rate is usually classified into nominal effective exchange rate and real effective exchange rate. For example, the nominal effective exchange of the RMB is the weighted average of the RMB’s exchange rates versus other major currencies exchange rates, which are calculated using the value of China’s trade with the respective countries and areas as its weights. Then, it is converted into a single index using a base year. However, when the nominal effective exchange rate of the RMB remains unchanged, the relative competitiveness of Chinese goods increases when the inflation rate of the rival exporting countries surpasses that of China. Taking this into account, the nominal effective exchange rate is adjusted to incorporate inflation rate differences, and this indicator is called the real effective exchange rate. So, international competitiveness is affected not only by the exchange rate, but also by domestic and foreign price movements.
27 The calculation method of the real effective exchange rate is as follows. Each of the yen’s exchange rates versus other major currencies (nominal exchange rates) is deflated by the price indices of Japan and the corresponding country and area to get the real exchange rate. Then, weighted average of the real exchange rates is calculated using the value of Japan’s trade with the respective countries and areas as its weights. Then, it is converted into a single index using a base period. For example, if we set 1994 as the base year, the nominal effective exchange rate in month m of year t (NEt,m), is given by the following formula:


where ϱi,t,m is the nominal exchange rate of the RMB in terms of foreign currency i at month m of year t, and W i, t is the weight of exports to country i in year t.
28 Replacing the nominal exchange rate with its real exchange rate by deflating them with the price indices of Japan and the corresponding countries yields the formula for the real effective exchange rate (the real exchange rate, q, is the ratio of the foreign price index, expressed in domestic currency, to the domestic price index, or, equivalently, q=E·(P*/P). The base year is 1994. In this way, we can get the REER of RMB, for the period of 1994 to 2004. This is a key variable in our next section.
Results*
29 A detailed description of the variables of FDI and REER is now available, which can help in understanding the issue in this section. The data from the BIS and Chinese economic database are used to establish an empirical model. The sample period is from 1994 to 2004, and all of the data are quarterly (Figure 5).
Figure 5: Monthly amount of China’s FDI and CA

Display large image of Figure 5
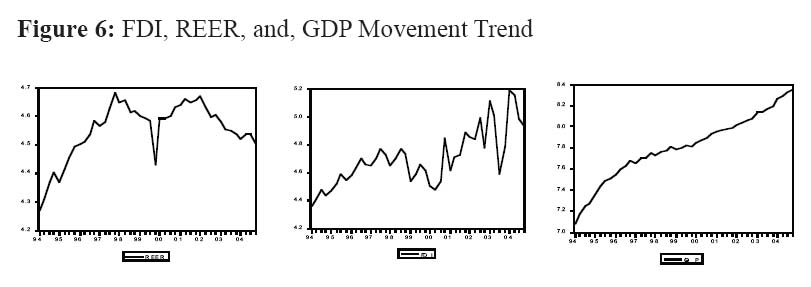
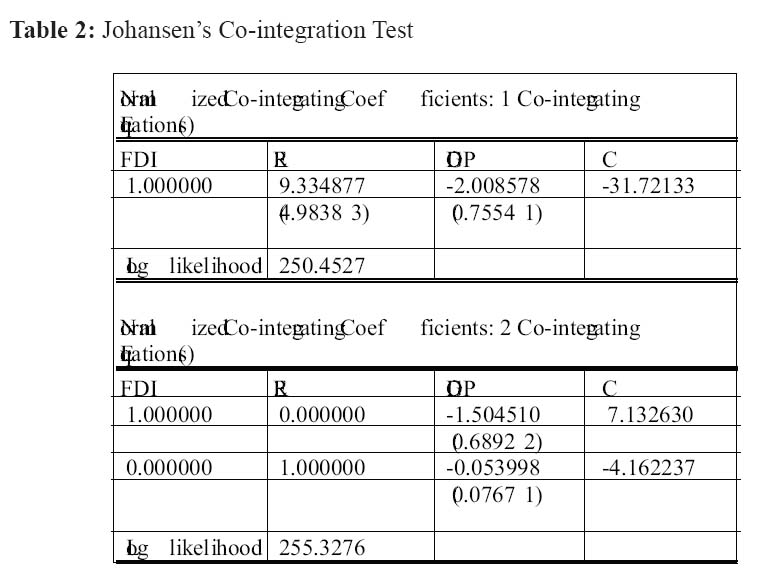
30 In the model, there are three main variables: FDI, REER, and GDP. Seasonal adjustment to all of the data is made, and then they are put in logs. The pictures of each variable’s trend are shown below (Figure 6). As can be seen from Table 1, through the ADF unit-root test, it was found that LnREER , LnFDI , LnGDP are not stationary, while the first different of these variables (△LnFDI, △LnFDI , △LnGDP) are stationary. So the VEC model can be established and Johansen’s Co-integration Test can be done (Table 2).
Figure 6: FDI, REER, and, GDP Movement Trend
Display large image of Figure 6
Table 1: The Unit-Root Test of Time Series ( LnREER , LnFDI , LnGDP)

Display large image of Table 1
Table 2: Johansen’s Co-integration Test
Display large image of Table 2
31 The vector auto-regression (VAR) is often used for forecasting systems of interrelated time series and for analyzing the dynamic impact of random disturbances on the system of variables. A vector error correction (VEC) model is a restricted VAR that has co-integration restrictions built into the specification, so that it is designed for the use with non-stationary series that are known to be co-integrated. The VEC specification restricts the long-run behavior of the endogenous variables to converge to their co-integrating relationships while allowing a wide range of short-run dynamics. The co-integration term is known as the "error correction" because the deviation from long-run equilibrium is corrected gradually through a series of partial short-run adjustments. The unit root processes will be co-integrated if there exists a linear combination of the two time-series that are stationary.
For example, {qt} and {ft} will be co-integrated if they are driven by the same random walk, ξt = ξt-1+ εt, where εt~ N (0. Thus, Ϥt = ξt + :,ͱt = ϕ (ξt + ;, and we can look for a value of β that renders stationary by choosing β = 1/ ϕ since ϥt - ft/ ϕ= zqt - zftis the difference between two stationary processes so it will be stationary. And {qt} and {ft} share a long-run relationship. They are co-integrated with co-integrating vector (1 - 1/ ϕ), since random walks are sometimes referred to as stochastic trend processes.32 When two series are co-integrated, it is suggested that they share a common trend. With this case, it can be seen that FDI, REER, and GDP share a similar trend during the sample period (Figure 7).
Figure 7: Relationship among the movement of FDI, REER and GDP

Display large image of Figure 7
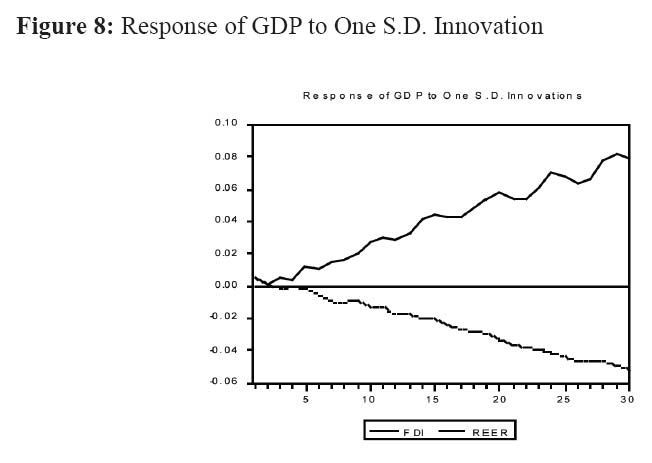
33 The impulse response functions for the chosen model can be obtained. For example, one can select the impulse of FDI and REER, and use the Eviews to compute the impulse response function for each innovation and endogenous variable pair. It is hoped to observe the impulse responses of the variables of FDI and REER to generate innovations and GDP. As can be seen from Figure 8, the response of GDP to the impulse of FDI and REER are in different directions, which means that the directions of FDI and REER affecting GDP are opposite.
Figure 8: Response of GDP to One S.D. InnovationConclusion
34 The framework and empirical analysis indicate that FDI, REER, and the domestic economy are complexly interacting, especially in the long-term. There is a dynamic relationship of equilibrium among FDI, REER, and the domestic economy in the long-run. It seems that the increase of FDI can lead to RMB’s appreciation, and this is co-related with the Balassa-Samuelson effect. Aside from this, it was found that China’s economic growth greatly depends on the FDI, and this is not only reflected in the analysis of BOP, but also in the empirical analysis. In conclusion, the selected framework and empirical work can be extended to account for more complex aspects of the association between FDI, REER, and GDP. For example, the important relationships among interest rate (including nominal interest rate and real interest rate), FDI, and exchange rate (including nominal and real rates) were ignored. What is the effect of FDI or REER on China’s economic growth efficiency? All of these considerations are left for future research.
Notes
35 In this part, the econometric software of EViews 3.0 was used.
References
Aizenman, J. and Noy, I. (2005). FDI and Trade - two Way Linkages? NBER Working Paper 11403.
Daniels, J.P. and VanHoose, D.D. International Monetary & Financial Economics. 3rd ed.
Eswar P. and Wei, S.J. (2005). The Chinese Approach to Capital Inflows: Patterns and Possible Explanations. NBER Working Paper 11306.
Goldberg, L.S. and Kolstad, C.D. (1994). Foreign Direct Investment, Exchange Rate Variability and Demand Uncertainty. NBER Working Paper 4815.
Krugman, P.R. and Obstfeld, M. (2002). International Economics: Theory and Policy. 6th ed. Addison Wesley: Boston.
Lall, S. and Streeten, P. (1977). Foreign Investment, Transnational and Developing Countries. Macmillan: London.
