Trade Facilitation and Africa’s Manufactured Goods Export
Oluyele AkinkugbeUniversity of Botswana, Botswana
This paper examines the issues of why; even in the light of reductions in tariff and non-tariff barriers in many African countries in recent times, government policies, including restrictive trade and poor customs regulations and administration––issues of trade facilitation––still continue to discourage exporting. A panel data analysis was undertaken to consider a variety of indicators of trade facilitation and test their relative efficacy on trade flows in a multi-country framework. Time series data on 20 selected African countries were pooled in this regard. Our conclusions are that policy-regime improvements and conscious efforts at removing all forms of constraints to the free flow of goods– –reducing trade and customs regulations––from current levels, could have a significant impact on trade expansion in Africa.
Introduction
1 The role of international trade in industrialization, economic growth and development has long been a topic of interest to economists and policy makers worldwide. A large number of studies have examined this relationship empirically (Myrdal, 1957; Harberler, 1959; Maizels, 1968; Michaely, 1962; Reidel, 1984; Singer and Grey, 1988; Ng and Yeats, 1997), and the results from these empirical studies confirmed Kravis (1970) conclusions that international trade provides an important stimulus to growth. Economic theory therefore seems to suggest a relatively direct and simple chain of causality: human development is enhanced through income growth; income growth is greater with more cross-border trade; trade is increased through all conscious and indirect efforts at trade facilitation. Consequently, interest has been high in identifying factors constraining a country’s capacity to fully engage in trade and examining policy options towards increasing such capacity. It is widely recognised that high foreign tariffs and non-tariff restrictions reduce a country’s trade below potential levels. Equally important, perhaps, self-imposed restrictions and overregulation, as well as high production and transaction costs can have similar adverse effects of reducing trade volume, and therefore the ability to compete efficiently in global commerce. Given the fact that in more recent times, the increasing move towards globalization, the adherence to the World Trade Organization (WTO) rules as well as membership in many regional trade blocs, has led to gradual dismantling of tariff and non-tariff barriers to trade, the removal of other form of constraints and technical barriers to trade (TBT) in the way of free flow of goods and services––fostering trade through trade facilitation––remain one major hurdle that needs to be scaled to attain expanded trade and competitiveness in Africa.
2 Countries in Africa often export narrow range of products (Collier, 1998; Wohlmuth, 2005). A recent study (Morrissey and Filatotchev, 2000) noted that in the late 1990s, 39 of 47 African countries depended on two primary commodities for over half of their export earnings. As a result, these countries are highly vulnerable to commodity terms-of-trade shocks. Diversifying exports away from primary commodities into labor-intensive manufacturing, which currently accounts for only a relatively modest share of gross domestic product (GDP) and even more modest share of exports, could reduce this vulnerability. In addition to reducing vulnerability to shocks, increasing exports might boost income by increasing economic growth (Soderbom and Teal, 2003). Exporters have also been found to be more efficient than non-exporters in sub-Saharan Africa (World Bank, 2004a).
3 Although there is no conclusive answer as to what might better explain the higher productivity and competitiveness of exporters, recent enterprise-level studies (Bigsten et al., 2004; Mengistae and Pattillo, 2004) found that direct exporters and firms that export outside sub-Saharan Africa are more productive than other exporters. Similarly, studies that utilized data from other regions of the world (Fajnzylber, 2004; Hallward-Driemeier et al., 2002; Aw et al., 2000; Bernard and Jensen, 1999; Clerids et al., 1998) found similar results. The conjecture can therefore be made that if exporting leads to productivity improvements, policies that promote exports––or at least remove biases that discourage exports––might improve productivity and ultimately result in greater trade competitiveness for Africa in the global market, resulting in higher income and accelerated growth rate.
4 This paper examines the issues of why; even in the light of reductions in tariff and non-tariff barriers in many African countries in recent times, government policies, including restrictive trade and poor customs regulations and administration––all related issues of trade facilitation––still continue to discourage exporting. The paper is organized as follows. Section II briefly presents the theoretical conceptualization of trade facilitation, and an analysis of Africa’s participation in global commerce in the light of the issues of trade facilitation. Section III highlights earlier literature on the subject and also presents the methodology adopted and the sources of data used for the empirical analysis. While the results of the analysis are presented in section IV, conclusions are given in section V.
The Issues
5 In the broadest sense, trade facilitation encompasses the domestic policies and technical regulations, institutions, standards, and infrastructure associated with the movement of goods across borders, (Wilson et al., 2003b). In this regard, trade facilitation can be conceptualized as improving efficiency in administration and procedures, along with improving logistics at ports and customs, streamlining regulatory environment, deepening harmonization of standards, and conforming to international regulations, in the drive to attaining free movement of goods and global trade competitiveness. Defined in this way, trade facilitation can be measured using four broad indicators:
- Port environment––designed to measure the quality of infrastructure of maritime, road transportation––transport corridors and airports;
- Customs Environment––designed to measure direct customs costs as well as administrative transparency of customs and border crossings;
- Regulatory Environment––designed to measure an economy’s approach to regulations and;
- E-business Usage––designed to measure the extent to which an economy has the necessary domestic infrastructure (such as telecommunication, financial intermediaries, and logistic firms) and using networked information to improve efficiency and to trans form activities to achieve improved trade flows and economic competitiveness.
6 In this era of dynamic and changing global trade patterns, the costs of moving goods across international borders is just as important as tariffs––if not more––in determining the cost of landed goods and the competitiveness of nations in the trading arena. The ability of countries to deliver goods and services on time and at the lowest possible cost is, therefore, a key determinant of integration into the world economy. For instance, some recent studies have shown that it costs more to transport goods from Durban in South Africa to neighbouring countries in the Southern African region than it costs to ship the same tonnage of goods from Singapore to Durban. Thus, the issues of trade facilitation are key in recent WTO negotiations and the broader Doha Development Agenda.
Africa’s Exports and the Trade Facilitation Issues
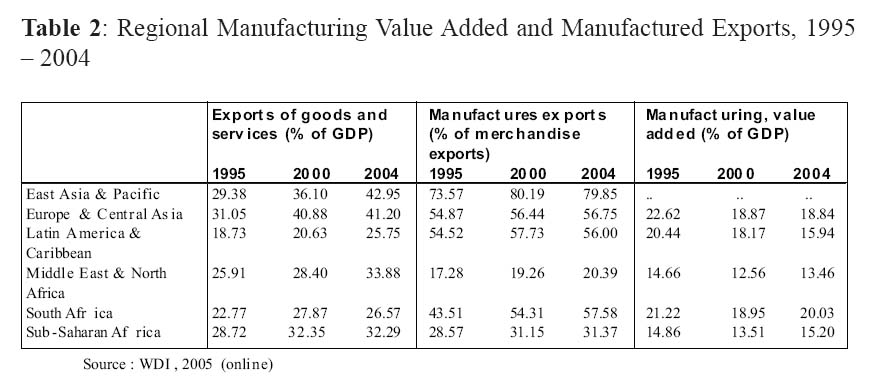
7 Manufacturing accounts for only a relatively modest share of value added in most African countries (except for South Africa). Table 1 reveals that Africa’s participation in the global trading system has not only been quite marginal, but also has not recorded any marked improvement since 1980, Table 2 shows that Africa as a whole (sub-Saharan Africa and North Africa as represented by MENA) also lags significantly behind the rest of the regions of the world on account of manufacturing value added as percentage of GDP. In 2004, manufacturing value added was equal to approximately 15 percent of GDP as opposed to about 25 percent in China. The difference between the successful Asian economies and sub-Saharan Africa is even more pronounced when looking at manufacturing exports (Table 2). Manufacturing exports, as a percentage of total merchandise exports, were equal to about 80 percent in East Asia and the Pacific in 2004, and about 57 percent in Europe and Central Asia for the same period––compared to just 31 percent in sub-Saharan Africa. As a percentage of GDP, Clarke (2005) indicated that manufactured exports from sub-Saharan Africa were just about 3 percent.
8 In terms of the factors that may directly or indirectly impact Africa’s manufactured exports performance, Table 3 clearly reveals that even though tariffs have been falling over the years in most of Africa, customs and trade regulations have imposed some noticeable constraints. In many African countries, it takes a relatively long time for exports and imports to clear customs procedures and in some cases, additional informal payments to customs officers are needed to ensure timely processing. In addition to long processing time, the paper work associated with importing and exporting can be burdensome (Milner et al., 2000; World Bank 2004a, 2004c). Furthermore and as reported in the investment climate surveys, some enterprises need to complete additional procedures, such as obtaining import or export licenses to import intermediate inputs, raw materials or capital goods and to export their final products. Table 3 also shows that whereas the average number of days to clear exports in Africa is over 6 days, it is 3.8 days in Asia. For imports, the same exercise takes about 10 days in Africa and just over 5 days in Asia.
Table 1: Africa’s Percentage Share of World Exports, 1980 – 2004

Display large image of Table 1
Table 2: Regional Manufacturing Value Added and Manufactured Exports, 1995 – 2004
Display large image of Table 2
Table 3: Customs and Trade Regulations and Days for Exports and Imports to Clear Customs
Sources : World Bank : Investment Climate Surveys
Earlier Literature, Methodology, and Sources of Data
9 The greatest challenge faced by researchers over the years had to do with obtaining conceptually acceptable measures of trade facilitation which can meet policy makers’ needs. That is, how do research results assist policy makers in terms of the reallocation of scarce resources in order to encourage the flow of trade? Should policymakers start with such measures of trade facilitation as port modernization, customs reforms, regulatory harmonization or e-commerce infrastructure? All these reforms are clearly important and needed in any country for improved export performance, but limited resources––that confront most Africa countries in particular––imply that not all of them can be addressed at the same time, and therefore some prioritization may be necessary.
10 The empirical literature on trade facilitation is limited since attention only began to shift in this direction since the emergence of the WTO and the negotiation rounds in 1994. Maskus, Wilson, and Otsuki (2001) addressed some of the more important empirical methods and challenges in quantifying the gains of trade facilitation in the area of harmonized regulations. The Asia Pacific Foundation of Canada (1999) outlines the relative importance of the three kinds of trade facilitation measures (customs, standards and regulatory conformance, and business mobility) for APEC business, but did not assess the impact on APEC of trade facilitation improvements. Other recent empirical analysis, such as APEC (1999), UNCTAD (2001), and Hertel et al. (2001) used CGE models to quantify the benefits of improved Trade facilitation on trade flows. Similarly, studies such as those by Freund and Weinhold (2001), Fink et al. (2002), Moenius (2000), and John Wilson et al. (2002, 2003a, 2003b) used the gravity models and found that bilaterally shared standards, decrease in communications costs, enhanced port efficiency, improvements in customs and financial resources to trade significantly promote the expansion of trade, whereas regulatory barriers tend to deter trade. Furthermore, Otsuki, Wilson, and Sewadeh (2001a, 2001b) applied the gravity model to the case of food safety standards, and found that African exports of cereals, nuts, and dried fruits will decline with a tighter EU standard on aflatoxin contamination levels of these products.
11 The analysis undertaken for this paper departs in a way from the methodology applied in earlier studies; the use of panel regression technique of one-way error component random effects model was explored. The fixed effect model was tried but rejected based on the results of the Hausman specification test. The use of Panel Data technique in this regard enabled the exploitation of the usual access to and the inherent advantages of large number of data points, increased degree of freedom and reduced collinearity among the explanatory variables that are associated with such large data points, and of course increased efficiency of econometric estimates.
12 The basic structure of Equation (1) estimated is:
ln (Vit) = b1lnPE i + b2lnCEi + b3lnCE i + b4lnEB i + b5ln(GNPPC i ) + b6ln(TTP i ) + b7ln(ICT i ) + b8ln(TPC i ) + o? i + l i t (1)13 Where i stands for the countries in the sample and t denotes trading years (t = 1995, …, 2004). The dependent variable denoted as V stands for Manufactures exports as percentage of total merchandise exports. This is a preferred choice since the use of aggregate exports, which will then include fuels, ores, and metals exports may distort the results of the analysis. The terms denote country i’s indicators of port efficiency, customs environment, regulatory environment, and e-business usage. GNPPC denoted per capita GNP, TTP indicates Tax and trade policy variables; ICT indicates indicators of Information and Technology while TPC represents indicators of Transport, Power, and Communications. The parameters b’s are the estimated coefficients, whereas the time invariant term is the exporter-specific intercept that captures the exporter-specific fixed-effects such as variation of trade flows due to the unobserved difference in quality of goods, domestic policies, and border costs in exporting countries. The term E is the error term that is assumed to be normally distributed with mean zero. Equation (1) was estimated using the panel regression estimation technique.
Data and Data Sources
Data
14 Pooled, cross-country, annual time series data for the period 1995 – 2004 for 20 African countries were used for the empirical analyses. The major source of data is the World Development Indicators (WDI) 2005 (online). One major problem with the dataset is the issue of missing data points. Given this problem we resorted to the use of the variables for which consistent data were available for the period of 1995 to 2004. This same problem also necessitated the use of only 20 African countries in the sample , since for many of the African countries, WDI 2005 (online) reported missing points for most the variables of interest.
Variables
15 The dependent variables used for the analysis is Manufactures exports (percentage of merchandise exports) (MANEX), obtained from the World Development Indicators (2005) online. On the other hand, the explanatory variables derive from the conceptualization of trade facilitation as previously explained. Moreover, due to the lack of sufficient series on variables that could have constituted better proxies for the indicators of trade facilitation for the selected countries, we were constrained to the use of the following explanatory variables: real per capita GDP (RGDPPC) ( (+); taxes on exports (% of tax revenue) (OPEN) (-) (an indication of restrictive trade policy regime); number of start-up procedures to register a business (NSTART) (-); aircraft departures (AIR) (+); Fixed and mobile phone subscribers per 1000 people (PHONESUB) (+); corruption perception index (PERCEPTN) (+); domestic credit to the private sector (% of GDP) (CREDIT) (+); real interest rate (+); and international telecoms, outgoing traffic (proxy for ICT) (+) (INTT); Procedures to enforce a Contract (NFORCEP) (-).
16 A summary statistics of the data, which consist of ten annual observations for each country and each variable for a total of 200 observations, is provided in Table 4. The table provides a general view of the data. As can be observed from the table, except for Aircraft Departures and Real GDP, there are no excessive inter-country variations in the data for most of the variables.
Table 4: Summary Statistics

Display large image of Table 4
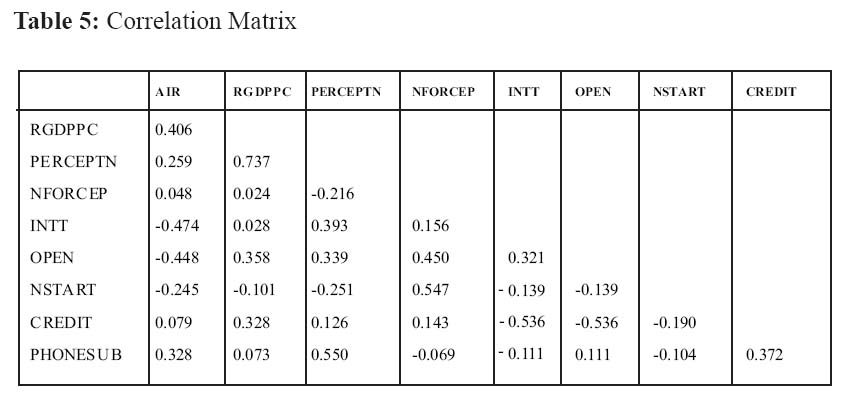
17 Following the standard practice in empirical analysis that involves time-series data, the data were tested for stationarity using the panel unit root tests procedure developed by Pedroni (1999). This test rejected the null of unit root at the 5 percent significance level . The data were also tested for heteroscedasticity using the white’s test, and checked for multicollinearity. Similarly, the null of Heteroscedasticity was rejected at the 5 percent significance level. The correlation matrix and the variance inflation factor (VIF), respectively, reported in Tables 5 and 6, do not indicate the presence of severe multicollinearity among the explanatory variables . The correlation matrix clearly shows that the pair-wise correlation is almost nonexistent for most of the variables. The only two variables for which there appears the presence of some positive correlation are Real GDP per capita and Corruption Perception Index. But even for these variables the correlation coefficient does not exceed 0.8 and thus not pose a serious multicoliinearity problem. For a multicol-linearity to cause a serious problem, the rule of thumb is that the correlation coefficient between two regressors must exceed 0.8.
Table 5: Correlation Matrix
Results
18 The Panel regression results (Table 6) indicate that, to a reasonable extent, the approach adopted for the analysis in this paper––generating a set of distinct trade facilitation indicators and using them in a regression model––is generally successful. Table 6 shows that the coefficients of the eight trade facilitation measures are generally significant at conventional levels (but for Aircraft Departures that is only marginally significant); and all are of the expected signs.
19 Worthy of further elaboration is the use of the Corruption Perception Index (CPI). As reported by Transparency International (TI), CPI relates to perception of the degree of corruption as seen by business people and country analysts in the reporting countries. It ranges between 10 (highly clean) and 0 (highly corrupt). We resorted to the use of this variable since there was not any reliable series on port efficiency (customs efficiency). In this regard, the conceptualization is that CPI could serve, both as an indication of the level of corruption in a country (which of course deters investment and trade flows) and as customs environment. The choice in this regard is further reinforced by the known fact that in many African countries irregular, additional payments connected with import and export permits, business licenses, exchange controls, tax assessment, police protection or loan application may, in a very significant way, constitute serious constraint to trade flows. The positive relationship between CPI and manufactures exports, that derive from the regression results, indicate that cleaner countries are likely to be highly productive and export more manufactured goods.
20 Finally, by way of caveat, it needs be mentioned that the estimated coefficients may be biased due to the sample selection bias that results from omitting observations with zero trade (Wall, 2000). Downward bias is likely for the coefficients on the trade facilitation measures because observation with zero trade caused by poor conditions of trade facilitation, other things being equal, are ignored. The implications of this selection bias could not be examined because the online data source (WDI, 2005) does not distinguish zero trade from missing records.
Table 6: Panel Regression Results
Author’s computations
Summary and Conclusions
21 Despite significant reductions in tariff and non-tariff barriers in many African countries in recent times, government policies, including restrictive trade and poor customs regulations and administration––all related issues of trade facilitation––still continue to discourage exporting. This paper tried to examine the relationship between the indicators of trade facilitation and trade flows (manufactured exports) through the use of Pooled, time series data that were obtained from the World Bank, World Development Indicators (WDI, 2005) (online) for 20 selected African countries. The results show that significant improvements in infrastructure, well functioning institutions, and e-business usages may significantly expand trade; whereas regulatory barriers and the perception of corruption in a country will deter trade.
22 The key innovation of the empirical analysis undertaken for this paper centers on the consideration of a variety of indicators of trade facilitation and testing their relative efficacy on trade flows in a multi-country framework. In the context of quantifying the benefits of trade facilitation efforts, this multiple-indicator approach and the econometric design, along with a probable decomposition of the impact of the various indicators on trade flows, may enable more targeted decision-making by policymakers. Whereas it remains true that a comprehensive effort yields the greatest increase in trade flows, examination of different kinds of trade facilitation and of disaggregated trade flows could be useful for targeting policy efforts and launching pilot projects in capacity building.
References
Asia Pacific Economic Co-operation (APEC) (1999, September). Assessing APEC Trade Liberalization and Facilitation: 1999 Update. Economic Committee. APEC: Singapore.
Asia Pacific Foundation of Canada (1999). Survey on Customs, Standards and Business Mobility in the APEC Region. APF Canada: Vancouver.
Aw, Bee Yan, Chung, S., and Roberts, M.J. (2000). Productivity and Turnover in the Export Market: Micro-level Evidence from the Republic of Korea and Taiwan (China). World Bank Economic Review, 14(1), 65–90.
Bernard, A.B., and Jensen, B.J. (1999). Exceptional Exporter Performance: Cause, Effect or Both?. Journal of International Economics, 47(1), 1–25.
Bigsten, A, Collier, P., Dercon, S. Fafchamps, M., Gauthier, B., Gunning,J. W., Oduro, A. Oostedorp, R., Pattillo, C., Soderbom, M., Teal, F., and Zeufeck, A. (2004). Do African Manufacturing Firms Learn from Exporting. Journal of Development Studies, 40(3), 115–141.
Clarke, G. R. G. (2001). Does Internet Connectivity Affect Export Performance? Evidence from the Transition Economies. World Bank: Washington DC. Processed.
Clerides, S. K., Lach, S., and Tybout, J.R. (1998). Is Learning by Exporting Important? Micro-dynamic Evidence from Colombia, Mexico, and Morocco. Quarterly Journal of Economics, 113(3), 903–947.
Collier, P. (1998). Globalization: Implications for Africa. In Trade Reform and Regional Integration in Africa, ed. Zubair Iqbal and Moshin S Khan, Washington DC: International Monetary Fund.
Fajnzylber, P. (2004). Learning Before of From Exporting? Evidence from Brazilian Manufacturing Firms. World Bank: Washington DC. Processed.
Fink, C., Matoo, A., and Neagu, C. I. (2002). Trade in International Maritime Services: How Much Does Policy Matter? World Bank Economic Review, 16, 81-108.
Frankel, J. A., Stein, Ernesto, and Wei, Shang-Jin (1997). Regional Trading Blocs in the World Economic System. Washington, D.C.: Institute for International Economics.
Freund, C. and Weinhold, D. (2000). On the Effect of the Internet on International Trade. Board of Governors of the Federal Reserve System: International Finance Discussion Papers, 693.
Hallward-Driemeier, M., Iarossi, G., and Sokoloff, K.L. (2002). Exports and Manufacturing Productivity in East Asia: A Comparative Analysis with Firm-Level Data. National Bureau of Economic Research Working Paper Series 8894. Cambridge, Mass.
Harberler, G. (1959). International Trade and Economic Development. Economics of Trade and Development, ed. J.D. Theberge , New York.
Hertel, T. W., Walmsley, T, and Itakura, K. (2001). Dynamic Effect of the "New Age" Free Trade Agreement between Japan and Singapore. Journal of Economic Integration, 16(4), 446-84.
Kravis, I. (1970, December). Trade as a Handmaiden of Growth: Similarities Between the Nineteenth and Twentieth Centuries. The Economic Journal.
Maskus, K. E. and Wilson, J. S. (2001). Quantifying the Impact of Technical Barriers to Trade: Can it be done? Studies in International Economics. Ann Arbor: University of Michigan Press.
Maskus, K. E., Wilson, J. S. and Otsuki, T (2001). An Empirical Framework for Analyzing Technical Regulations and Trade. Quantifying the impact of technical barriers to trade: Can it be done?. Eds. Keith Maskus, K. and Wilson, J.S.
Maizels, A. (1968). Exports and economic Growth in Developing Countries. Cambridge, Mass.
Mengistae, T. and Pattillo, C. (2004). Export Orientation and Productivity in Sub- Saharan Africa. International Monetary Fund Staff Papers, 51(2), 327–353.
Michaely, M (1962). Concentration in International Trade. Amsterdam, North Holland.
Milner, C., Morrissey, O. and Rudaheranwa, N. (2000). Policy and Non-Policy Barriers to Trade and Implicit Taxation of Exports in Uganda. Journal of Development Studies, 37(2), 67– 90.
Moenius, J. (2000). Three Essays on Trade Barriers and Trade Volumes. Ph.D. dissertation, University of California, San Diego.
Morrissey, O., and Filatotchev, I. (2000). Globalization and Trade: The Implications for Exports from Marginalized Economies. Journal of Development Studies,37(2), 1–12.
Myrdal, G. (1957). Rich Lands and Poor. New York.
Ng F. and Yeats, A. (2000). On the recent trade performance of Sub-Saharan African Countries: Cause for hope or more of the Same? Africa Region Working paper series No. 7. World Bank, Washington DC.
Ng, F. and Yeats, A. (1997, July). Open Economies Work better! Did Africa’s Protectionist Policies cause its marginalization in World Trade? World Development.
Otsuki, T., Wilson, J. S., and Sewadeh, M. (2001a). What Price Precaution? European Harmonisation of Aflatoxin regulations and African groundnut exports. European Review of Agricultural Economics, 28(3), 263-284.
Otsuki, T., Wilson, J. S. & Sewadeh, M. (2001b). Saving Two in a Billion: Quantifying the Trade Effect of European Food Safety Standards on African Exports. Food Policy 26.
Pedroni, P. (1999). Critical Values for Cointegration Tests in Heterogeneous Panels with Multiple Regressors. Oxford Bulletin of Economics and Statistics, 61, 653-70.
Riedel, J. (1984, March). Trade as an Engine of Growth Revisited. Economic Journal.
Singer, H.W. and Gray, P. (1988). Trade Policy and Growth of Developing Countries. World Development, 3.
Soderbom, M. and Teal, F. (2003). Are Manufacturing Exports the Key to Economic Success in Africa? Journal of African Economics, 12(1), 1–29.
Tinbergen, J. (1962). Sharing the World Economy: Suggestions for an International Economic Policy. Twentieth Century Fund: New York.
United Nations Conference on Trade and Development (UNCTAD) (2005). Handbook of Statistics 2005. UNCTAD, Geneva.
United Nations Conference on Trade and Development (2001). E-Commerce and Development Report. UNCTAD: Geneva.
Wall, H. J. (2000). Gravity Model Specification and the Effects of the Canada- US. Border. Federal Reserve Bank of St. Louis Working Paper Series, 20000-024A. St. Louis.
Wilson, J. S., Mann, C., Woo, Y. P. Assanie, N., and Inbom Choi, (2002). Trade Facilitation: A Development Perspective in the Asia-Pacific Region. Asia Pacific Economic Cooperation: Singapore.
Wilson, J.S., Mann, C. L., and Otsuki, T. (2003a). Trade Facilitation and Economic Development: Measuring the Impact. World Bank Working Paper, 2988. World Bank, Washington DC.
Wilson, J.S., Mann, C. L., and Otsuki, T. (2003b). Trade Facilitation and Economic Development: A New Appproach to Quantifying the Impact. The World Bank Economic Review, 17(3), 367-389.
Wohlmuth, K. (2005). African Development Perspective Yearbook: Escaping the Primary Commodities Dilemma, 11. VERLAG Munster – Hamburg – London.
World Economic Forum (2005). Global Competitiveness Report. World Economic Forum: Geneva.
World Bank. (2004a). Investment Climate Assessment: Enterprise Performance and Growth In Tanzania. World Bank: Washington DC.
--------. (2004b). World Development Indicators. Washington, D.C.: World Bank.
--------. (2004c). World Development Report 2005: A Better Investment Climate- For Everyone. Washington DC: World Bank.
--------.(2005).World Development Indicators. Retrieved from https://publications.worldbank.org/register/WDI2005