News on Corruption in the Wall Street Journal and the Corruption Perception Index (CPI)
Runtian JingUniversity of Electronic Science and Technology of China, China
Gaoliang Zhang
Zhe Jiang University, China
Tianli Feng
University of Electronic Science and Technology of China, China
Based on cross-time-section series data collected from Wall Street Journal (WSJ), this article suggests that the Corruption Perceptions Index (CPI) for 60 countries/regions published by Transparency International is highly correlated with WSJ news about "corruption", especially for eight strong countries. Compared to a slight converging trend of CPI standard deviation, the CPI score presents no significant response to time. Our partial multiple correlation model suggests that WSJ news may be a good indicator of corruption levels in a country, although not as a potential cause influencing CPI.
Introduction
1 Corruption is an important issue in business, economic, and social science research. Due to differences in research focus and perspective, previous literature has provided varying definitions for corruption. Some studies examine the corrupt behavior of politicians (LaPalombara, 1995; Oldenbury, 1987), while others describe corruption between private parties, such as in commercial bribery (Coase, 1979). Shleifer and Vishny define corruption as "the use of governmental power to create rents via entry controls, regulatory cartel enforcement, or raising rivals’ costs" (Shleifer & Vishny, 1993: 599). In Macrae’s definition, corruption is "the arrangement that involves an exchange between two parties which (1) has an influence on the allocation of resources either immediately or in the future; and (2) involves the use or abuse of public or collective responsibility for private ends" (Macrae, 1982: 678).
2 Since Transparency International (TI) began to publish its annual report of Corruption Perceptions Index (CPI) in 1995, this index has become a leading indicator of corruption in social science research, and has been widely used for measuring the level of corruption across countries. The definition given by TI focuses on the public sector, and is defined as "the misuse of public power for private benefit such as bribing of public officials, kickbacks on public procurement, or embezzlement of public funds" (Transparency International, 2003). The CPI score reflects the impressions and perceptions of corruption in dozens of countries based on surveys of business people, academics, risk analysts, and the general public, and ranges from "0 = highly corrupt" to "10 = highly clean". As we are interested in the explanation and justification of perceived levels of corruption, TI’s definition will be used for the current study.
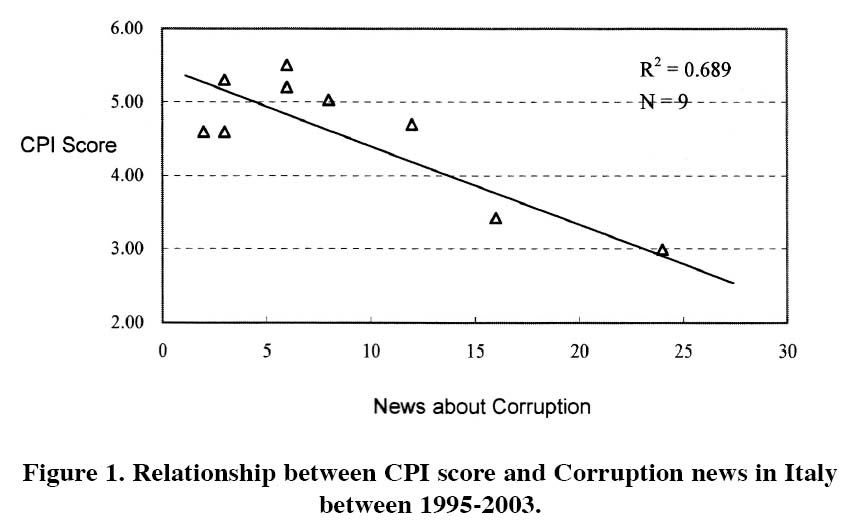
3 The other important publication used in our study is the Wall Street Journal (WSJ), the flagship publication of the Dow Jones. In addition to the U.S. edition, which is edited in New York, the company publishes the Asian Wall Street Journal, edited in Hong Kong, and the Wall Street Journal Europe, edited in Brussels. WSJ and its global editions are some of the most respected sources of worldwide business and financial news. We noticed that the annual number of WSJ reports concerning corruption for a particular country appeared to correlate with the CPI score of that country. For example, despite its economy status, Italy suffers from high levels of corruption. Furthermore, its perceived level of corruption has varied greatly over the past nine years, with CPI values ranging from 2.99 (1995) to 5.5 (2001). After plotting annual amounts of corruption news with the annual CPI score, we found that the changing trend of WSJ news reflects variance of the CPI score1, as Figure 1 shows. This finding led us to examine the relationship between news coverage and corruption.
Figure 1. Relationship between CPI score and Corruption news in Italy between 1995-2003.
Display large image of Figure 1
4 We have three empirical predications. It must be stated from the outset that we are not concerned with causality issues here, but simply an association between WSJ news and CPI scores.
Hypothesis 1: The CPI of a country is negatively associated with WSJ news items concerning "corruption".
5 We adopted absolute CPI scores to reflect a country’s level of corruption. This is because a country’s ranking order can vary annually. Thus, TI recommends that absolute scores be used in year to year comparisons rather than relative ranks. Two factors can account for year to year changes in CPI score: the changing perception of a country’s actual performance, and changes in sampling and methodology. Therefore, we predict a time effect, where CPI scores will show shifting trends from year to year.
Hypothesis 2: The CPI score is sensitive to the year that has been surveyed.
6 CPI is a composite index. For example, the 2003 CPI report consisted of survey years between 2001 to 2003 (information for each country was drawn on 17 different polls/surveys from 13 independent institutions, including the World Economic Forum (WEF), Institute of Management Development (IMD), World Bank (WB), and Gallup International (GI)).
Hypothesis 3: Countries display different sensitivity with respect to the relationship between CPI score and WSJ news.
7 In addition to the time difference, the sampling countries in these sources also vary greatly. For example, the Risk Ratings Survey conducted by World Markets Research Center (WMRC) covers 186 countries, while the Asian Intelligence Issue conducted by Political & Economic Risk Consulting (PERC) covers only 14 countries. During the combination process, the minimal required number of surveys is three before one country can be included in the final CPI report. Thus, in the 2003 report, the number of surveys used to generate country scores varied from 3 to 17. Such a large variance affects the reliability of the CPI score for each country. In general, a strong country will enjoy a large number of data sources, and thus convey high reliability as to the perceived score. This fact may affect the significance of correlations between WSJ news and CPI score.
Methods
8 We developed a dataset from WSJ (including its global editions) describing news items concerning corruption for 60 countries/regions from 1995 to 2003. The data is from searched editions using the exact matching method (i.e. the "citation or text" of news contained the word "corruption" for a given country in a given year). While we also searched the database using associated words such as "bribery", the results showed that news items with these words are far less numerous than for "corruption". Additionally, search results for the former overlapped in records. Thus, we have limited the dataset in our study to items found by the word "corruption".
9 We denote news items about corruption as nit for country i (i = 1...60) in year t (t = 1...9, refers to year 1995-2003 respectively). The CPI score for that year is cit.
10 We searched and calculated the total items of news items covering all topics (besides corruption) for each country over the past nine years, which is as ri. Therefore, the frequency of news (fi) for country i can be calculated as:

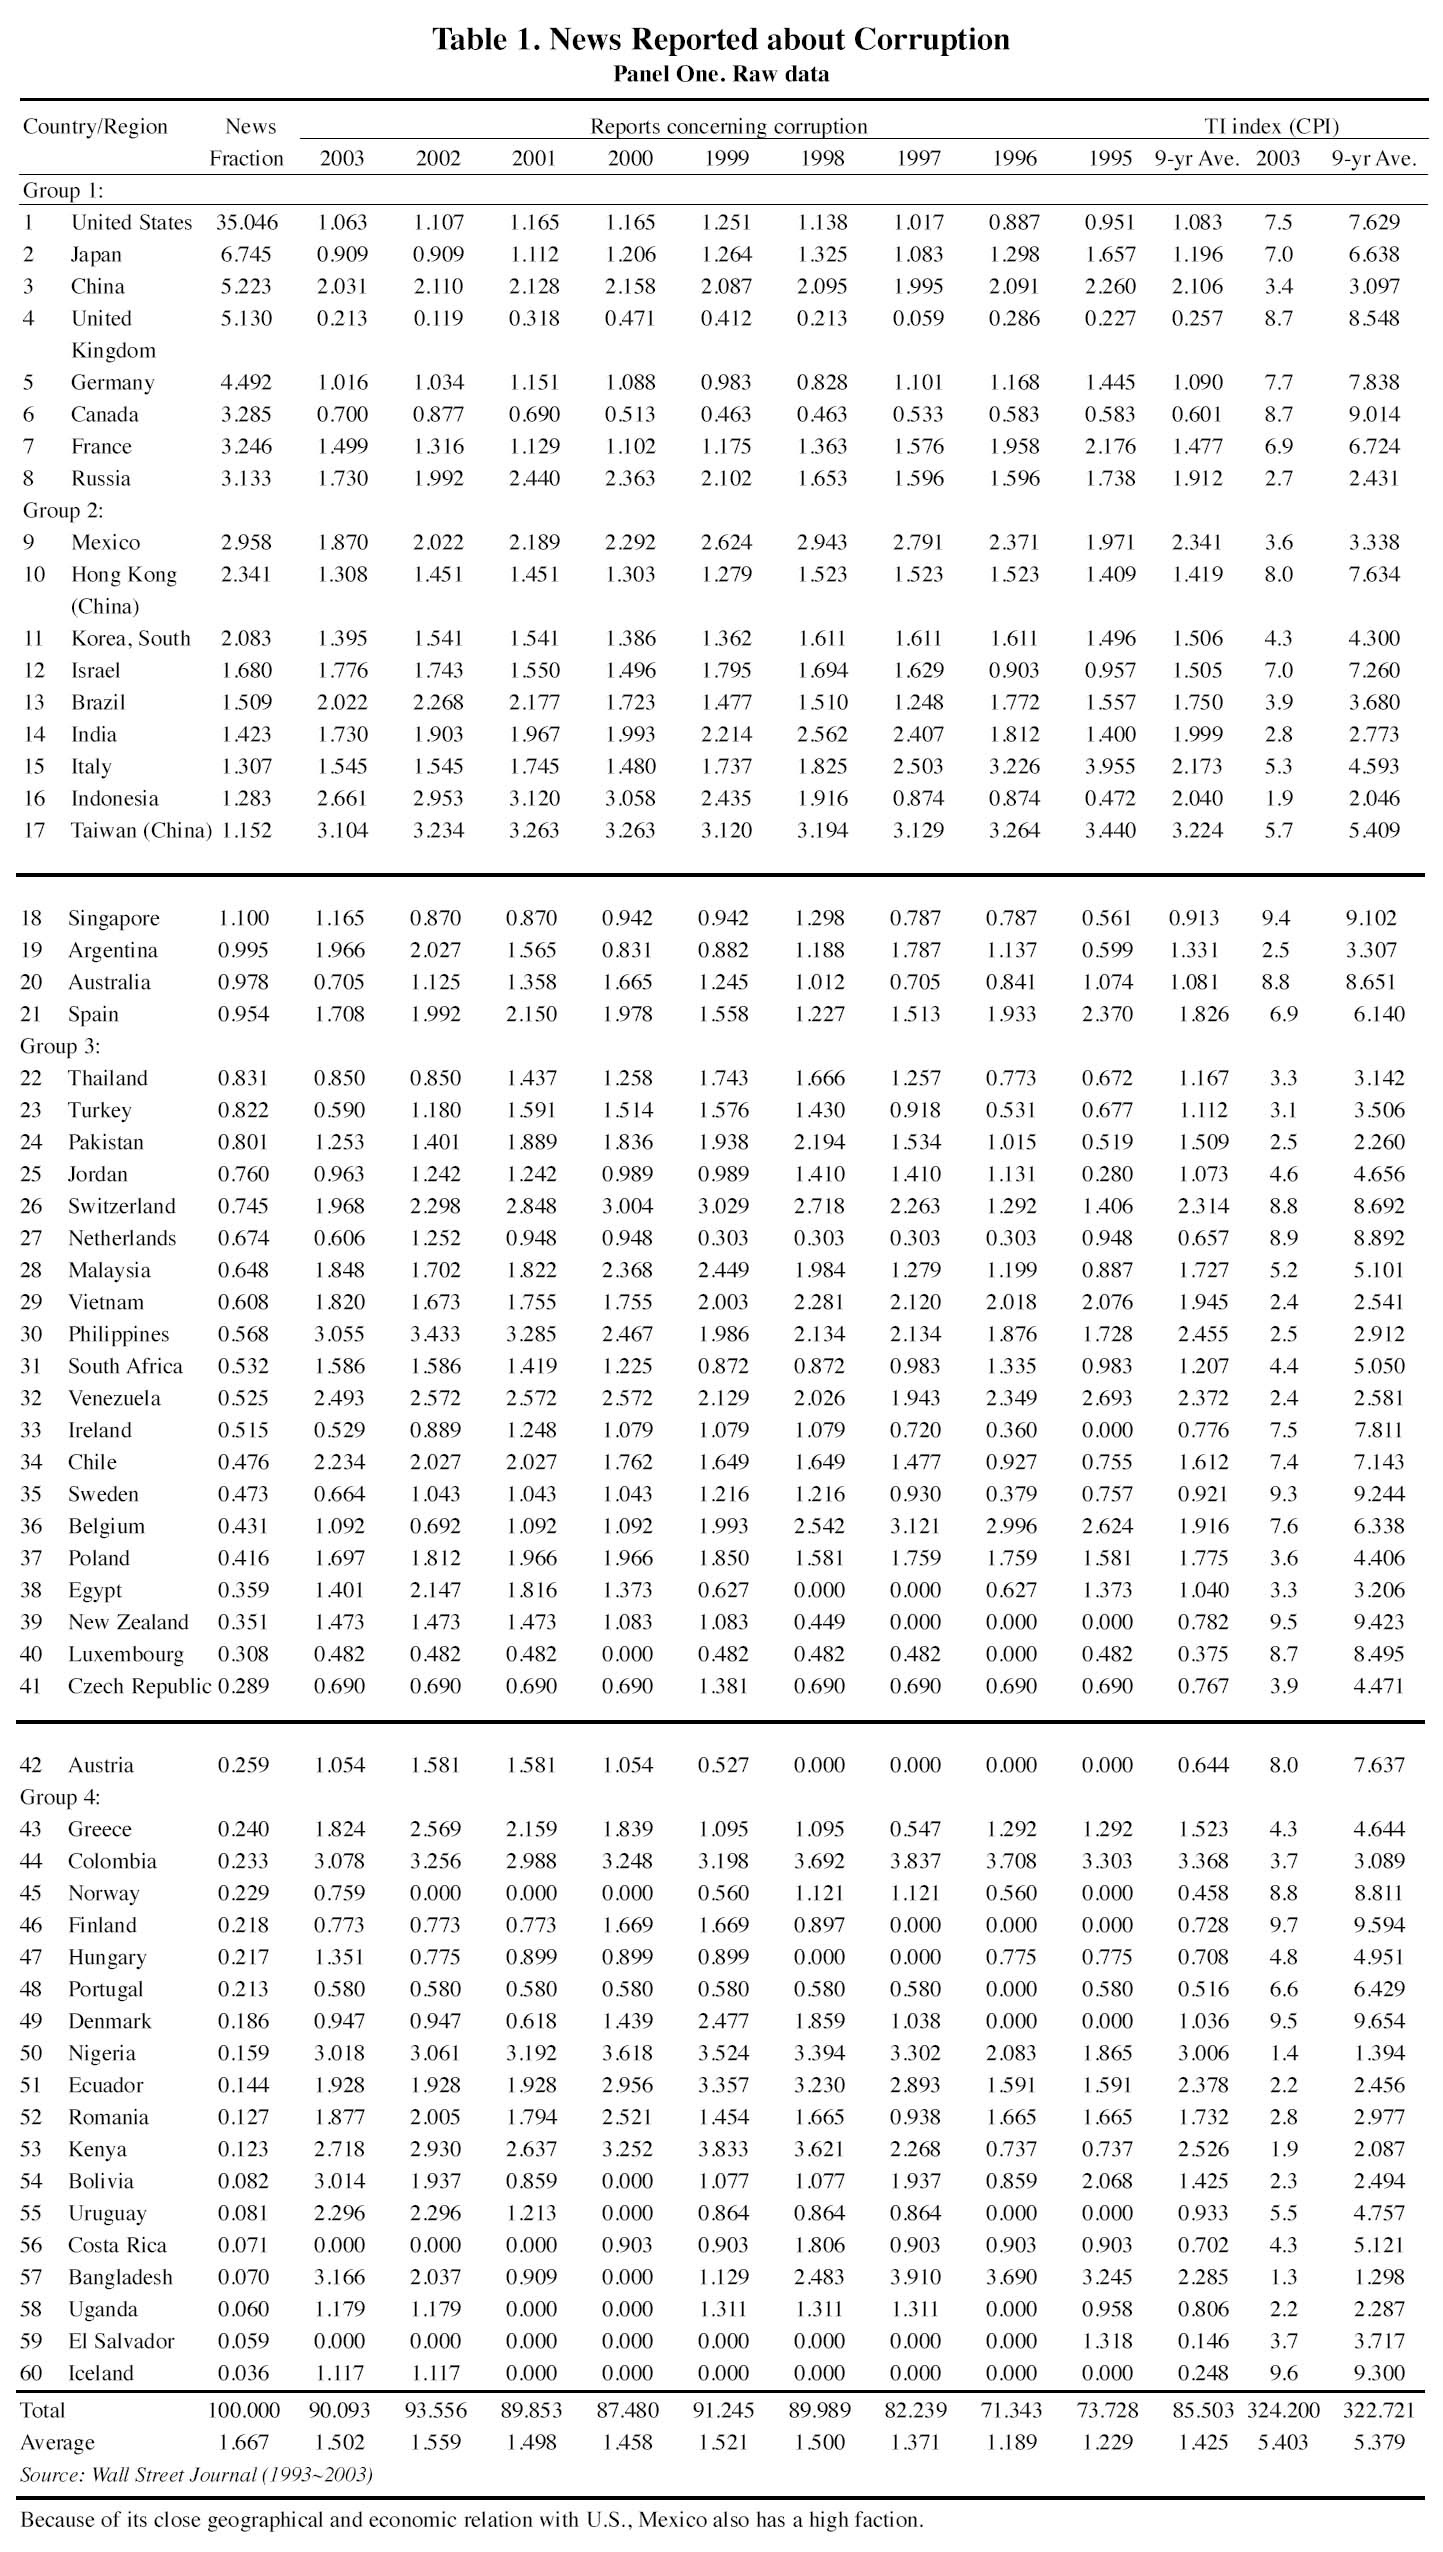
11 Countries differ greatly in the frequency of news in WSJ2. From Table 1 the U.S. has the highest coverage, and was involved in 35.04% of all the items. Eighty percent of all the countries are below the average level of coverage (1.667%).
12 In most of cases, corruption news in a strong country will have a high probability of being reported, even if its degree of seriousness is similar or less than that of other countries. However, once reported by WSJ, one additional piece of corruption news in a less strong country will cause much deeper impression toward the minds of its readers. Hence, we take the following formula to estimate the real corruption events by the reported news in WSJ.

13 ñit reflects the amount of news events that are newsworthy to the same degree across all countries. The estimated amount provides a reasonable base to predict the perceptual index for each country, and to compare the level of corruption across all countries.
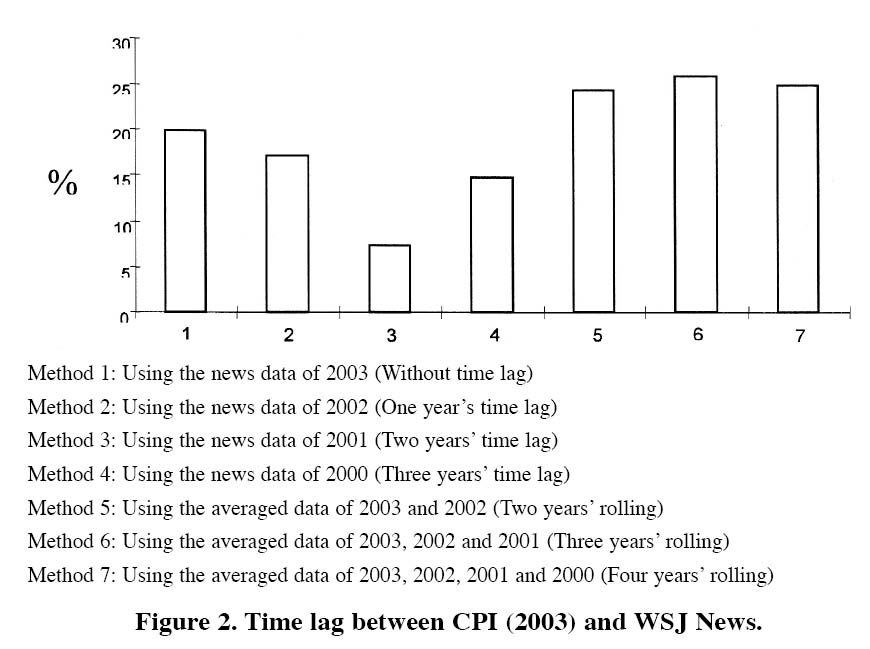
14 Since changes in corruption for a country usually evolve slowly, while public perception may change more quickly and is influenced by short-term events, TI has based the CPI on a three-year rolling average. Thus, the 2003 CPI is based on the survey data provided between 2001 and 2003. However, once a serious corruption event happens, WSJ can report it very quickly. Thus, we assume a time lag for correlations between ñit and cit . To catch such a time lag we have conducted further model competition analysis using seven different time lagging or rolling methods.
15 Using the 2003 CPI data as an example, Figure 2 shows that the correlation between WSJ news and CPI score changes very gradually under different time lag situations. Comparatively speaking, the three-year rolling data of news has the strongest correlation coefficient to the 2003 CPI value. In reality, 2003 CPI report was released on October 7 2003, and its 17 survey sources were carried out between 2001 to 2003. Therefore, this fact has explained the result of our model competition.
Figure 2. Time lag between CPI (2003) and WSJ News.
Display large image of Figure 2
16 As panel one in Table 1 shows, we calculated the three-year rolling data of news for 60 countries/regions according to the following formula:

17 Here, k means the starting year of the three-year rolling method, and ranged from 1993 to 2001.
18 One concern of this study was whether the CPI score changed significantly over time. Based on a period of nine years (1995~2003), we define eight dummy variables (denoted as Y96, Y97, Y98, Y99, Y00, Y01, Y02 and Y03) to capture changes that took place over the period of the study.
Table 1. News Reported about Corruption. Panel One. Raw Data
Display large image of Table 1
Panel Two. Results of Multivariable Regression

Display large image of Table 2
19 The score and standard deviation of the CPI is specified as:
CPI (S,SD) = β0 + β1 (NEWS) + β2 (ϒ96) + β3 (ϒ97) + β4 (ϒ98) + β5 (ϒ99) + β6 (ϒ00) + β7 (ϒ01) + β8 (ϒ02) + β9 (ϒ03) + ϵi20 Here, CPI (S, SD) refers to two dependent variables (Score and Standard Deviation of CPI), NEWS is the cross-section-time variable based on the three-year rolling data (ñ it), Y96~Y03 refer to the time dummy variable indicating the change for year 1996~2003 respectively from the baseline (1995), ß1 is the regression coefficient to be estimated, and E i refers to the error terms.
21 While Table 1 only shows the 2003 CPI score, data from other years can be obtained from the TI website (www.transparency.org).
Panel Three. Results of Regression for Four Groups
Results
22 Hypothesis 1 is supported. Panel two in Table 1 shows that there is a strong relationship between the CPI score and the news reported by WSJ, with an R2 ~ 23.4% overall. A negative coefficient (-1.401) refers to countries with heavy corruption (indicated by smaller CPI values) that are more frequently reported by WSJ.
23 Hypothesis 2 is rejected. There is no time-oriented change in the perceived corruption score, and insufficient evidence to suggest that methodological changes would mislead yearly comparisons. However, Table 1 shows a slightly converging trend of annual published standard deviation of the CPI score from each respondent. Year-to-year learning behavior and the cognitive schema (Fiske & Taylor, 1991) may account for this trend over the past nine years.
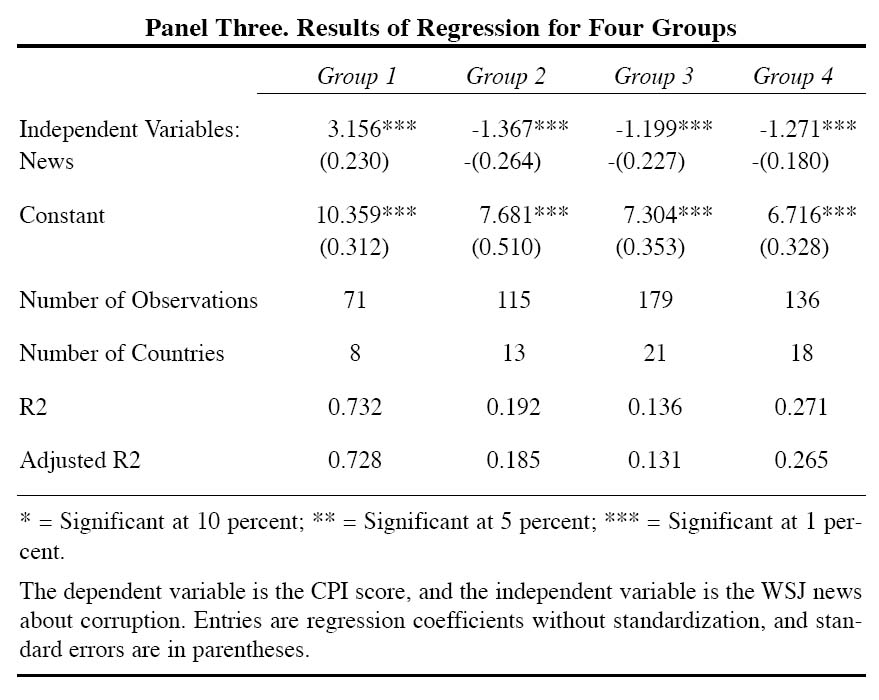
24 To test hypothesis 3, we clustered the 60 countries/regions into four groups using the Euclidian distance based on the variable Frequency of news. Due to its large distance from other countries, the U.S. was classified as one single group. The other 59 countries were classified into four other groups using the k-mean method. Many reasons beside economic influence may account for the extremely high value of Frequency of news2 for the U.S. Therefore, we subsequently combined the U.S. into the nearest group (Group 1) to make correlation analysis more reasonable in its sample size. The four-group partition reflects well the influential position of each country. Group 1 contains eight strong countries (U.S., Japan, China, United Kingdom, Germany, Canada, France, and Russia), all of which have a powerful impact on global business. Group 2 has less influence and power than Group 1, and contains the 13 countries. Countries in Group 3 (21 countries) and Group 4 (18 countries) make up the remainder of those in our study.
25 As panel three in Table 1 shows, different groups report different sensitivity for CPI value with respect to WSJ news. The correlation coefficient for Group 1 is extremely high (R2=0.732). Although also significant, Group 3 is much lower (R2=0.136). Therefore, hypothesis 3 is supported.
Discussion
Ballantine Illustration
26 Previous literature shows that cultural value is one important latent variable in determining differences in corruption for countries. For example, Husted’s comparative study (1999) of 44 countries has shown that corruption is significantly correlated to three cultural dimensions. Getz and Volkema confirmed the positive relation between power distance and corruption level (Getz & Volkema, 2001), and Houston and Graham (2001) suggest that relationship-oriented countries (higher power distance and lower individualism) tend to be more corrupted. Hence, we introduce cultural as another independent variable influencing corruption. The improved multivariable regression model of CPI score is as follows (due to their insignificant effect, the time dummy variables are omitted):
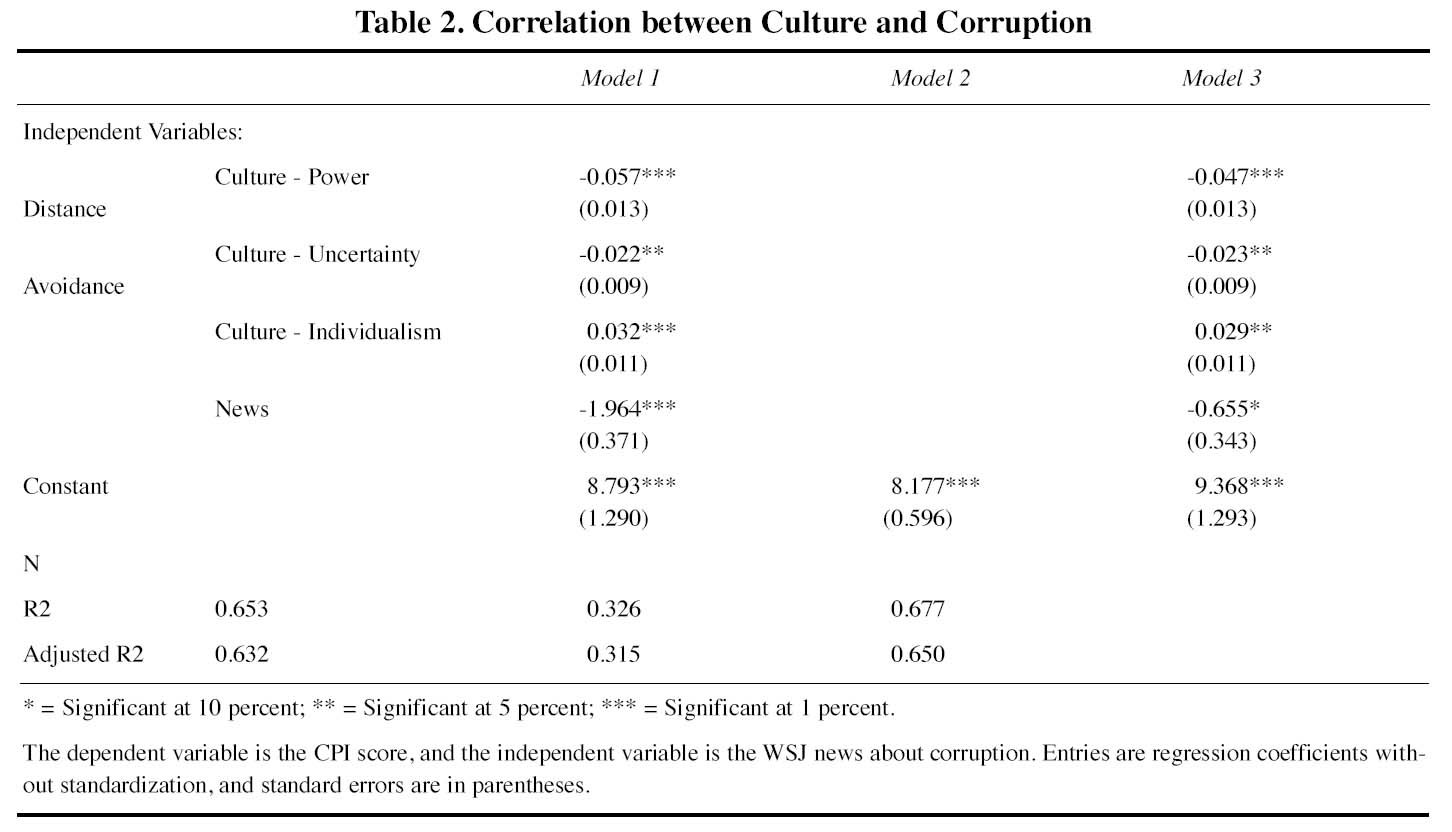
CPI = β0 + β1 (NEWS) + β2 (CULTURE) + ϵi27 Our data agrees with the previously mentioned studies. As Table 2 shows, exceedingly high correlation exists between three cultural dimensions (power distance, uncertainty avoidance, and individualism) and the nine-year averaged CPI score (Model 1, simple regression model with CULTURE as the single independent variable). Two other regression models were also conducted: regression of the nine-year averaged news data on the nine-year averaged CPI score (Model 2, simple regression model with NEWS as the single independent variable), and the regression of cultural values and WSJ news on the nine-year averaged CPI score (Model 3, multiple regression model with NEWS and CULTURE as the independent variables). Both these models have shown significant correlations.
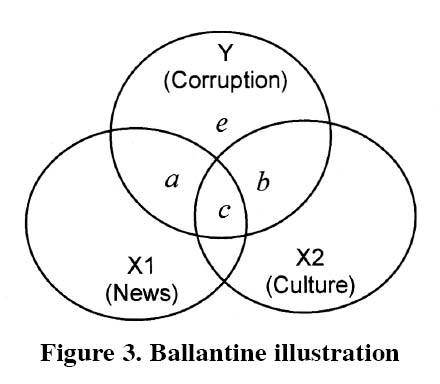
28 We adopted partial correlation analysis to examine exact causality among these three variables: CPI (denoted as Y), NEWS (denoted as X1) and CULTURE (denoted as X2). The Ballantine method suggested by Cohen (1983) provides a good visual illustration of this causality (Figure 3).
Table 2. Correlation between Culture and Corruption
Display large image of Table 4
Display large image of Figure 3
29 According to above, we have:
- Correlation coefficient in Model 1: r2Y2 = b + c = 0.632
- Correlation coefficient in Model 2: r2Y1 = a + c = 0.315
- Correlation coefficient in Model 3: R2Y•12 = a + b + c = 0.650
30 Thus, the four parameters reflecting different parts of variance in Figure 3 can be calculated as:
- a = 0.018
- b = 0.335
- c = 0.297
- e = 1– (a+b+c) = 0.297
31 When X2 (CULTURE) is partial from both Y (CPI) and X1 (NEWS), the correlation coefficient is:

32 When X1 (NEWS) is partial from both Y (CPI) and X2 (CULTURE), the correlation coefficient is:

33 According to the above result, cultural impact upon corruption still remains after removing the effect of WSJ news. Conversely, WSJ news can hardly contribute any further reduction of variance after removing the proportion associated with cultural value. This suggests that WSJ news cannot be regarded as one exogenous variable, and its effect has been mostly explained by cultural values. Thus, the assumed causality between WSJ news and CPI score has disappeared in this situation, which implies that we cannot say that WSJ news will affect the perception of corruption.
34 Pavarala has summarized the causes of corruption found in the literature as "administrative/bureaucratic, political, economic, and cultural"(Pavarala, 1996: 81). According to statistical principles, a more complex model with more independent variables will not reject our above finding, a fact that we found after conducting further analysis.
Validity of Finding
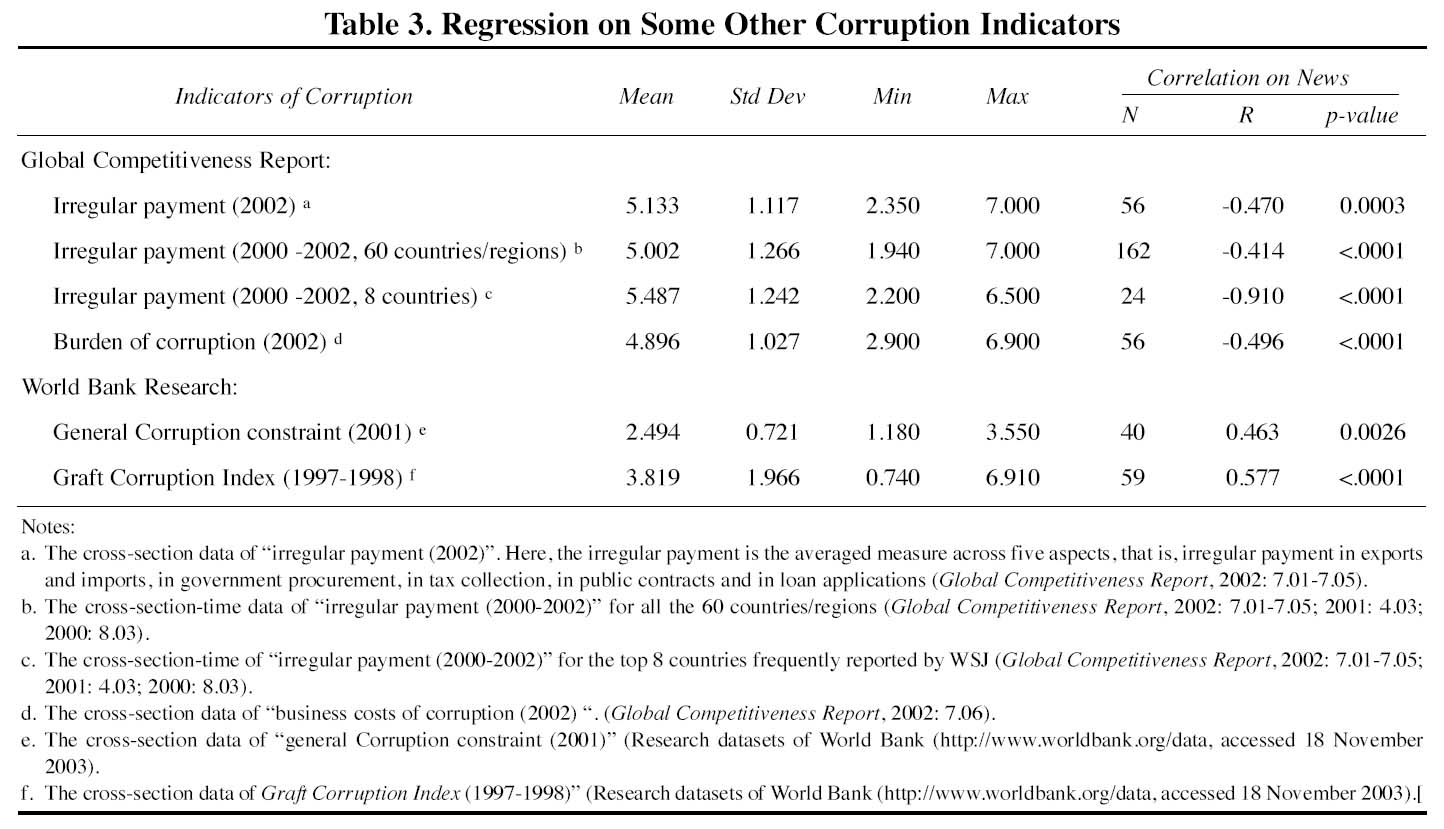
35 There are other indicators of corruption beside the TI CPI. Kaufmann, Kraay, and Zoido-Lobaton (2001) have developed a Graft Corruption Index that includes scores for 155 countries. Despite some substantial differences in data collection method, their dataset is almost identical to that of CPI, correlated at 0.98 (Knack and Azfar, 2001). In the annual Global Competitiveness Report (GCR), two other indicators of corruption (Irregular payments and Burden of corruption) are also included, and both are scaled from 1 to 7, with smaller scores implying higher levels of corruption (Schwab, Porter, Sachs & World Economic Forum, 1999; 2000; 2002). The World Business Environment Survey (WBES) is a World Bank Group initiative that assesses the enabling environment for private enterprise in a large number of countries. This survey has an important indicator of corruption called General corruption constraint.
36 Table 3 presents the statistics of these frequently cited indicators of corruption, and their correlations to the WSJ news. All the correlations are strong (i.e. all p-values are less than 1%). As in the CPI case, the cross-section-time correlation for the eight strong countries is still extremely high (R = -0.910, p-value < 0.0001). The rejection of the causal assumption between CPI score and WSJ news does not reduce the value of the current study. Instead, we believe that WSJ news can be regarded as another indicator of corruption for each country.
Conclusion
37 The current study examined the relationship between corruption news in the WSJ and the CPI. Based on our dataset of news for 80 countries, the cross-section-time regression analysis suggests a strong correlation between these two variables. Time does not matter to the CPI score across the past nine years, with only a slight converging trend of the dispersion of CPI value given by the different respondents. After clustering the 80 countries into four groups according to their appearing frequency in WSJ, we found out that correlation in the four groups varies greatly. Group 1 includes eight strong countries (United States, Japan, China, United Kingdom, Germany, Canada, France, and Russia) and shows extremely high correlation.
Table 3. Regression on Some Other Corruption Indicators
Display large image of Table 5
38 The practical application of our findings is important. WSJ news concerning corruption can be viewed as a one valuable data source to add to the corruption index, especially for the eight strong countries. Additionally, when compared to costly worldwide surveys, this indicator has the advantage of being low-cost and high-convenience.
39 From a theory-development standpoint, our study enhances understanding of the perceived corruption index because WSJ news can be regarded as the filtered result of corruption information after the perception of worldwide journalists and editors. Interestingly, irrespective of the different background of respondents, their taste seems to correlate soundly. This finding shows the robustness of perceptual figures, and contributes to understanding of real levels of corruption. Another implication of this study to theory is its illustration for exploring causality. The strong association between WSJ news and CPI score may lead to incorrect assumptions, but after introducing culture into our model, the partial correlation convinced us that there is no causal relation between these two variables. The Ballantine Illustration has provided a further and clear explanation about causality in general.
40 As always, one must exercise caution when generalizing from one study. An important limitation of our study was potential error in the data collection process. In searching for news items for each country, we simply used items with an exact match for the word "corruption", even though this may have caused some miscounts (for example, some positive reports about anti-corruption actions may have been mistaken as negative). However, we expect that the uniform collection method across all the countries may reduce this bias to an acceptable range. Another limitation of this study was its small dataset. Although the cross-time-section collection method considerably expanded our sample size, the number of observations for each country is relatively small, which made some more rigid methods of analysis impossible.
Acknowledgments
We gratefully acknowledge the helpful comments on this paper from professor John L. Graham, and thank the NSFC (No. 70372032) and Middle and Youth Academic Talents Training Program Foundation (UESTC) for providing the funds for this research.References
Ali, A. M. and Isse, H.S. (2003). Determinants of Economic Corruption: A Cross-country Comparison. Cato Journal. 22 (3): 449-466.
Brunetti, A., Kisunko, G. and Weder, B. (1997). How Businesses See Government: Responses from Private Sector Surveys in 69 Countries. The World Bank: Washington, D.C.
Coase, R.H. (1979). Payola in Radio and Television Broadcasting. Journal of Law and Economics. 22: 269-328.
Cohen, J. and Cohen, P. (1983). Applied Multiple Regression / Correlation Analysis for the Behavioral Sciences, 2nd Ed. Lawrence Erlbaum Associates: New Jersey.
Fiske, S.T. and Taylor, S.E. (1991). Social Cognition, 2nd Ed. McGraw-Hill: Toronto.
Getz, K.A. and Volkema, R.J. (2001). Culture, Perceived Corruption, and Economics. Business and Society. 40 (1): 7-31.
Gwartney, J. and Lawson R. (2003). Economic Freedom of the World: 2003 Annual Report. The Fraser Institute: Vancouver.
Houston, R. and Graham, J.L. (2001). Culture and Corruption in International Markets: Implications for Policy Makers and Managers. Consumption, Markets and Culture. 315 (3): 207-343.
Husted, B.W. (1999). Wealth, Culture and Corruption. Journal of International Business Studies, 30 (2): 339-59.
Kaufmann, D., Kraay, A. and Zoido-Lobaton, P. (1999). Governance Matters. http://info.worldbank.org/governance (accessed 12 November 2003).
Knack, S. and Azfar, O. (2001). Trade Intensity, Country Size and Corruption. Economics of Governance. 4 (1): 1-18.
LaPalombara, J. (1994). Structural and Institutional Aspects of Corruption. Social Research. 61 (2): 325-350.
Macrae, J. (1982). Underdevelopment and the Economics of Corruption: A Game Theory Approach. World Development. 10 (8): 677-687.
Oldenbury, P. (1987). Middlemen in third-world corruption: Implication of an India Case. World Politics. 39: 508-535.
Pavarala, V. (1996). Interpreting Corruption, Elite Perspectives in India. Sage Publications: Thousand Oaks.
Schwab, K., Porter, M.E., Sachs, J.D. and World Economic Forum (2000). The Global Competitiveness Report 1999. Oxford University Press: Oxford.
Schwab, K., Porter, M.E., Sachs, J.D. and World Economic Forum (2001). The Global Competitiveness Report 2000. Oxford University Press: Oxford.
Schwab, K., Porter, M.E., Sachs, J.D. and World Economic Forum (2002). The Global Competitiveness Report 2001-2002. Oxford University Press: Oxford.
Shleifer, A. and Vishny, R.W. (1993). Corruption. Quarterly Journal of Economics. 108 (3): 599-617.
Transparency International (2003). Corruption Perceptions Index 1995-2003. http://www.transparency.org (accessed 10 November 2003).
Endnotes