Volume 1 Number 1 June 1998
This paper develops and tests a model of the determinants of productivity in twenty computerized offices of the Internal Revenue Service. The results suggest first, that management's focus on machine monitoring statistics is misguided; second, that performance feedback has a significant effect on productivity; and third, that job experience plays a central role in productivity even in entry-level positions.
Much has appeared in the organizational behaviour literature in recent years on the introduction and impacts of information technology in the workplace. For instance, controversial questions regarding the effects of information technology on job enrichment and workforce skills have been raised (Barley, 1988; Chalykoff and Sterniczuk, 1989; Medcof, 1989; Long, 1991; Griffith, 1993). Still others have questioned the "productivity payoff" from information technology, suggesting that it has not lived up to expectations in office settings ( Metcalfe, 1992; Loveman, 1991). A further set of related questions has evolved around whether or not the recording and reporting of machine statistics, for example the number of seconds taken to answer a telephone call or time required to work a case through to completion, increases or decreases productivity and service quality (Grant and Higgins, 1989). Despite the intensity with which these issues are contested, there is surprisingly little hard empirical evidence.
Indeed, very few systematic empirical studies of the impact of information technology in offices have been done. Moreover, none of the previous studies has examined the determinants of office-level productivity in the context of information technology. What role, if any, do such factors as workforce skills, performance feedback via the utilization of machine statistics and job experience play in the performance of automated offices? This paper, taking advantage of a unique data set consisting of monthly performance indicators for twenty offices of the Internal Revenue Service (IRS) explores these important questions.
CONCEPTUAL MODEL
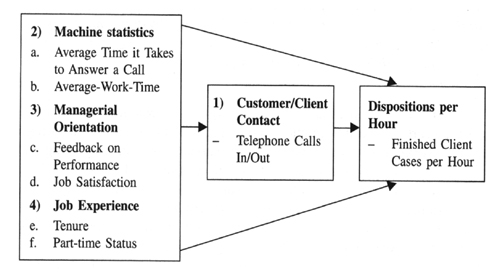
Because no previous study has developed and tested a theoretical model related to office-level productivity, interviews were conducted in five automated offices of the United States Internal Revenue Service (IRS) to explore factors that are likely to have an impact on productivity in these settings. Based on the interviews, four factors emerged as important to understanding office-level productivity (dispositions per hour) in automated offices which handle a large volume of "cases." Working from right to left in Figure 1 above, dispositions per hour is a function of: 1) the amount of customer/client contact, 2) the use of machine statistics, 3) managerial orientation toward control or feedback, and 4) employees' job experience. The justification for each of these factors is presented below.
FIGURE 1
1) Customer/Client Contact
At the heart of large-volume office operations such as collection agencies,
insurance companies, airline and hotel reservations is the telephone system
which in automated offices is integrated with micro-computers. Because
very little can be collected without calls placed or received, this factor
is central to understanding office-level productivity. Moreover, based
on the interviews, it was not clear whether concentrating on outgoing or
on incoming calls led to higher overall productivity. For example, one
manager stated:
We had a new emphasis (on statistical indicators) every week. We could never decide whether to concentrate on incoming calls or outgoing (calls). There was a point when we cut down the number of outgoing calls because of the number of incoming calls that we received, but the number of dispositions fell drastically.However, managers in another office stated that they stopped concentrating on outcalls and placed emphasis on the calls received because too many outcalls could not be completed. Regardless of whether an office concentrates on outcalls or calls received, the number of customers/clients contacted should be positively correlated the number of productive dispositions.
Customer/Client contact is placed in the model as an endogenous (dependent) variable because while it is expected to have a direct influence on dispositions per hour, it is in turn influenced by several independent factors such as employees' job experience and performance feedback.
2) Machine Statistics
The first independent factor included in the model is machine statistics.
As noted in the introduction, there is considerable debate over their use
or "abuse." One of the more controversial statistics in an automated office
is average-work-time. It is the amount of time, usually measured in seconds,
it takes an employee to handle a "case" which - depending on the industry
- may be an air or hotel reservation, a complaint or insurance claim, and
so on. Proponents of this statistic argue that the lower the average-work-time,
the higher the productivity. The number of cases handled should increase
because fewer employees handle more cases in shorter periods of time. The
critics, however, argue that both quality and productivity is likely to
suffer since employees being judged on this statistic rush the work, leading
to errors and dissatisfied customers/clients. In the organization studied
there was debate about the worth of this particular performance statistic.
This was summed up by one manager as follows:
At one time a hot statistic was average work time. Now we stress quality, the one-call concept. We set up the one-call concept where we fill out the financial statement over the phone, eliminating one or two telephone calls down the road.Thus, in this instance the manager felt that both quality and overall productivity would increase if the average-work-time statistic was not stressed, but rather employees were encouraged to work each case as completely as possible, thereby eliminating problems "down the road." On the basis of the interviews, therefore, stress on machine statistics is likely to lead to a lot of activity, i.e., customer/client contact but not necessarily to increased productivity, i.e., case dispositions.
3) Managerial Orientation
Another important independent factor in the model is management's orientation
toward the use of performance information. In computerized offices, both
the focus on statistics and the feedback on these statistics generated
by computers and human supervisors concentrates employees efforts (Grant
and Higgins, 1989). Indeed the U.S. Congress office of Technology Assessment
(1987) noted the salience of performance feedback in situations where computer
generated machine statistics are available or used. Chalykoff and Kochan
(1989) found that performance feedback was central to understanding employees
job satisfaction and turnover in automated offices. In the interviews managers
were unanimous in stating that the "key to production is feedback." Thus,
variables in the model intended to capture management's influence on productivity
are the amount of performance feedback provided to employees and employees'
job satisfaction.
4) Job Experience
The final stage of the model examines the effects of job experience
on productivity. Much like the first production lines in manufacturing,
the advent of systematically computerizing office work has led some observers
to argue that information technology facilitates the breaking down of jobs
in fine detail. Furthermore, that the monitoring capabilities enforce the
strict adherence to company "scripts" leaving less and less decision making
or "brain work" to the worker (Shaiken, 1987). In this way management has
more control over the production process and the workers become interchangeable.
If this assessment is correct, then turnover, should have little effect
on productivity. Indeed, this was suggested by one senior manager who stated;
"I think there is a very minimal performance effect due to turnover."
However, the majority of senior managers felt differently. They attributed productivity problems to high turnover. One manager noted: "A major weakness is the experience throughout the place. There is high turnover among the employees." One of the problems with turnover, according to these managers, was that the most experienced employees had to train the new employees, leaving the experienced employees unavailable for case work.
Further aggravating the experience issue, the Automated Collection System made extensive use of part-time employees. These part-time employees were used for a variety of reasons. Principal among these reasons was the ability to handle fluctuations in the work, but they were also used as a cost-cutting tool. None of the managers interviewed were satisfied with their experience with part-time employees. The following statements are indicative of their feelings.
We had problems because we hired a lot of seasonal people who didn't want seasonal work.Therefore, to capture the effects of job experience on productivity, tenure of employees and the percentage of part-time employees in an office are included in the model.A weakness is a lack of ability to hire permanent employees. We lost a lot of good employees that way.
Employees who aren't permanent usually have lower morale.
HYPOTHESES
As constructed, the model (Figure 1) is a mediational model. A central focus is on the indirect effects of the exogenous constructs and the direct effects of customer/client contact on dispositions per hour. Put another way, the model tests for the centrality to automated offices of customer/client contact, both as a direct determinant of productivity and as a mediator of other factors that are expected to influence productivity. The above discussion can be summarized into two formal hypotheses.
Hypothesis 1: The indirect effects of the exogenous constructs, acting through customer client contact will have a significant influence on dispositions per hour.METHODHypothesis 2: Customer/client contact has a significant influence on dispositions per hour.
Organizational Setting
In the early 1980s, the Internal Revenue Service (IRS) decided to completely
automate its (tax) Collection Office Function (COF). The old system, comprised
of 63 offices, was replaced by the new Automated Collection System (ACS)
which consisted of 20 offices. The number of employees was reduced from
5,000 to 2,500. In 1985, a performance report comparing the old and new
systems revealed that the dollars collected in fiscal 1985 exceeded the
1982 collections by 40 percent and the 1983 collections by 17 percent.
Man years used declined by 48 percent over 1982 and 52 percent over 1983.
This very large improvement in productivity represented resource savings
of 58 million dollars and 49 million dollars over 1982 and 1983 respectively.
The above numbers represent hard evidence that productivity improved with
the introduction of the technology. This paper seeks to expand on that
knowledge by examining the factors, over and above the technology, that
effect productivity in computerized offices. We now turn to a brief description
of the work and technology used in the Automated Collection System.
Work Process and Technology
The primary task of ACS is the collection of over-due taxes. Each office
is essentially a computerized telephone operation, making outgoing and
taking incoming calls. In terms of technology in these offices, ACS is
a computerized telephone tax-collection system consisting of three computer
components: IBM, Rockwell ACD (Automated Call Distributor), and IDRS (Integrated
Data Retrieval System). The Integrated Data Retrieval System (IDRS) is
a master computer located in the Service Centres (tax processing offices)
and linked to the ACS call sites. The IDRS computer furnishes ACS with
its accounts and provides relevant updates to accounts. The IBM computer
system consists of a mainframe which contains the database of ACS accounts
and controls work processing, on a priority basis, to several terminals
manned by account representatives. The Rockwell Automated Call Distributor
(ACD) system provides for the most cost effective routing of outgoing telephone
calls and allows for the routing of incoming calls to available employees.
It automatically connects all incoming and outgoing telephone lines to
employee terminals, which allows for a large volume of calls to be handled
simultaneously. These computer systems represent the heart of the ACS operation.
Besides aiding and controlling the work process, they provide management
with "real-time" indicators of performance.
The advantage of these research sites is that all of the twenty offices have the same technology and carry out the same work. Therefore, possible differences in productivity among offices are not attributable to the work done or differences in technology.
The authors gained access to several large sets of operating and personnel data a little more that one year after all sites were operating under the new system. Moreover, in 1986-1987, the authors conducted interviews and a questionnaire survey of employees in these offices.
Data
The main data set used in this study spans the twenty-one month period,
October, 1985 to June, 1987. It is a crossectional, time-series data set
consisting of 420 observations (twenty offices over twenty-one months).
Although all the offices were automated by the middle of 1984, performance
indicators were not systematically collected until 1985. The data ends
in 1987 because that is when the research project ended. Putting together
this data set was extremely costly and time consuming. The variables were
put together from twenty-six different data tapes.
Twenty-one of these tapes dealt with personnel reports. These tapes had personnel statistics for all two thousand employees for each month. From these tapes, statistics on the average tenure variable as well as the percentage of part-time employees in an office were created. Another data tape provided the number of cases disposed of in each office, each month over the time period; while yet another tape provided the number of hours used by the office each month. These two data sources were used to construct the dependent variable, dispositions per hour. Three more data tapes contained performance indicators taken from the Automated Call Distributor reports. Specifically, the number of telephone calls made and received, and the number of calls answered. All of the above variables were constructed on a monthly basis.
The model tested (Figure 2) represents a structural equation system with observed variables. The means and standard deviations of all variables used in the analysis are presented in Table 1. An explanation of how each variable was created is presented below.
FIGURE 2 Structural Equation Path Analytic Model of Determinants of Productivity in Automated Offices
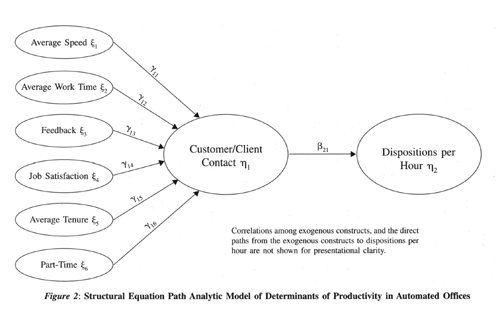
TABLE 1 Means and Standard Deviations (SD) of all Variables
| Construct | Mean | SD |
| 1. Dispositions per Hour (number) | .52 | .14 |
| 2. Customer/Client Contact (number) | 2.03 | .58 |
| 3. Average Speed (seconds) | 84.61 | 67.79 |
| 4. Average Work Time (seconds) | 263.81 | 172.06 |
| 5. Feedback (scale) | 12.28 | 1.24 |
| 6. Job Satisfaction (scale) | 17.12 | 2.31 |
| 7. Average Tenure (years) | 2.86 | 2.31 |
| 8. Part-Time (percentage) | .30 | .15 |
Dispositions per hour: This variable was created by taking the productive dispositions per office, per month and dividing by the number of hours used by the office per month. For the 20 offices, over the twenty-one months, the mean number of dispositions was .52 per hour with a standard deviation of .14.
Customer/Client Contact: This variable was created by taking the number of outcalls made and the number of calls received in the offices each month and dividing by the number of hours used by the offices. Thus, customer/client contact is the average number of calls placed and received per hour of time allocated. For these offices over the period the average calls per hour was 2.03 with a standard deviation of .58.
Average Speed of Answer: It is measured by the number of seconds that customers/clients were on the telephone line before their call was picked up. The longer the average-speed-of-answer, the higher the number of clients/customers that are lost. On average people calling ACS waited one and one-half minutes before their call was answered.
Average-work-time: This measure is taken from the Automated Call Distributor report in ACS. It is a measure of the number of seconds that employees are engaged with customers/clients. For these offices as a whole, the average-work-time was 263 seconds or approximately four and one-half minutes with a standard deviation of 172 second or almost three minutes.
Performance Feedback: This construct is comprised of three items taken from a questionnaire administered in February of 1987 and responded to by 740 employees in the 20 offices. The items, responded to on seven point scales, (1=none; 4=some; 7=a lot) were: How much feedback do you receive on 1) your individual performance, 2) your unit's performance, and 3) the call site's performance? Cronbach's alpha for this scale was .79 indicating an acceptable level of reliability. The mean response to the feedback construct for each office was used to construct a variable that was analyzed in the crossectional time-series equation such that each office had the same value for performance feedback over the twenty-one months. For this to be meaningful one must assume that the level of feedback remains fairly constant in these offices over time. This implies that management styles and practices did not radically change over the period under study, a reasonable assumption given the bureaucratic nature of the agency studied. The mean response on this three item feedback scale for all offices was 12.5, with a standard deviation of 1.23.
Job Satisfaction: This variable was created from five items taken off the February, 1987 questionnaire. The items responded to on seven point scales (1=very dissatisfied; 4=neither satisfied nor dissatisfied; 7=very satisfied) were: How satisfied are you with 1) your job, 2) your pay benefits, 3) promotion opportunities, 4) the recognition you receive for a job well done, and 5) the amount of say you have in how the work is to be done. Cronbach's alpha for this scale was .78 indicating an acceptable level of reliability. It was created in the same manner as the feedback variable, above. The mean of this variable was 17.12 with a standard deviation of 2.31.
Average Tenure: Average tenure per office was created by subtracting each month in the data set from the employee's on-duty-date (date they started with the Collection Division of the IRS). In each month, for each office, these numbers were summed and then divided by the total number of employees in the office. The tenure of employees averaged 2.86 years with a standard deviation of approximately one year.
Employment Status: This variable was created by adding the number of employees on part-time status and dividing by the total number of employees in the office in that month. The average percent of part-time employees was 29 percent with a standard deviation of 14 percent.
RESULTS
The model (Figure 2) was tested using LISREL 7 with maximum likelihood estimation (Joreskog and Sorbom, 1989). The coefficient of determination, R2, for the structural equations jointly was .346 (Table 2). The amount of variation explained for the equation predicting customer/client contact was 1 -_ equals .306, and for dispositions per hour 1 -_ was .27. These results indicate that a substantial amount of variation in the dependent variables were explained by the predictors.
TABLE 2 Maximum Likelihood Estimates for the Model in Figure 1 (Direct Effects)
| Causal paths | Standardized ML estimate | t value |
| Endogenous construct | ||
| g21 | .449* | 8.901 |
| Exogenous construct | ||
| g11 | -.268* | -6.363 |
| g12 | -.239* | -5.486 |
| g13 | .061 | 1.246 |
| g14 | .272* | 6.024 |
| g15 | .144* | 3.003 |
| g16 | .306* | 6.002 |
| g21 | -.020 | -.433 |
| g22 | .059 | 1.277 |
| g23 | .183* | 3.655 |
| g24 | .005 | .108 |
| g25 | .183* | 3.676 |
| g26 | .121* | 2.222 |
| Error term variance for endogenous constructs | ||
| y11 | .694 | |
| y22 | .730 | |
*Significant at p<.05
Summary statistics:
GFI = 1.000
RMR = 0.000
R2 = .346
N = 420
Support for Hypotheses
Table 3 shows that all of indirect effects1 on dispositions per hour
through customer/client contact were significant2 except for the indirect
effect of part-time employees. These were, average speed of answer (indirect
effect g11 * b21=-.12, p.<.05), average-work-time (indirect effect equals
-.107, p,<.05), feedback (indirect effect equals .027, p<.05), job
satisfaction (indirect effect equals .122, p<.05) and average tenure
(indirect effect equals .065, p<.05) Moreover, customer/client contact
had a significant influence on dispositions per hour, b21=.449; (p<.05).
Thus, both hypotheses were supported.
TABLE 3 Direct, Indirect, and Total Effects of Exogenous Constructs on Dispositions per Hour (Standardized Coefficients)
| Construct | Direct effects | Indirect effects1 | Ratio indirect/direct effects | Total effects |
| Average speed | -.020 | -.120* | 6.00 | -.140 |
| Average work time | .059 | -.107* | 1.81 | -.048 |
| Feedback | .183* | .027* | .15 | .210 |
| Job Satisfaction | .005 | .122* | 24.40 | .127 |
| Average tenure | .183* | .065* | .36 | .248 |
| Part-time | .121* | .137 | 1.13 | .258 |
DISCUSSION
Debates about the impact of information technology in large-volume office operations on the role of machine statistics, performance feedback and employee skills on productivity have taken place in an empirical void, or at best have been explored with anecdotal evidence. This study was the first attempt we know of to provide hard data on these issues.
Managerial Implications
The first implication to be drawn from these results is that the choices
managers make in terms of which machine statistics to stress make a difference
to the productivity of their offices. These results suggest that concentrating
on the time employees take to handle a case, average-work-time, may be
misguided. While shorter periods of time handling a case does increase
the number of customer/clients dealt with, it does not increase the number
of productive dispositions. Indeed, average work time, though not statistically
significant, had a positive effect on dispositions (g22=.059, t=1.27).
This result suggests that the more thoroughly employees work a case the
higher the productivity of the offices.
When discussing the use of machine statistics, managers in the offices studied often felt that the organization went overboard in both their faith in the statistics and the emphasis on them. As one manager stated: "We need to be reasonable about the statistics. No knee-jerk reactions to the statistics." Thus, the statistics are helpful as a guide, but should not become an end in themselves.
The results confirm the importance of performance feedback to office-level productivity. To date, much of the empirical evidence on the role of performance feedback in automated offices has been in connection with its effects on employees response to monitoring (United States Congress of Office Technology, 1987; Chalykoff, 1988), and its effects on employee outcomes (Grant and Higgins, 1989; Chalykoff and Kochan, 1989). While this result does not reveal how to structure the feedback, it suggests, given the items in the construct, that a multi-level approach to feedback is effective. That is, feedback should be provided on the individual, unit, and office levels. For more process oriented information on structuring performance feedback see Ilgen, et. al., (1979), and Chalykoff, (1988).
The impact of average tenure on productivity suggests that the experience of the workforce makes a significant difference to office productivity. This is similar to findings of studies in the automobile industry where it was discovered that automation by itself does not lead to higher productivity (McDuffie and Kraftic, 1992). The result of the tenure variable further suggests that these jobs have not been deskilled or that employees are easily interchangeable. This implies that management needs to be concerned with turnover in these settings. Granted, since these are primarily entry-level jobs a certain amount of turnover is internal to the organization, however, turnover is frequently caused by personnel policies and management practices (Chalykoff and Kochan, 1989). For example, as discovered in the interviews conducted for this study, the part-time status of many employees causes them to leave at the first opportunity. Based on the positive relationship between employee experience and productivity, organizational practices and policies designed to retain experienced employees deserve considerable attention in these work settings.
Generalizability
For this research study, the population of interest is automated, large-volume
office operations. These offices have important similarities. First, the
work is relatively routine in nature; that is even though the work is "case"
based, the procedures for handling cases is highly prescribed. Second,
the technology used in these offices is fairly standard. Third machine
monitoring is unlikely to be very different across organizations; the phenomenon
is the same. Indeed, the work setting and monitoring in the New York Telephone
Company (as described by Anger, 1970) was very similar to that in ACS.
The major difference is that micro-computers allow supervisors greater
monitoring capability.
Differences among organizations will exist in terms of approach to
their operations, both in terms of organization and management practices
and policies. Thus, to the extent that this study adds insight into effective
approaches to organization and management of automated offices, the findings
should be generalizable to all similar settings.
Research Extensions
This research is the first that we know of to examine the determinants
of productivity in computerized offices. Many more studies are needed to
test and build on the model presented. At a minimum, the model of productivity
developed in this paper should be tested in private sector organizations
to test its generalizability.
CONCLUSION
The results of this study begin to provide some empirical evidence for debates about the impact of information technology on job skills and the role of machine monitoring (machine statistics), and performance feedback on productivity. Automating these offices did not, in this instance, have the effect of deskilling even these entry-level jobs. Moreover, while machine monitoring indicators are useful for focusing efforts, management needs to be careful that these indicators do not become an end in themselves and that they are meaningful within the particular work context. Finally, given a set of meaningful performance indicators, multi-level feedback is appropriate.
Notes
1. The indirect effect (Table 3) were calculated as a simple multiplicative measure of the relevant path coeeficients using the Simon-Blalock technique, a commonly used procedure in path analysis (Duncan, 1972; Pedhazur, 1982).
Return to Article
2. A test for the significance of indirect effects in path analytical models has been derived by Sobel (1982). The general formula is
Return to Article
REFERENCES
Anger, E.I. (1970). Inside the New York telephone company. New York Review Of Books, 49, 5, 16-24.
Barley, S.R. (1988). Technology, power, and the social organization of work: Towards a pragmatic theory of skilling and deskilling. Research in the Sociology of Organizions, 6, 33-80.
Chalykoff, J. (1988). Computer-aided performance monitoring of employees in large volume office operations, Ph.D. Thesis, Sloan School of Management, Cambridge, MA.
Chalykoff, J. & T. Kochan (1989). Computer-aided monitoring: Its influence on employee job satisfaction and turnover. Personnel Psychology, 42, 807-834.
Chalykoff, J. & H. Sterniczuk (1989). Information technology in large-volume office operations: Organizational change, supervisors' and employees' reactions. Eastern Academy of Management Proceedings, Portland, Maine.
Duncan, O.D. (1972). Path analysis: sociological examples. In Blalock H.M. (ed.) Casual models in the social sciences (pp. 115-138), Chicago, IL: Aldine-Atherson.
Grant, R. & C. Higgins (1989). Monitoring service workers via computer: The effects on employees' productivity and service. National Productivity Review, 8, 101-112.
Griffith, T.L. (1993). Teaching big brother to be a team player. Academy of Management Executive, 7, 73-80.
Ilgen, D.R., Fisher, C.D., & M.S. Taylor (1979). Consequences of individual feedback on behaviour in organizations. Journal of Applied Psychology, 64, 349-371.
Joreskog, K.G. and D. Sorbom (1989). LISREL 7: User's reference guide. Mooresville, IN: Scientific Software, Inc.
Long, R. J. (1991). The impact of new office information technology on job quality in canadian firms. ASAC Proceedings, Niagra Falls.
Loveman, G. (1991). Cash drain, no gain. Computerworld, 25, 69-72.
McDuffie, J.P. & J. Kraftic (1992). Integrating technology and human resource management in the world automobile industry. In Transforming Organizations, T.A. Kochan, and M. Useem (eds.) New York: Oxford University Press.
Medcof, J.W. (1989). The effect of extent of use of information technology and job of the user upon task characteristics. Human Relations, 42: 23-41.
Metcalfe, B. (1992). Economists and the productivity paradox. InfoWorld 14, 72.
Pedhazur, E.J. (1982). Multiple regression in behavioral research. New York: Holt, Rinehart and Winston.
Shaiken, H. (1987). "When the computer runs the office" (A threat to dignity forum) New York Times, March 22, p. F3.
Sobel, M.E. (1982). Asymptotic confidence intervals for indirect effects in structural equation models. In Leinhardt S. (ed.), Sociological Methodology, 290-312. San Francisco: Jossey-Bass.
United States Congress Office of Technology Assessment. (1987). Electronic supervisor: New technology, new tensions (Publication No. OTA-CIT-333), Washington D.C.: U.S. Government Printing Office.