Figure 1: the Organization Pay Line Together with
Associated Job Points and Pay Rates
Volume 4, No. 2 December 2001
by
Ross E. Azevedo
Industrial Relations Center
University of Minnesota, USA
and
James G. Scoville
Industrial Relations Center
University of Minnesota, USA
This paper depicts a picture of American compensation systems and practices in light of concerns for equitable treatment of workers. It raises questions about these practices in reference to racial, gender, and executive pay levels in the U.S., and points out that the principle of equity applied regularly has fallen short when interests and needs of particular groups have been examined. Addressing this shortfall in relation to equity concerns is the key policy challenge facing the American compensation manager.
INTRODUCTION
"The American way" of compensation management has evolved along routes particular to the way in which the U.S. economy developed over the past century. Indeed, as will be seen in what follows, the ways in which people are paid reflect a host of historical, economic, legal, political, social, and technological forces which have interacted on the American scene. Thus there are major events/movements which have formed and altered the way in which organizations have chosen to reward their employees and structured the process by which pay is delivered.
Pay in America may be described as based on considerations of external and internal equity although in different measures at different times. It is doubtful that any employer who reported on his/her pay system would claim anything other than that the issues of "equity" were what drove the system. Of course, what goes into that equity and how it is determined are crucial to the operation of any system.
The Current Scene
Several patterns characterize the current compensation situation in the United States. First is the relatively slow growth during the 1990s of the levels of pay of the typical worker. The US Bureau of Labor Statistics (BLS) provides data on the average hourly earnings of production workers and the consumer price index (for urban workers, 1982-84 = 100). From 1990 through the end of 1999, the earnings measure rose 3.2 percent per year while consumer prices rose 2.7 percent per year. This process yielded a modest 3.8 percent increase in real earnings over the nine years or 0.4 percent annually. Non-farm productivity (again, from the BLS) went up by more than 20 percent over the nine years, leaving a distinct sense that productivity gains have not been shared with the American worker to any substantial degree.
At the same time, concern has grown in the business and popular press over the compensation packages awarded to America's corporate leaders. The American Federation of Labor-Congress of Industrial Organizations (AFL-CIO) refers to "Runaway CEO Pay" on its Executive Paywatch web site. Citing Business Week, the labor federation notes that average CEO pay at major corporations rose from 42 times average production worker pay in 1980, to 85 times in 1990 and to a multiple of 419 times by 1998! Much of this, of course, is not salary but reflects various performance achievements, especially stock options which have done very well in the bull market of the 1990s. Nevertheless, a few years ago cynics took note of the $99 million pay packages granted to the two co-CEOs of Time-Warner and wondered what the figures would have been had the company actually made a profit over that year.
Finally, different educational attainments, geographic concentrations, and family responsibilities (among many factors) and differential access to opportunities have generated strong race and gender patterns in the earnings picture despite equity considerations on the part of individual employers. While (as we will see below) the rather technical systems for setting pay in America mean that "usually" two people standing side-by-side doing the same job for the same employer with similar lengths of service are paid the same, the other influences noted above shape overall earnings patterns. Thus, the National Committee for Pay Equity (using US Department of Commerce data) cites the following pay gap for 1997:
|
Race/Gender
|
Earnings
|
Earnings Ratio
|
| White Males | $ 35,193 | 100.0 % |
| White Women | 25,331 | 71.9 % |
| Black Men | 26,432 | 75.1 % |
| Black Women | 22,035 | 62.6 % |
| Hispanic Men | 21,615 | 61.4 % |
| Hispanic Women | 18,973 | 53.9 % |
While most of these earnings gaps have narrowed over the past two and a half decades – some quite substantially as in the case of white women whose average earnings rose from 58.7 percent to 73.7 percent of white male earnings – the relative earnings of Hispanic males have actually fallen, perhaps reflecting large scale immigration.
Underlying Principles
Pay in America may be described as based on considerations of external and internal equity – although in different measures at different times. It is doubtful that any employer who reported on his/her pay system would claim anything other than that the issues of "equity" were what drove the system. Of course, what goes into that equity and how it is determined are crucial to the operation of any system. The concepts of external and internal equity and their determination rest upon two distinct classifications of jobs and their treatment. The first group is the key or benchmark jobs; the second is the non-key or non-benchmark jobs a distinction simple in title but important in operation.
Key (or benchmark) jobs are those which link the organization to the labor market in that typically they are jobs into which new hires come and, as a result, provide measures of market pay. Through the use of wage and salary surveys of key jobs the organization is able to position itself relative to others in the market (i.e., establish external equity) and specify its competitiveness.
Non-key or non-benchmark jobs are those which are particular to the organization in that they are jobs into which individuals have been promoted and/or transferred as they have gained knowledge and experience which is specific to the firm. These jobs no longer meet the test of the market in that typically outsiders are not hired into them with a market pay rate identifiable. It is these jobs for which job evaluation is the tool of pay determination, a subject to which we now turn.
Internal Equity:
The Rise and Use of Job Evaluation Systems1
The focus on internal equity has led employers, consultants, and even unions in America to rely on job evaluation as a major part of the wage and salary determining processes. The definitions of job evaluation are straightforward. From the United States Employment Service we have:
...the process of determining the relative values of jobs in an organization so as to establish a wage classification system for that organization.
This obviously reflects the governmental approach to pay where governmental agencies typically use a job classification system; see below, pp. 9-11.
Another definition, from the private sector, reads:a formal process for determining the relative worth of various work assignments (Henderson, 1989).
While similar definitions could be listed extensively, the real issue in the above is the idea of "relative" worth of jobs within an organization. With rare exception, job evaluation systems have at their core the concept of equity attained through assessing the relative worth of jobs individually, vis-a-vis the other jobs within the organization. The primary differentiating factor among such systems are the varied processes used in these assessments.
Job evaluation had its beginnings, at least conceptually, in the 1800s when there were pleas at the federal level of government that jobs be paid based on their worth. By 1902 the United States Civil Service Commission was recommending that jobs be paid based upon duties performed in those jobs.
In the private sector, the first developments in job evaluation came through the work of Frederick W. Taylor at the Midvale Steel Company. His efforts to break jobs down into elements which could be used for "time-base rates" was the forerunner of today's job evaluation systems.
The early 1900s saw the first footsteps of job evaluation as it is known today. The Commonwealth Edison Company of Chicago is credited with introducing the first job classification plans circa 1909 as assessing the structure of jobs crept into human resources practices. This was largely the result of the introduction of job analysis the process of dissecting jobs into their constituent parts as well as specifying the knowledge, skills, and abilities (KSAs) associated with those components with its primary outputs: the job description and job specification.
In 1925, Merrill R. Lott formalized these developments in Wage Scales and Job Evaluation, which introduced the first of what we call today point factor systems of job evaluation. This work was followed on by efforts of the American Management Association and Relations Counselors. The National Metal Trades Association (NMTA) and the National Electrical Manufacturers' Association (NEMA) pushed for job evaluation systems as did the spread of "industrial unionism" in the 1930s. The Congress of Industrial Organizations unions, which organized the skilled and unskilled in the factory, needed a way to manage the differences in wages of these two disparate groups...something for which job evaluation provided the answers.
While job evaluation was on the increase in the early decades of the twentieth century, the trajectory was not steep. Most organizations still paid workers on a "personal" basis rather than on anything approaching a "scientific" or "rational" basis. This led to women being paid less because they "only were going to get married and leave," married men being paid more than single ones as "they had families to support," and similar ascription-based practices. There was, as yet, no major outcry for rationalization of pay systems and structures based on the job rather than its occupant.
That call for the use of job evaluation as a determinant of internal pay equity occurred as a result of World War II. The desire/need of the National War Labor Board to control wages was paramount to maintain economic stability; this necessitated a consistent, rational way to set pay rates. At least four drivers were pressing for some precise form of job worth assessment. First, the haphazard pay setting in most organizations led to a disarray of rates which would have been formidable to control. Second, the creation of thousands of "new" jobs for the war effort meant that there needed to be some way to determine what they were worth so they could be paid appropriately relative to existing jobs. Third, the shift from jobs which utilized high skilled workers to those which required lower skill levels, as the better workers went off to war, necessitated some way to translate the components of the old jobs to the new ones at the appropriate price. Fourth, the bidding of different firms for scarce labor led to competitive wage increases which were not tied to jobs or their worth. These pressures led from the simple to the complicated in job evaluation forms (Zollitsch and Langsner, 1970).
All forms of job evaluation base their measurement of the internal worth or "content" of jobs on what are termed "compensable factors." As will be evident in what follows, the idea of a compensable factor is treated in a variety of ways in different job evaluation programs again from the simple to the complicated as the designers of these systems have worked to obtain better measures of the worth of jobs to organizations. It is worth noting at this point that virtually all regulatory legislation defines compensable factors as "skill, effort, responsibility, and working conditions." The reader may reflect on this in the discussion which follows.
Ranking systems
Ranking, perhaps the simplest of systems conceptually, is a technique that uses the job as a totality to rank them from the top to the bottom of a hierarchy. Here the compensable factor is the job itself in that those who rate or rank the jobs are supposed to look at the jobs in their totality and generally compare them as complete units rather than dissecting them into any of their component parts. Of course, it is possible that some subjective comparison of internal job content (e.g., mental requirements, working conditions) may affect these determinations but the idea is to look at the job in total in order to rank it, making equity an ordered outcome only.
In practice, the entire organization may not be used and subsets of jobs perhaps by department, location, or business unit are often ranked as a group and then (perhaps) integrated with the other jobs in the broader universe (e.g., several departments combined into a division). It is the sheer volume of jobs which can burden and perhaps overwhelm the ranking system; because of this techniques including paired comparisons, alternative ranking, and group categorization have been developed to assist with the ranking process.
At the end of any of any of the ranking processes, the organization will have a list of jobs (or job groups) ranked from top to bottom (or the reverse). One major problem with this system, in the view of many, is that there is no way to quantify the relative differences among the jobs. The system is ordinal, it only gives you...as its name implies...the rank order of jobs and tells you nothing about the measured or relative differences among them. The limitation imposed by the ranking system becomes apparent when you try to link your internal data to the market. How do you equate market rates to internal rates?
One way to do this is to compare the organization's rates for key or benchmark jobs to the rates being paid in the labor market. Then adjust the organization's rates appropriately and move the rates for non-key jobs in what is deemed to be an appropriate manner.
This means that the two major issues with ranking systems are, first, explaining them and then, defending what has been done. While the systems are very simple on their faces, they do not provide any way for you to justify actions taken. This makes ranking systems' wage difference determinations very difficult to explain to workers and these differences problematic to defend in a legal action.
We note that even today, despite their difficulties, ranking systems are estimated to account for about 20 percent of all job evaluation methodologies used in the united states (Henderson, 1989).
Grade Description/Job Classification Systems
Grade description systems, often used by governmental bodies and other employers with wide varieties of disparate jobs, move a step up from ranking programs and begin to look at the equities among jobs and their composition through identified compensable factors although not as thoroughly as do the quantitative systems to be discussed below. They are based on the job description and job specification; but in a rather broad way.
Organizations which might have jobs employing economists, carpenters, physicists, chauffeurs, botanists, dish-washers, sociologists, and others could have difficulty attempting to compare broadly across them while trying to treat them equitably. The first task, then, of the designer of a grade description system for such a situation is to determine how many "grades" or "classes" to utilize to capture the range of job tasks within the organization while allowing them to be grouped in relatively "homogeneous" groups. Large numbers of such classes mean the relative differences between jobs may be easier to identify while making the task of such identification more difficult; small numbers of grades make larger numbers of jobs look more alike while making identification of different job tasks less important in segregating jobs. Usually, there are from 12 to 15 classes although some employers may utilize 20 or more.
Once the appropriate number of grades is determined, then employers group common elements, or compensable factors, of these jobs into what might be called "generic" job descriptions and job specifications a simplified illustration would include all jobs which require a bachelor's degree, three years of active experience, and one year of service as a supervisor and designate them a common grade or classification (e.g., Grade 11) regardless of the field of activity involved.
Next, what is done is to place each of the individual jobs (with its particular job description and specification) into the grade or class with the closest fitting general description and specification. The idea, of course, is that there will be a set of all-encompassing general class/grade descriptions and that any specific job will fit in somewhere within the set.
The next task involves taking those classes which are entry classes or grades, which are to be compared with the market, separating them (at least conceptually) from the others. Typically, you are talking about four to seven benchmark classes but, as is often true in such situations, the number is dependent upon what jobs are included and policies and practices of the employer.2 It is these classes or grades which are the key ones and the ones for which wage and salary surveys are conducted.
On its face, this type of whole job system has advantages over the ranking systems. It usually uses more than one or two compensable factors and a broader range of job content is measurable. Difficulties include writing specific job descriptions to meet general grade descriptions rather than to accurately reflect what the job actually is. The broad grade descriptions usually include particular catch phrases like "supervises," "is responsible for," "reports to," "operates independently," and "has discretion" which are then included by the astute personnel practitioner in the specific jobs under consideration. This may automatically get the job slotted into a certain class because of language rather than actual job content.
While better than the ranking system, grade description systems also fall short on courtroom defensibility. These plans do not offer as much detailed, work‑related rationale to justify equitable pay differentials as many would like. But note that grade description systems have been used extensively in civil service employment the federal government and many state and local governments have utilized this form of pay system. This is not meant to imply that the private sector doesn't use this type of system, just that most exposure to it comes from civil service.3
These systems, ranking and grade description, are at one end of the distribution of job evaluation programs. We now move to those which are more quantitative and subject to more intensive measurement: factor comparison and point factor systems.
Factor Comparison Systems
The factor comparison system combines some elements of the ranking system with a set of defined payment schedules for what are termed compensable factors, those components which the employer recognizes are important to the set of jobs.
The typical compensable factors used are few:
Mental Requirements
Skill Requirements
Physical Requirements
Responsibility
Working Conditions
The next step is to identify those jobs in the structure which are regarded as key jobs. The actual number of jobs to use depends on the size of the organization and the range of jobs to be captured. For our purposes four will be used.
The process then involves identifying the rank or relative importance of the key jobs with respect to the compensable factors a process which may be repeated more than once for a validity check. See Table I which arrays the four key jobs across the above compensable factors in a mythical manufacturing environment, ranking then individually for each job. Ideally, these compensable factors are independent so that the ranking differs by factor, a result evident in the example of Table I as each order of ranking is different.4
Next one allocates existing pay rates across these factors, a matter of taking the wage rates/salaries of the key jobs and allocating them across each of the compensable factors for each of the jobs under consideration. (See again Table I) Note that there is a certain amount of reasoned judgement here because the analyst is determining "How much money is given/assigned for ranking one, two, three and four on each of the compensable factors?"
Thus, in our example, being first in Skill Requirements rates $7.02 for the Tool and Die Maker but only $3.89 for the Sweeper when it comes to Working Conditions. Similarly, being fourth in Mental Requirements is worth only $2.88 compared to $2.92 for the same ranking in Working Conditions.
Note further that something very important is being revealed by these numbers – which is true of all systems but very clear here. The organization using this system has decided what is of value to it what it wants to pay for when it selects its set of compensable factors and it has decided what those factors are worth in the set of jobs which characterize the organization. These are important as necessary characteristics of compensable factors.
Once the key jobs have been arrayed by compensable factor, along with the associated respective pay components, the specific pay components are set forth as is done in Table II. Here, the dollars per factor are aligned in such a way that it is now possible to slot the non-key jobs into the system where they fit among the established key jobs. That is, each job is compared on a dollars and cents basis with every other job, based on each of the compensable factors, and slotted into its relative position. The total pay rate of the job is the sum of what it would get for each of the compensable factors.5
| Compensable Factors | |||||||||||
| Key Jobs | Mental Requirements |
Physical Requirements |
Skill Requirements |
Responsibility | Working Conditions |
||||||
| Current Pay Rate |
Rank | Money | Rank | Money | Rank | Money | Rank | Money | Rank | Money | |
| Sweeper | 17.46 | 4 | 2.88 | 1 | 4.14 | 4 | 3.67 | 4 | 2.88 | 1 | 3.89 |
| Machinist | 25.78 | 3 | 5.45 | 3 | 3.75 | 2 | 7.51 | 3 | 5.47 | 2 | 3.60 |
| Tool & Die Maker |
28.55 | 1 | 7.02 | 2 | 3.95 | 1 | 7.88 | 2 | 6.15 | 3 | 3.55 |
| Inspector | 25.08 | 2 | 6.33 | 4 | 3.04 | 3 | 6.59 | 1 | 6.20 | 4 | 2.92 |
|
DOLLARS PER
FACTOR |
Mental
Requirements |
Physical
Requirements |
Skill
Requirements |
Responsibility
|
Working
Conditions |
| 8.00 | Engineer | Engineer | |||
| TOOL & DIE MAKER | |||||
| Millwright | |||||
| 7.25 | MACHINIST | ||||
| Engineer | |||||
| TOOL & DIE MAKER | INSPECTOR | ||||
| 6.50 | INSPECTOR | ||||
| INSPECTOR | TOOL & DIE MAKER | ||||
| Welder | Millwright | Laborer | |||
| 5.75 | |||||
| MACHINIST | Engineer | ||||
| Laborer | MACHINIST | Welder | |||
| 5.00 | Millwright | Millwright | |||
| SWEEPER | |||||
| TOOL & DIE MAKER | Welder | ||||
| 4.25 | Welder | MACHINIST | SWEEPER | ||
| Millwright | Welder | ||||
| Engineer | MACHINIST | ||||
| 3.50 | SWEEPER | Laborer | TOOL & DIE MAKER | ||
| Laborer | INSPECTOR | ||||
| INSPECTOR | Laborer | SWEEPER | |||
| 2.75 | SWEEPER |
Point Factor Systems
Point factor systems (also called point systems) have a history dating from the early 1900's and have been developed in a variety of ways. In fact, point factor systems are the most commonly used type of job evaluation system in the United States (Henderson, 1989). They base equity upon the idea of attaching numbers to identified components of the job.
The basic idea of a point system is to divide the job into a (fairly) large number of compensable factors which represent the structural components of a point factor system; included are "factors" and (perhaps) "subfactors" and may possibly include "weights." The use of weights, as is described below, is a technique which allows you to make further adjustments of your results should you choose to do so.6
The fundamental principle here is that the organization has to choose/select a set of compensable factors that reflect what the organization wants to pay for due to internal considerations based on the content and mix of jobs. The choice of compensable factors usually is made based on the following sorts of criteria, expanding upon what has been noted previously:
A. To be equitable, they should be work related, demonstrably derived from the actual content of jobs performed and the differences therein. They need to be supported by the job descriptions and job specifications of the organizationB. The factors should be acceptable to the participants. This means that even if only a small proportion of the work force is affected by a particular component, it may be necessary to include a factor for credibility. 7
C. Compensable factors should be business related in that the organization is paying for what it values. It is argued that the factors should be consistent with the organization's culture, business direction, and the nature of the work processes.
D. Factors must differentiate among jobs by being independent so that the specific characteristics inherent in each job can be identified. What we are saying here is that, ideally, factors should not overlap because if they do, that redundancy contributes disproportionately in total job points and the true value of the job is misstated and pay will not be equitably set.
The next step is to choose the subfactors associated with each of these factors. What this involves is identifying particular categories which are subsets of the factors have been selected earlier.8 As an example, Table III reports on some typical factors and subfactors used in such systems.
| Compensable Factors | ||||
| Skill | Effort | Responsibility | Job Conditions |
|
| Sub Factors |
Education Experience Training |
Visual Acuity Concentration Alertness |
For Loss For Policy For Safety |
Hazards Job Irregularity Working Conditions |
What is evidenced in Table III is a set of four compensable factors with a total of twelve subfactors. It would be possible to have twenty compensable factors and eliminate the factor/subfactor distinction altogether. Whichever route is taken, the logic of the system is the same. Most organizations typically use only eight to twelve of these possible subfactors as a matter of convenience and because in individual organizations there would be duplication between categories if many were used...which is the same as saying the factors would not be independent. It is the desire to minimize overlap which leads to a particular subset of the factors being employed.
Once the eight to twenty factors/subfactors are identified, the organization then decides how to array them (in relative terms) and how much the individual measures will be worth. This is important as the process involves the enterprise saying what it values in the mix of jobs it operates and what it will pay for this at least relatively.
|
ELEMENTARY SCHOOL JUNIOR HIGH SCHOOL HIGH SCHOOL TWO YEARS COLLEGE COLLEGE DEGREE MASTERS DEGREE DOCTORATE |
5 POINTS 9 POINTS 15 POINTS 25 POINTS 40 POINTS 55 POINTS 65 POINTS |
In establishing these seven degrees, the organization is specifying those characteristics which distinguish among the jobs it staffs (i.e., they reflect what variations in education have worth to the organization). Once the degrees/categories are determined, the organization next attaches specific point values to them (as is also done to the other choices in Table III). What this is saying is that, regardless of the job, it will be given the appropriate respective points indicated on this chart `as a function of its (i.e., the job's) educational requirement.9
Each job in the organization is then rated based on the set of compensable factors and the appropriate level or categorical values of those factors. When this process is completed, a set of points for every job is totaled, reflecting the relative worth of each to the organization internally. Here once more internal equity is measured as the relationship of each job to the others in the organization.
We have talked about establishing the number of points associated with each of our subfactors and the factors to which they sum based on totalling points. It is possible to attach or assign a weight to each of the compensable factors and typically this is done in one of two ways: The first is simply to allocate 100 percent among the factors on an ad hoc basis. One might decide, for example, to allocate:
|
Skill
|
Effort
|
Responsibility
|
Working Conditions
|
| 30% | 20% | 35% | 15% |
What this is saying is that this organization is going to adjust or standardize the factors by the above noted weights.10
Another way to deal with the weighting is to derive empirical market weights. This typically involves use of the key jobs for your weighting. What the organization does is establish pay rates (market rates) for the key jobs. It then runs a regression using the points for each factor for each of the key jobs against the market rates to get coefficients which will constitute the weights which are applied to all jobs in the organization regardless of whether they are key or non-key jobs. Thus, the organization might get a regression like:
WAGE= 9112.00 + .4205 (SKILL) + .3201 (EFFORT) +.6866 (RESPONSIBILITY) + .2113 (WORKING CONDITIONS) + Error
These values can be used as they are or they can be standardized to yield a particular total (e.g., 1.00). With these weights established, they are multiplied times the points assigned to each factor/subfactor for each job to produce a new point value for the job which reflects the weighting scheme.
The idea of differing weights should alert the reader that point factor job evaluation schemes can have varied weighting patterns. In practice, there is a plethora of point factor systems with many such plans differing from one employer to another.11 The one obvious question is why are there so many job evaluation plans and are there any differences among them? One interesting perspective on these systems can be obtained from Table IV, which reports on the weights attached to the major compensable factors Skill, Effort, Responsibility, and Working Conditions by fifteen different job evaluation systems.
|
Plan Identification
|
Skill
|
Effort
|
Responsibility
|
Working
Conditions |
| Nuclear Energy | 50 | 20 | 15 | 15 |
| Consolidated Wage Survey | 24 | 12 | 52 | 12 |
| National Metal Trades Assoc. | 50 | 15 | 20 | 15 |
| Westinghouse | 60 | 22 | 14 | 4 |
| S. California Aircraft (Production Workers) |
41 | 24 | 23 | 12 |
| S. California Aircraft (Technicians) |
54 | 38 | 6 | 2 |
| Consumer Electronics & Lighting Equipment |
62 | 13 | 13 | 12 |
| Textile Equipment Manufacturing |
60 | 15 | 15 | 10 |
| Petroleum Conglomerate | 56 | 18 | 13 | 13 |
| Aircraft Engines (Production Workers) |
50 | 20 | 15 | 15 |
| Aircraft Engines (Salaried) |
57 | 18 | 23 | 2 |
| Wire and Bridgeworks | 45 | 21 | 20 | 10 |
| Electric Lighting | 43 | 19 | 32 | 16 |
| Hydraulic Systems | 69 | 17 | 9 | 5 |
| Compressors and Turbines | 50 | 20 | 15 | 15 |
| Average | 51.0 | 20.0 | 19.0 | 10.0 |
| Standard Deviation | 10.3 | 6.0 | 11.0 | 4.3 |
The wide array of weighting possibilities is apparent from Table IV, reflecting choices made by individual developers of such plans. These choices are the result of policy decisions which are driven by what each organization believes it needs to pay for in its business environment. It should be clear that none is better than any other; it is simply a matter of deciding what the organization wishes to recognize, with pay, within the structure of jobs it utilizes.
One advantage of the point system is that it allows you to develop a picture of what is happening. That is, through use of specialized computer programs for compensation systems or spreadsheets with more generalized characteristics, it is possible to fully illustrate how a compensation system is operating. This comes about through estimation of the internal or organization pay line, the market pay line, and adjustments to the former in light of the latter.12
With data on points and wages/salaries, the enterprise is in a position to estimate the organization pay line with regression. The general formulation of the line involves regressing the organization's pay level for each job against the associated job points.
This is illustrated in Figure I which reports the organization's jobs, identified as "O's", indicating the respective points and pay rate for each. These values form the basis of the regression line which also is called the line of least squares, the organizational pay line, the internal pay line, the trend line, the pay trend line, pay policy line, and other similar names in American compensation literature.13
Of note is the fact that it is the organizational pay line which reflects one measure of the equity of the pay system. The line is upward sloping with more pay being associated with more points; jobs of more worth to the organization receive higher pay rates. Obviously, the slope of the pay line is a measure of "how" much more such jobs are worth with steeper lines indicating more value attributed to each job evaluation point by the organization than is true for less steeply sloped lines. Thus, the "equity" attached to differently sloped lines, while certainly measurable and observable, may vary in the eyes of an observer as both policy issue and fairness measure.
Something in Between - The Hay System
One job evaluation approach is perhaps the best known and the most widely used single system in America: the Hay Guide Chart - Profile Method of Job Evaluation.14 Originally developed by Edward Hay and his associates between 1939 and 1950, and refined through the years as the nature of jobs and work and their content have changed, the system combines elements of the factor comparison and point factor systems and is susceptible to the quantitative manipulations of statistical analysis.15 As such, it merges the whole job approach to job evaluation with the mathematical processes of the point factor methods.
The Hay System uses three compensable factors, each with a set of sub-factors or dimensions:16
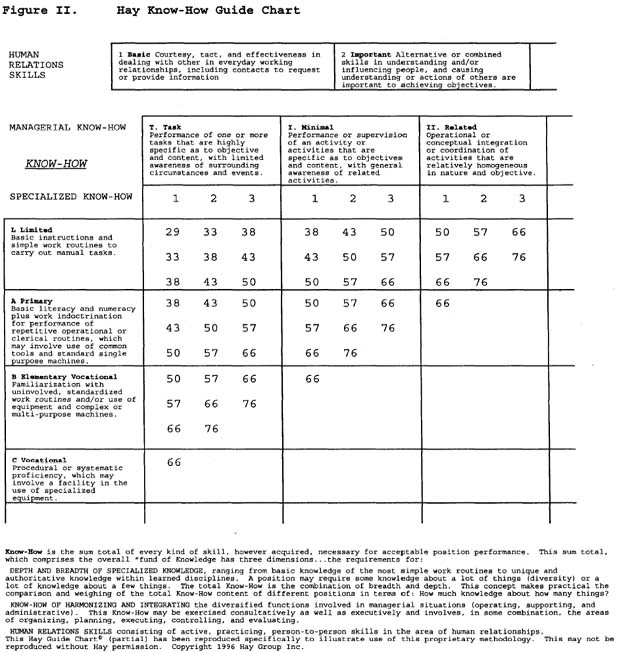

Figure 3: Hay Problem-Solving Guide Chart
Know-How
The sum total of every kind of skill, however acquired, needed for acceptable job performance.DimensionsPractical procedures, specialized techniques, and scientific disciplinesManagerial know-how in integrating and harmonizing diversified managerial functions
Human relations skills used in managing the people component of the job
Problem Solving
The amount of original, "self-starting" thinking required by the job for analyzing, evaluating, creating, reasoning, and reaching conclusions.DimensionsThe thinking environment in which problems are solvedThe thinking challenge presented by the problems to be solved
Accountability
The measure of the effect of the job on the organizations's end results.Dimensions
The freedom of the job incumbent to act in terms of personal or procedural control inherent in the jobThe impact of the job on the end results of the organization which may range from direct control to indirect support
The magnitude, or dollar size, of the areas of the organization affected by the job
Hay analysts, organization representatives, and individual employees work cooperatively to analyze and evaluate jobs using criteria from Hay Guide Charts, illustrated in Figures II, III and IV, which provide guidance as to how these compensable factors and their respective dimensions are to be applied to each, Once applied, the charts provide points which are then totaled to give a quantitative measure of relative worth as is done with the point factor systems described above. The global measures provided by the Charts lead to what is termed a Job Profile17 which associates the relative worth of a job to the mix of points it receives from each of the three factors; Know-How, Problem Solving and Accountability.
|
QUANTIFIABLE
|
Informational, recording, or other
incidental services for use by others |
Interpretive, advisory, or facilitating services for use by others
|
IMPACT |
A ANCILLARY |
C CONTRIBUTORY |
| NON-QUANTIFIABLE | Incidental support services with very indirect effects on the work unit |
Services or sub-tasks that indirectly support others in the work unit |
|
MAGNITUDE
ACCOUNTABILITY |
N Non- |
1 Very Small0 TO $100M |
2 Small$100M to $1MM |
| FREEDOM TO ACT | A C S P | A C S P | A C S P |
| L Limited Explicit instructions covering simple tasks |
5 7 9 12 6 8 10 14 7 9 12 16 |
7 9 12 16 8 10 14 19 9 12 16 22 |
9 12 16 22 10 14 19 12 16 |
| A Prescribed Prescribed instructions covering assigned tasks and/ore immediate supervision |
8 10 14 19 9 12 16 22 10 14 19 25 |
10 14 19 25 12 16 22 29 14 19 25 |
14 |
| B Controlled Instructions and establised work routines and/or close supervision |
12 16 22 29 14 19 25 33 16 22 29 38 |
16 22 19 |
|
| C Standardized Standardized practices and procedures and/or general work instructions, and/or supervision of progress and results apply wholly or in part. |
19 25 33 22 29 25 |
As part of the ongoing development of their methodology, the Hay Group has added the concept of Additional Compensation Elements (or ACEs18) to the basic system. These elements19 are drawn from the "physical, temporal, or contextual conditions' under which the job is performed and reflect the growing concern with issues like stress and burnout which have become ever more prevalent in the workplace. The use of ACEs generates point values which are combined with those from Know-How, Problem Solving and Accountability to produce point totals for individual jobs.
Contemporary Job Evaluation Systems
In the post World War II period, a number of new approaches to job evaluation have been developed. These have changed the focus of the process from job content/requirements and employee capability to measures actually assessing what is done by the job incumbent. The idea is that measurement of (and reward to) the required performance components of the job represents a better method of specifying what the organization values. By so doing, these systems drop down a level and actually look at activity levels rater than broad definitions of functions and/or areas of responsibility.20
The first attempt at such an approach was in the Air Force which developed a program called "CODAP" which stands for Computerized Occupational Data Analysis Plan. It was an attempt to describe jobs by asking people what they did on the job. Sibson and company took the computer software from CODAP and developed a job evaluation system called 'the automated job evaluation system.' Mercer, Meidinger, and Hanson have a software system of a similar nature called JEBOR or Job Evaluation By Occupational Requirements.
Another such generation job evaluation system is known as the Decision Band Method. Developed by Thomas Paterson, it was purchased by Arthur Young to be sold commercially as the consulting firm moved into the human resources area (see Paterson and Husband, 1970, Paterson, 1972a, and Paterson 1972b). Since that time, the system has been sold to others and is applied in a variety of settings.
The basic idea of the Decision Band approach is that it is equitable to reward a job based on the breadth of the occupant's decisions, a concept not unlike the idea of Span of Control advocated by Elliot Jaques (1970, 1979). These decisions can range from the extremely complex (e.g., upon what strategic course to set the corporation) to the very simple (e.g., when to attach a nut to a bolt). In the Decision Band Method, this range of decision possibilities is arrayed from Band F (at the top) to Band A:
BAND F - POLICY MAKING DECISIONS
These are decisions
determining the direction and overall objectives of the enterprise
BAND E - PROGRAMMING DECISIONS
These are the decisions
determining the means to attain the organization's goals
BAND D - INTERPRETIVE DECISIONS
These decisions involve
specifying how the organizational goals will be carried out
at lower levels
of the enterprise and involve resource deployment
BAND C - PROCESS DECISIONS
Here the decisions involve
converting the organization's objectives to practice using
available technology and resources
BAND B - OPERATIONAL DECISIONS
These decisions focus on how
the operating specifications will be carried out on a day-to-day basis.
BAND A - DEFINED DECISIONS
These are the decisions over
which there is little choice; how the elements of the job are to be
performed but not which elements constitute the job
The Decision Bands are translated into numerical scores and the system is treated like the point factor methods described earlier. Again, regression is used and market and organizational pay lines calculated (see below). From these results, individual pay is set.
To provide perspective, however, the array of "contemporary" job evaluation systems indicated above, while yielding new and different insights into the process of evaluating jobs, has not "struck gold" in terms of changing the basic nature of the outcomes of the process. Since the basic objective of all such systems is to provide measures of the relative worth of jobs, the mix and structure of jobs within an organization provides an unescapable foundation which generates and limits the ultimate differences among system outputs, a subject to which we now turn.
Does the Job Evaluation System Make a Difference?
The answer to the question of whether type of job evaluation system used makes a difference in outcomes is in one sense an unqualified "Yes!" in terms of measured internal equity. This is evident in Table V which reports the results, sores, or points; in absolute and relative terms, for four different actual job evaluation systems.21
What Table V does is compare the "relative" worth of each of twenty jobs in an organization relative to the base job: Packer.
It is evident from Table V that these systems generate wide variations in the measured relative worth of this set of 21 jobs studied; and the variations are of two types. First, the magnitude of the relatives differs widely from, for example, over 500 times (for the Hay and Decision Band systems) to just over three times (for the basic point factor system) for the relationship between the internal relative worth of the base job of packer and the company president. Second, the systems even differ in the mix of relative jobs in certain case: thus the punch press helper job is worth less than the accounting clerk job in the Hay system, worth more in all others.
However, before we can answer questions about how much these differences contribute to actual pay differences, we need to look at the issues of external equity. We now turn to these questions.
| Job Title | Hay System | Point Factor System 1 |
Decision Band System |
Point Factor System II |
|||||
| POINTS | RELATIVE POINTS |
POINTS | RELATIVE POINTS |
BAND | POINTS | RELATIVE POINTS |
POINTS | RELATIVE POINTS |
|
| President | 3872 | 5162.7 | 720 | 685.7 | F 10 1 | 18.30 | 5554.5 | 480 | 342.9 |
| V.P. Operations | 2060 | 2746.7 | 630 | 600.0 | E 9 2 | 17.50 | 5303.0 | 420 | 300.0 |
| V.P. Marketing | 1934 | 2578.7 | 610 | 581.0 | E 8 2 | 15.00 | 4545.5 | 420 | 300.0 |
| Controller | 1564 | 2085.3 | 580 | 552.4 | E 8 3 | 15.67 | 4748.5 | 440 | 314.3 |
| Dir. of Personnel | 1490 | 1986.7 | 565 | 538.1 | E 8 1 | 14.33 | 4842.4 | 400 | 285.7 |
| Prod. Manager | 1464 | 1952.0 | 490 | 466.7 | D 6 3 | 11.67 | 3536.4 | 305 | 217.9 |
| Comp. Manager | 1064 | 1418.7 | 455 | 433.3 | D 6 1 | 10.33 | 3130.3 | 315 | 225.0 |
| Training Manager | 1119 | 1492.0 | 455 | 433.3 | D 6 1 | 10.33 | 3130.3 | 280 | 300.0 |
| Auditor | 302 | 802.7 | 350 | 333.3 | D 6 2 | 11.00 | 3333.3 | 315 | 225.0 |
| Safety Manager | 775 | 1033.3 | 440 | 419.0 | D 6 1 | 10.33 | 3130.3 | 325 | 232.1 |
| Sr. Accountant | 344 | 458.7 | 360 | 342.9 | B 3 2 | 5.50 | 1666.7 | 260 | 185.7 |
| Prod. Supervisor | 261 | 348.0 | 455 | 338.1 | C 5 2 | 9.50 | 2878.8 | 255 | 182.1 |
| Assem. Supervisor | 256 | 341.3 | 270 | 257.1 | C 4 2 | 7.00 | 2121.2 | 200 | 142.9 |
| Pack. Supervisor | 154 | 205.3 | 260 | 247.6 | C 4 1 | 6.33 | 1918.2 | 260 | 185.7 |
| Accounting | 270 | 360.0 | 230 | 219.0 | B 2 3 | 3.67 | 1112.1 | 170 | 121.4 |
| P.P. Operator | 149 | 198.7 | 230 | 219.0 | B 2 1 | 2.33 | 706.1 | 250 | 178.6 |
| Assembler | 119 | 158.7 | 125 | 119.0 | A 1 1 | 0.33 | 100.0 | 115 | 82.1 |
| Secretary | 163 | 217.3 | 240 | 228.6 | B 2 2 | 3.00 | 909.1 | 120 | 85.7 |
| P.P. Helper | 97 | 129.3 | 120 | 114.3 | A 1 2 | 1.00 | 303.0 | 175 | 125.0 |
| Acct. Clerk | 115 | 153.3 | 145 | 138.1 | A 1 3 | 1.67 | 506.1 | 120 | 85.7 |
| Packer | 75 | 100.0 | 105 | 100.0 | A 1 1 | .033 | 100.0 | 140 | 100.0 |
| NOTE: Job of Packer is base job throughout for comparison purposes. | |||||||||
External Equity: The Wage and Salary Survey
Traditionally, American pay setting practices have rested/stood on the principle of external equity through the use of wage and salary surveys to obtain the "market" wage. After all, if it is determined by the market it must be "equitable." There has been significant reliance on the market with a belief that, just as the economist can identify a "market clearing wage" through the intersection of the supply and demand curves, the compensation practitioner can do the same thing via market surveys and establish what the "key" or "benchmark" jobs are worth in the market.
Perhaps the best way to think of what you get from such a survey is to consider the report of Figure V. Here is duplicated, in stylized form, the type of data reported in wage and salary surveys.22 It should be evident from Figure V that there is no single market wage but an array of rates as different employers pay what they do based on considerations including ability to pay, relative position in labor and product markets, organization expansion or contraction, demands of unions, governmental regulatory requirements, and the other myriad components to the pay policies they follow.
Statisticians examine Figure V and find there is a wealth of reportable statistics therein.24 More importantly, and adding to the levels of complication, the statistics can be reported in two entirely different ways: based on numbers of organizations reporting and based on the number of employees those enterprises report. In fact, the complications are so many in number that at least one study has investigated how analysts process such data to obtain estimates of the market for use; Belcher, Ferris and O'Neill (1985) report, based on a sample of 34 firms, that employers use over 95 different computational strategies to manipulate such data.24
For our purposes, however, suffice it to say that the objective is to obtain an "estimate" of the market wage (or wages): that it can be done regardless of the specific form of job evaluation used and it leads to the quantification of external equity. By whatever process utilized, compensation analysts develop estimates of the "market" wage/salary for each job and use that information to specify where the organization will be relative to that market. Thus, organizations say they are 90 percent of market or 105 percent of market, concepts which will become more apparent in the section which follows.25
Figure 5: Illustrated Example of Wage and Salary Survey
Bringing the Internal and External Together
The ultimate objective of the compensation effort is to bring the measures of internal and external equities together and set the stage for determining the pay of individual workers. That process can be as simple as arraying pay in the hierarchy of the ranking system to as complicated as applying sophisticated regression techniques. We will lean toward the latter as it provides the broadest insight into how the systems typically work.26
One of the most significant contributions to the growth of scientific approaches to the American compensation world was the expansion of the use of computers and their ability to perform regression analysis. This moved compensation practices from the level of "guesstimation" to "precision" in that it allowed powerful statistics to be applied to the data.27 It is this quantitative approach, moreover, which allows for a full explication of the principles of individual wage and salary setting.
As was indicated above, the first task using regression analysis is to calculate the organization line of least squares combining the job points from the evaluation system which you have calculated for each job and use them as the independent variable against which current salary for that job is regressed.28 Here, again, there may be variations in approach as some use the individual job's mean, some use the median, some use all rates being paid the job. Such a pay line has been illustrated in Figure I above.
The second task is to use only the key jobs and calculate the market line of least squares. This is done using the "market rate" of pay (as was discussed above) calculated from the wage and salary surveys together with the job points determined for the key jobs.29 This produces what is called a market pay line, in a sense exhibiting the relative worth of the key jobs to the organization from the horizontal axis of Figure I above, and the "average" market worth of the jobs on the vertical axis. The combined result is presented in Figure VI, with the individual "M"s of the key jobs added.
What is also inherent Figure VI is the comparison between the organization and the market pay lines. As represented here, the organization is paying above the market for the lower paying jobs and below the market for higher paying ones.30 This is a practice engaged in by those firms which believe in the inertia of workers and feel that once you attract them (by paying well) you can keep them even if you fall behind the market.
Figure 6: The Organization Pay Line and the Market Line Together with Associated Job Points, Pay rates and Market Pay Rates
But perhaps of equal interest is the fact that a diagram like Figure VI can be used to represent two other aspects of compensation management and the equity therein. First, it must be noted that while the organization pay line moves once or twice a year as a pay plan is set forth, the market pay line is constantly moving as the universe of organizations which make up the market change their pay levels at varying times. This means that the organization is always dealing with a moving target when setting pay rates and the actual level of external "equity" is constantly changing.
The second aspect of the diagram is that it characterizes the relationship organizations are talking about when they position themselves relative to the market. When firms claim to be "90 percent of the market" or "105 percent of the market," they are speaking of where their organization line is relative to the market line as a matter of policy choice. As is implicitly noted above, some firms lag the market and some lead the market as a practice; some do so with a portion of their jobs and some do it with all of them. It should also be obvious that any such statement is correct only at one point during the year; as the market moves in its inexorable way upward the relationship between firm and market is constantly changing. This difference in movement between the organization and the market leads to policies like lead-lag, lag-lag, and a variety of similar designations, measures of relative equity and time.
Obviously, what this also means is that the relationship of Figure VI is only one of several ways in which pay in the organization and pay in the market may be related and the effect of the two may be experienced. Each of these alternatives represents a policy alternative for the organization with associated upside benefits and downside risks. Here again the organization is deciding, in a slightly different way, what it is paying for (typically in terms of areas like turnover and employee satisfaction).
In Figure VII the organization has done what has been discussed above: it has specified one aspect of its pay plan for the coming year. Here, the organization has acted through offering constant dollar increases over existing rates, causing the organization pay line to shift directly upward. Had the organization given equal percentage changes, the organization line would have twisted upward and to the left as jobs at the upper end of the distribution received larger dollar amounts in their adjustments than those on the lower end.
Figure 7: Organization Pay Lines, Current and Future, Together with Market Pay Line
The analysis of Figure VII is carried still further in Figure VIII, where job grades and pay ranges are added to the future (i.e., proposed) organization pay line and the market pay line. Job grades represent an effort to ease administrative burden. Rather than looking at each job as an entity, jobs with relatively common characteristics, typically as measured by their job points, are grouped together as a grade (along the horizontal axis) and treated identically (again reflecting the idea of equity).31
Figure 8: Future Organization Pay Line, Pay Grades and Pay Ranges, Together with Market Pay Line
The pay range is measured on the vertical scale as it reflects the various rates of pay which may be attached to the jobs within the pay grade(s) and reflect what the incumbent brings to them. It is here that the American compensation practitioner moves away from job standards and classifications to individual/personal ones. What occurs here is oriented toward rewarding the worker's contributions to the enterprise.32
Generally, pay ranges are specified in terms of their maximum, minimum and midpoint; with the latter located on the organization's pay line, something done to Grade C of Figure VIII.33 These concepts are measures of where, under routine circumstances, an individual's pay may be set. Obviously, most workers will be above the minimum which represents the lowest rate paid those in the grade.34 The midpoint usually represents the middle of the pay range and is akin to the median and stands as a measure of central tendency. The maximum is the highest rate paid any worker in a grade, typically representing the highest levels of individual accomplishment in a job.35
From the perspective of pay and individual equity, it is the pay ranges which are intended to ensure employees are rewarded according to their particular contributions to the organization. Movement up and through a pay range typically is based on two considerations: seniority and on- the-job performance. While the specific patterns of movement will vary among organizations, typically they are something like seniority below the midpoint and performance above the midpoint or seniority the first third of the range, seniority and performance the second third, and strictly performance the top third. What is happening here is the organization is deciding what in an individual's personal job performance characteristics to reward in order to recognize his/her contributions. Obviously, different organizations will make different policy choices with regard to what they recognize as being important.
Job Evaluation Systems Once Again
Earlier we asked what differences did individual job evaluation systems make in terms of the relative worth of jobs in an organization and concluded they could be substantial. We now ask essentially the same question but focus on what happens to individual pay rates....the amounts a worker actually received after external equity is considered. The answer is given in Table VI which looks at dollars.
What Table VI reports is the actual wages or salaries proposed by the teams described earlier once they had accounted for the labor market (i.e., what others were paying) and the ability to pay of our organization...the external equity issues...given their different job evaluation systems. What may appear as surprising about Table VI is how similar the results are across the different systems. The certainly are far different from the relative worth of jobs established by these systems and reported in Table V.
|
|
Hay System
|
Point Factor
System 1 |
Decision Band
System |
Point Factor
System 2 |
| JOB TITLE | ||||
| President | $87,142 | $57,916 | $51,442 | $83,030 |
| V.P. Operations | 54,309 | 51,865 | 45,215 | 61,844 |
| V.P. Marketing | 50,198 | 47,297 | 45,215 | 61,844 |
| Controller | 50,198 | 53,754 | 39,912 | 68,469 |
| Dir. of Personnel | 41,958 | 43,800 | 40,025 | 55,655 |
| Prod. Manager | 41,753 | 45,722 | 36,912 | 39,708 |
| Comp. Manager | 28,952 | 41,800 | 34,837 | 34,223 |
| Training Manager | 29,046 | 27,321 | 30,339 | 27,690 |
| Auditor | 30,196 | 25,384 | 34,837 | 34,223 |
| Safety Manager | 25,832 | 25,928 | 26,534 | 36,335 |
| Sr. Accountant | 29,156 | 25,690 | 31,723 | 24,557 |
| Prod. Supervisor | 8.30 | 11.11 | 13.75 | 11.46 |
| Assem. Supervisor | 8.39 | 6.61 | 13.75 | 8.55 |
| Pack. Supervisor | 7.91 | 9.59 | 12.76 | 10.39 |
| Accountant | 21,094 | 21,320 | 26,534 | 15,861 |
| P.P. Operator | 7.44 | 8.52 | 7.93 | 11.13 |
| Assembler | 7.29 | 6.49 | 5.27 | 6.35 |
| Secretary | 15,188 | 12,752 | 18,231 | 14,927 |
| P.P. Helper | 6.44 | 7.46 | 5.27 | 7.75 |
| Acct. Clerk | 16,084 | 16,766 | 16,502 | 14,850 |
| Packer | 7.17 | 7.67 | 5.27 | 9.42 |
Note they did not come up with exactly the same rate for each job but it is surprising how close they are....and in a few cases they were identical. Since the actual pay rates proposed also reflect differences in pay policies the individual teams established and other structural differences identified by each of the teams, variations would be expected. But the message from Tables V and VI is that, given rational approaches to the implementation of individual job evaluation systems, it is difficult to go very far astray as the economic forces acting on the enterprise and the external labor market in which it operates keep it from paying way beyond its competitors.
Enterprises in United States are focusing on two "new" major forms of pay setting: Skill or Competency Based Pay and Broad Banding.36 These changes arise out of concerns over the productivity of individual workers and a desire to for the organization to be more productive as the forces of competition worldwide push for efficiencies.
Skill and competency based pay are similar in that they are directed at paying people for individual rather than job characteristics. The idea is that workers will be paid based on the number and breadth of the skills they bring to or acquire on the job. Skills are the abilities and knowledge a person possesses which are directly relevant to the job/position occupied. Competencies are the broad-based understanding of and ability to apply conceptual practices to the operation of the enterprise.37
Obviously, skills are generally applicable to production and service worker jobs while competencies are characteristic of managerial jobs. In each of these system approaches, the ideas are not radically different from what has been raised above the differences are in the mechanics of application.
Broad Banding involves taking the grades and ranges of Figure VIII and expanding them in size and reducing them in number as is done in Figure IX (to only one in the limit). Thus, the number of grades combined can range from four or five to as many as the enterprise operates (Abosch, Gilbert, and Dempsey, 1994). De facto the controls which exist in pay grades and ranges are cast aside and ostensibly there is wide latitude given as to where individual wage rates are set. However, control is maintained by putting zones, control points, breaks, or other measures in the system to provide guidance as to what is to be paid for particular jobs (Milkovich and Newman, 1999). In application, this begins to look like traditional ranges and grades. In fact, Milkovich and Newman (1999, pp. 253-244) go so far as to point this out in their discussion.
Figure 9: Pay Structure Under Broadbanding
What is interesting about these "new" systems of pay philosophy is that they are very similar to the way in which American employers paid before the job evaluation "revolution" of the World War II era and thereafter. Each of these approaches looks toward paying individuals for what they are and not for the job they hold (in large part). This does cast doubt on some of the traditional ideas of equity and signals a movement away from the measurable in many cases. Only time will tell if these movements endure.
The Legal Side - Another Attempt at Ensuring Equity
One of the myriad of human resource functions which has seen extensive legislation has been compensation. Beginning with minimum wage legislation in the 1930's, and continuing through wage/pay stabilization laws during World War II and Korea, America moved to equitable pay legislation in the 1960's and 1970's. Again, the theme was to tie pay more closely to what the individual did in/for the enterprise, less to personal characteristics. These efforts came in three/four guises.
The Equal Pay Act of 1963
The movement for civil/equal rights in America led to passage of the Equal Pay Act of 196338 which was intended to ensure women and men doing the same job were paid the same wage or salary. The language of the Act focused on the basic components of job evaluation systems discussed above:
No employer shall discriminate between employees on the basis of sex by paying wages to employees less than the rate at which he pays wages to employees of the opposite sex for equal work on jobs which require equal skill, effort, and responsibility, and similar working conditions.
The Civil Rights Act of 1964
Congress passed general anti-discrimination legislation a year later, encompassing a variety of provisions in the Civil Rights Act of 1964. The legislation attacked discrimination in a variety of forms from public accommodations through education to employment. With respect to pay, Title VII (the employment section of the legislation) said:
(a) It shall be an unlawful employment practice for an employer
(1) to fail or refuse to hire or to discharge any individual, or otherwise to discriminate against any individual with respect to his compensation,...(42 USC 2000e-2, [703] Sec (a) (1)).
The intent of this language was to ensure that employers paid individuals equally regardless of their racial or ethnic background. This was to stop arrangements where employers, trade unions, and others allowed workers to be paid based on personal factors other than those which were job related.39 There was no explicit mention of the four basic compensable factors skill, effort, responsibility, and working conditions in the statute but the standards were implicitly present.40
Pay Equity/Comparable Worth Legislation of the 1970's
Equitable pay between women and men, an expected outcome of the Equal Pay Act, never materialized as clearly as had been anticipated. The earnings of women persisted at sixty percent of those of men and the belief was that more needed to be done.41 A variety of states and their political subdivisions chose to enact and implement "comparable worth" legislation in the 1970s and 1980s. Unlike "equal pay for equal work" (the objective of the 1963 Act), comparable worth sought "equal pay for work of equal value." In most cases, the search for an answer came through the use of job evaluation and compensation systems.
What this meant was that jobs with the same "job points" from a job evaluation system would be paid the same pay rate regardless of the gender of the incumbent. The premise was that employers took advantage of discrimination against women in the labor market and paid them lower wages/salaries than men when they were in jobs of comparable or equal worth, contributing to the persistent earnings gap. It is worth noting that while the gap has been eroding (see pp. 3-4, above), to the authors' knowledge no one has gone back and looked at the effects of the comparable worth efforts which were initiated.
Executive Compensation.....Equity Gone Amuck?
Earlier, we introduced this American perspective on executive compensation by pointing out the objections of the AFL-CIO and others to what have been termed "obscene" levels of pay for American senior executives. It needs to be noted that these pay levels are the result of varied and complex types of reward mechanisms. Thus, we could note that most American executives typically have five components to their compensation package, each playing a role in the sum total:42
A. Salary - Most executives realize a salary which is actually relatively small given the large amount of attention paid to executive "excess." If fact, many executives' salaries could be described as close to or consistent with the results from the basic job evaluation system used to determine the wages and salaries of all other employees.B. Short Term Bonus - Nearly every executive participates in a short term bonus program which ties pay to gains made in a short time frame typically a year.
C. Long Term (Performance) Bonus - These are bonuses typically tied to a goal which take some period of time to accomplish such as bringing a new product to market, achieving a targeted return on equity, attaining a specified rate of sales growth, or completing a desired acquisition.
D. Incentive Stock Options - ISOs are options for an executive to purchase shares of the company's stock at the stock's fair market value on the date of the grant for a period of up to ten years. As there is a $100,000 per year vesting limitation on these programs, these do not hold out the promise of large rewards. The objective is for the executive to work to raise the company's stock price so that he or she and the stockholders will share in the wealth gained.
E. Nonqualified Stock Options - These are the programs which typically generate the large, newsworthy, compensation levels. An executive is granted the right to purchase shares of the company at a stated "option price" for a defined period of time usually 10 years where the option price is the fair market value of the stock on the option's issue date. Here again, the objective is for the executive to work in his/her interest and that of the stock holders to improve share price and generate more wealth for all.
It is the size of the sum total of all of these payment types but particularly the Nonqualified Stock Options which have led American executives to earn so much more than those who toil at lower levels in their organizations. The ratio of CEO pay to production worker pay in the US (based on Business Week data) has moved inexorably higher and no end of the trend is in sight (see "Executive Pay: Up Up and Away," Business Week, April 19, 1999, pp. 72-118). And there are signs the problem may be spreading: Business Week reported that the German executives at Daimler-Benz were quite attracted to the pay levels of their Chrysler counterparts and sought to replicate them in their own compensation packages ("Special Report: Eager Europeans Press Their Noses to the Glass, Business Week, April 19, 1999, p. 89). Indeed, some European managers were reported to be asking that payments to them be made in America so that their domestic shareholders, workers, and unions would not find out where their pay was trending according to reports in Forbes, The Wall Street Journal, and The Economist during the Spring of 1999 and 2000.
Complicating matters is the fact these executives can gain when their "contributions" might even be viewed as negative. The American "Bull Market" of the late 1990s led to substantial increases in the prices of stocks when the companies involved actually performed quite poorly....and their executives were rewarded handsomely in turn.43 These differences between performance and pay have led to statements like the following in the business press:
"Executive Pay: Stock options plus a bull market made a mockery of many attempts to link pay to performance."
Business Week, April 20, 1998"Did They Earn It? Sometimes there's no connection between pay and performance."
Forbes, May 18, 1998
Indeed, Business Week published the report "Who Earned Their Keep And Who Didn't" on Page 103 of the April 17, 2000, edition indicating how many top executives had failed to produce results commensurate with their pay.
From an international perspective, the American executive does very well when compared to executives from around the world. Based on Business Week data, the total compensation of American CEO's exceeds by a factor of two that of executives in other parts of the industrialized world when purchasing power is compared. That is, US executives can generally buy twice as much with what they get paid as can their counterparts elsewhere. This leads to questions about whether they actually are worth twice as much, something about which there is debate in the American business press and elsewhere.
It is the apparent no end in sight for this upward relative and absolute movement of executives compensation that has people worried and raised provocative questions. Is it fair for these to get so much when those below them often get so little? Is there really such a shortage of executive talent? Does the effort really match the reward? ...and this list could be extended....without satisfactory and conclusive answers.
The intention of this discussion has been to draw a picture of American compensation systems and practices in light of concerns for equitable treatment of workers. Pay in this context is seen as being aligned with what the worker does/the contribution made to the organization as well as with what is paid for similar contributions in the larger labor market. The variety of job evaluation and pay determination systems are intended to balance these concerns by acknowledging internal and external equity and seeking to obtain a result which recognizes both.
Given the task of attaining these dual and often somewhat conflicting objectives, systems range from the simple to the profound reflecting organizational size realities, job complexities, managerial and worker expectations, and a host of other factors. Moreover, systems have tended to proliferate in the American setting as organizations have modified existing programs and attempted to make them more closely fit their needs. Any program one examines is virtually certain to have at least one (if not several) near "fraternal" twin as they are massaged to fit the circumstances of different employers. It seems everyone wants a system to work "a little bit better" for them.
Even given all of these efforts, the systems and their operations are not perfect. Jobs, and the work environment in which they take place, are both complicated and dynamic and any job evaluation system is unlikely to be able to measure all that is involved. This means that systems are always evolving to keep up with the times. It also means that systems developed many years ago still deliver good results because they have been modified over the years to keep them up to date.
Obviously some questions have been raised about these practices in light of differences in racial, gender, and executive pay levels in the U.S. Indeed, the principles of equity applied regularly have fallen short when the interests and needs of particular groups have been examined. People have often pointed out that the American systems tend to measure more of what is in men's jobs working conditions, strength, gross skills and less of what is in women's jobs caring, attention to detail, gentleness. Indeed, this is true and is something which doubtless needs to be explored and corrected as we move deeper into the Twenty-First Century and the labor force becomes even more female.
And the pay of many of the CEOs and other executives in America seems to bear little relationship to what they do. Studies in the academic press and the general media do not support the conclusion that such large payments yield better organizational performance. And what is more troubling is the apparent trend around the world to move toward the American model rather seeing the U.S. move toward the pay practices of its international counterparts.
The astute reader will perceive that the American system of compensation management can be described as involving the mix of art and science in many respects. The application of job evaluation systems to measure the specific content/value of jobs requires judgement and subjectivity above what some might desire to employ; engendering resistance in those newly involved in the process. The assessment of market wages is another of those "arts" which requires judgement and insight that challenge and worry the neophyte. We then attach to these processes some of the most powerful tools of statistical analysis in order to obtain the estimates we want and need to complete our ultimate task: assigning pay rates to individual workers.
Implicit in all of this is that whatever the employer does in the pay arena constitutes a policy choice where something stands to be gained and something may be lost. After all, an employer could decide "We will never raise pay again!" Such a policy would do wonders for labor costs into the (short run) future – but it also would mean that the organization would no longer be able to attract labor. While extreme, this position is one of many which the American compensation manager can take in dealing with the pay of workers, in a sense one anchor point over a long continuum of possible choices.
* The authors would like to acknowledge the support of those who assisted us in the development of this chapter. The list is too long to include all but special thanks go to Jim Bowers and Vicky Wright of the Hay group for their provision of documentation and supporting materials and to Rod Kelsey of Riley, Dettman, and Kelsey for additional inputs. More importantly, we are grateful to the many legislators and hundreds of curious students who, over the years, have forced us to continually rethink where compensation practices in the United States are going . . . and why!
1. The discussion presented below represents analysis and synthesis from many who have trodden these waters before. Included are Beach (1965), Lanham (1955), Otis and Leukert (1955), Patton and Smith, Jr., (1949), Zollitsch and Langsner (1970), as well as beneficial discussions with Robert J. Fjerstad, Ken Hall and others who were there at the beginnings. We owe them all a debt of gratitude.
2. That is, you may hire only into certain classes regardless of other possibilities.
3. Also note that in many cases of government sector utilization, the determination of wages and salaries is a political rather than an economic matter – often wages are determined by the legislative branch and not by the market or anything else!
4. In reality this is one of the major issues with job evaluation, trying to obtain truly independent compensable factors in order to be able to measure what distinguishes one job from another.
5. For example, the pay rate for the Engineer would involve totalling $7.98 for Mental Requirements, $3.95 for Physical Requirements, $7.37 for Skill Requirements, $8.05 for Responsibility, and $5.32 for Working Conditions to yield an hourly rate of $33.67. This would be the base rate and would not include payments for seniority, merit, or any other individual based criteria.
6. Actually, there are always implicit weights in such systems. The issue is whether it is appropriate and necessary to go further and add other weighting schemes to achieve some desired outcome.
7. Thus, even if only 10 percent of a company is affected by working conditions, it may be necessary to include them to make a pay program acceptable.
8. Systems may obtain the same result by calling all that we are calling subfactors, factors. What this means, of course, is that these have more factors than we have proposed here.
9. Note that, for example, the number of points for education has no relationship to the educational background of those holding the job or of applicants for the job; it is solely a measure of what is required for the job.
10.These weights are based on an a priori belief as to what importance is to be attached to each of the compensable factors. As is evident from Table IV, to be discussed below, there is no absolutely correct choice here – only a policy decision.
11.Richard Henderson (1989) reports that point factor systems make up approximately 20 percent of job evaluation systems.
12.Note that these subjects will be treated only briefly here. A more complete presentation follows in the section on bringing the internal and external markets together.
13.One of the difficulties in American compensation practice is the variety of names given to common quantitative and statistical measures over the years. Unfortunately, most of these still remain in the jargon and the reader is advised to be vigilant when reading American compensation literature to be certain what the author(s) intend.
14.Copyright © The Hay Group
15.See, for example, Eugene J. Bemge, Samuel L.H. Burke, and Edward N. Hay, Manual of Job Evaluation (New York, NY: Harper and Brothers, 1941), and Edward N. Hay and Dale Purves, “A New Method of Job Evaluation,” Personnel, Vol. 31, No. 7 (July 1954), pp. 73-80.
16.This discussion is drawn from Hay company documentation. Note that there are occasions where Hay will include working conditions in their methodology as was done in Comparable Worth practices in Minnesota (Azevedo and Roth, 1990). However, even when this is done the measure does not figure prominently in the outcome of the process. See also the discussion of ACEs which follows below.
17.Copyright © The Hay Group
18.Copyright © The Hay Group
19.Additional Compensable Elements include but are not limited to Sensory Attention, Hazards, Environment, and Working Conditions, reflecting the ability to adjust to the needs of individual employers.
20.Typically, these systems also call for much more involvement of the job incumbents in inputting data to the process and working with the results when they are developed because they are the ones most intimately aware of what the job “does”.
21.These results were obtained by teams from a graduate class in compensation administration at the University of Minnesota using the systems identified on a common set of jobs in a particular organization. In each case, the teams evaluated the jobs and arrived at the total points reported here. Some of the team members were neophytes at compensation; others had considerable job-related experience in the field.
22.Variety in form of data reporting is the order of the day in wage and salary surveys. The example here is but one way in which the data are presented. The reader is advised to proceed with caution when perusing any such survey and study the definitions utilized carefully. It is unfortunate but different reports will have different names for the same measure and the same names for different measures.
23.We choose not to get involved in the phethora of statistics reported for such documents. The reader is referred to any standard compensation text for lengthy treatment of the statistical complications to reported data.
24.In fact, the research on data has led some to raise serious concerns about the market wage. See, for example, Rynes, Sara L., and George T. Milkovich, “Wage Surveys: Dispelling Some Myths About the “Market” Wage.” Personnel Psychology, Vol. 39, No. 1 (Spring 986), pp. 71-90.
25.Implicit here is the idea that the market provides an economic framework in which the firm operates, an idea with which most if not all can agree. In a major sense, the economics of the setting establish the limits within which the organization places itself. The real issue is the extent to which that framework corresponds to the world of the economist and that is open to serious question.
26.Each of the job evaluation systems described above is implemented in a way consistent with what follows. Rather than explicating each, it is believed more useful to give a full explanation of the possibilities through a single method and letting the reader decide how to apply the ideas individually.
27.There is room for debate about the use of the word precision here. Some ask whether, given the imprecision of what has gone before, it is appropriate to call the process “exact” or “precise”. We will not resolve that debate but rather leave it up to the readers to judge for themselves as to its validity.
28.This line is also called the trend line, the pay line, the least squares line, the pay policy line, and a host of other names in American compensation literature. Such names come from various uses to which the line has been put and/or the earlier times when it was simply drawn freehand across an array of wage data and job points.
29.Now it may be better understood why one takes the array of data from wage and salary surveys and attempts to calculate the “market wage”. None of the available statistical tools allows the use of anything but a point estimate of the market, meaning that the dispersion of rates actually has no specific quantitative effect on the rate determined/obtained.
30.This may be the result of a specific 'pay policy’ or simply the results of whatever pay practices our organization is following. Whatever is the case, any such relationship will have both positive and negative aspects and part of what compensation practices are about is balancing these. Obviously, there are a variety of such pay practices relative to the market line.
31.The pay grades shown are typical of most illustrations: they are of the same size. This is not necessary as the size of any such pay grade should be what is appropriate for administrative convenience.
32.Here again we note pay ranges do not have to all be of the same size.
33.Some place the pay range with the minimum on the pay line while others choose some other metric of the pay range as their locator. When broadbanding and similar practices are used (see below), the locus of the pay range varies over the distribution of jobs and job classes.
34.Occasionally there are rates below the range usually caused when new jobs or job evaluation systems are defined/utilized. These are called “Green Circle Rates” and typically are raised to the minimum of the range when identified.
35.There are three types of pay rate when may exist above an established pay range. A “Red Circle Rate” is a rate typically identified as excessive when a job evaluation is done and is then left in place due to the social stigma against cutting wages. A “Gold Circle Rate” is a rate paid for exemplary performance. A “Silver Circle Rate” is paid to workers who have superseniority; given to workers who have extremely long periods of service and constitutes a reward for that service.
36.Some may include Team Based Pay as a third component of this group. We would argue that it is encompassed by what is being said about skill and competency based pay in what follows.
37.As can be detected, competencies are a good bit more general and less specific than are skills. In a sense, they incorporate a range/variety of performance which is more subjective and difficult to identify concretely. Examples include expertise in areas like communication, product awareness, system building, and industry/market knowledge.
38.The Equal Pay Act was an amendment to the Fair Labor Standards Act which controls minimum wages and maximum working hours.
39.The Civil Rights Act did make provision for pay differences when they were based on bona fide merit or seniority system or incentive system which measured quantity or quality of output. See Sec. 2000e – 2 (2) (h).
40.The U.S. Supreme Court intimated as much in its decision in County of Washington v. Alberta Gunther et al., 452 U.S. 161 (1981).
41.Note that this gap is an earnings differential and not a pay differential. This measured phenomenon speaks to more going on in the American labor market than just paying differently for men and women. See Gunderson (1989) for a full discussion of these issues.
42.Admittedly, there are many more possible components to an executive’s compensation than are discussed here. Other examples include but are not limited to Phantom Stock Plans, Performance Shares, Stock Appreciation Rights, Performance Units, and Deferred Stock Units. Thus, this survey is intended to be illuminative rather than exhaustive.
43.See the special report, Executive Pay, published by the Wall Street Journal, April 6, 2000, for a full explication of the trend developments in executive compensation. Even this very business-oriented publication raises concerns about the trends in what executives are receiving.
Abowd, John M. and Kaplan, David S. (1999). Executive compensation: six questions that need answering. Journal of Economic Perspectives, 13 (4),145-168.
Armstrong, Michael and Baron, Angela (1995). The job evaluation handbook. London, I P D House.
Azevedo, Ross E. and Roth, Lawrence (1990). Canadian-United States experience with comparable worth: the view from Minnesota. Proceedings of the 1990 Spring Meeting. Madison, WI, Industrial Relations Research Association.
Beach, Dale S.(1965). Personnel: the management of people at work. New York, The Macmillan Company.
Belcher, David W. (1975). Compensation administration. Englewood Cliffs, NJ, Prentice-Hall, Inc.
Belcher, David W., Ferris, N. Bruce, and O'Neill, John (1985). How wage surveys are being used. Compensation and Benefits Review, 17 (4), 34-51.
Bemge, Eugene J., Burke, Samuel L. H., and Hay, Edward N. (1941). Manual of job evaluation. New York, Harper and Brothers.
Gunderson, Morley (1989). Male-female wage differentials and policy responses. Journal of Economic Literature, 27 (1), 46-72.
Hay, Edward N. (1946a). Characteristics of factor comparison job evaluation. Personnel, 22 (6), 370-375.
_____________ (1946b). Training the evaluation committee in factor comparison job evaluation. Personnel, 23 (1), 46-56.
____________, and Purves, Dale (1954). A new method of job evaluation. Personnel, 31 (7), 73-80.
Henderson, Richard (1989). Compensation management, 5th ed., Englewood Cliffs, NJ, Prentice Hall.
Jaques, Elliott (1970). Equitable payment, 2nd ed., Carbondale and Edwardsville, IL, Southern Illinois University Press.
Jaques, Elliott (1979). Taking time seriously. Harvard Business Review, 57, (5),124-132
Kern, Dugan, Knuston, Andrew R., Shaughnessy, Mark, Tempesta, Mathew, and Erickson, Rob (1998). VALSPAR: a study in competency modeling. Minneapolis, MN, Unpublished Plan B Project, Industrial Relations Center, University of Minnesota.
Lanham, Elizabeth (1955). Job Evaluation. New York, McGraw-Hill Book Company, Inc.
Milkovich, George T., and Newman, Jerry M. (1996). Compensation. 5th ed., Chicago, IL, Irwin.
Milkovich, George T., and Newman, Jerry M. (1999). Compensation. 6th ed., Boston, MA, Irwin/McGraw-Hill
Otis, Jay L., and Leukart, Richard (1955). Job evaluation: a basis for sound wage administration. New York, Prentice-Hall, Inc.
Paterson, Thomas (1972a). Job evaluation: a new method. Volume 1, London, Business Books.
Paterson, Thomas (1972b). Job Evaluation: a manual for the Paterson method. Volume 2, London, Business Books, 1972b.
Paterson, Thomas, and Husband, T. M. (1970). Decision-making responsibility: yardstick for job evaluation. Compensation Review, 2 (2), 21-31.
Patton, John A., and Smith, Jr., Reynold S. (1949). Job evaluation. Chicago, IL, Richard D. Irwin.
Roth, Lawrence, and Azevedo, Ross E. (1992a). Identifying inequities in comparable worth implementation. CURA Reporter.
Roth, Lawrence, and, Azevedo, Ross E. (1992b). Legislatively mandated comparable worth in Minnesota local governments. Report to the Center for Urban and Regional Affairs, University of Minnesota.
Rynes, Sara L., and Milkovich, George T. (1986). Wage surveys: dispelling some myths about the "market" wage. Personnel Psychology, 39 (1), 71-90.
Zollitsch, Herbert G., and Langsner, Adolph (1970). Wage and salary administration. 2nd ed., Cincinnati, OH, South-Western Publishing Co.