Volume 6, No. 2 December 2003
By
F.J. Arcelus
University of New Brunswick, Canada
And
Patrick Doran
Zayed University, United Arab Emirates
Abstract
This paper evaluates the extent to which the decrease in total factor productivity growth that is alleged to have occurred in the last few years is also reflected in corresponding decreases in labour productivity growth, among key provinces and sectors of the Canadian economy. The analysis is based upon non-parametric productivity comparisons, for the 1984-1998 period. Data envelopment analysis is the methodological tool selected for the measurement of total factor productivity and hence of operational effectiveness to assess the extent to which sectoral productivity differences across Canadian regions represents a barometer of global competitiveness. The evidence indicates that labour productivity is growing. Factors associated with economies of scale appear to be the main source of inefficiency, as expected in a spatial setting. These inefficiencies are reflected mostly in increasing returns to scale, which enhances the competitiveness potential of the regions' economic base and of the industries in their midst.
INTRODUCTION
The crucial role played by labour productivity in economic growth and increased competitiveness, both across regions and worldwide is uncontested. This explains why there has been a substantial revival of interest in regional/sectoral growth and productivity problems. This revival is due largely to two factors. The first is embedded in the increasing political saliency of regional disparity issues and of ways to reduce these differences. Underlying this revival is the realisation, based upon the work of Porter (1990), of three important considerations. First, total factor productivity improvement is the key to increasing a country's global competitiveness and thus to realizing long-term economic success (Ezeala-Harrison, 1995; Perraton, 2003). As Porter and Martin (2000:29) state, "Relentless innovation and upgrading of productivity are the keys to international competitiveness in the modern economy." Second, enhancing labour productivity over time is the only way to consistently increase per capita income (Center for the Study of Living Standards, 1998; Ivanova, et.al., 1997). Third, the trend towards globalization strengthens the case for the role of regions as sources of innovation and comparative advantage (Martin and Sunley, 2003; Porter, 2001, 2002; Staber, 1996). This last point represents the "paradoxical consequence of globalization in which the ever greater integration of national and regional economics into the global one accentuates, rather than minimizes, the significance of the local context for innovative activities." (Wolfe and Gertler, 1999:1)
The second factor relates to the emergence of economic endogenous growth models (Lucas, 1988; Romer, 1990), which have provided alternate explanations for growth and convergence to the neo-classical paradigm (Solow, 1956). Steady-state growth, with short-term deviations attributable exclusively to random shocks, is no longer inevitable. Rather, the role of regional policy is now more interventionist, more interested in sectoral structure and technological diffusion across regions (Gunderson, 1998; Wernerheim and Sharpe, 2003), instead of being purely distributive. Convergence can also be explained with technical progress and efficiency rather than simply through decreases in the marginal productivity of physical capital and it is an important determinant of a firm's location decisions (Gunderson, 1998). Barro and Sala-i-Martin (1995) discuss the differences between the neo-classical and the endogenous growth models and Clark, et.al. (2000) present the main issues associated with the spatial component of economic growth.
One of the latest of a long line of Canadian regional disparity studies is that prepared by the Centre for the Study of Living Standards (1998). It summarises the main theoretical and empirical issues associate with the productivity of Canadian regions (see also Ezeala-Harrison, 1995; Gunderson, 1995; Porter and Martin, 2000; Wolfe and Gertler, 1999). Its website (http://www.csls.ca) is also the source of all the data used in this paper. Its primary point is that productivity growth represents the key to economic success. Among the main findings of this study, for the purposes of this paper, are the confirmation of the continuous decrease in total factor productivity since 1993, and the importance of the "three-way complementarity between physical capital, human capital, and technological progress" (Centre for the Study of Living Standards, 1998:2)
In view of these trends and especially of labour's crucial saliency in them, this paper revisits the issue of productivity trends of the Canadian regional economies and of the sectors in their midst. Its purpose is to determine the extent to which the decrease in total productivity growth that is alleged to have occurred in the last few years is also reflected in corresponding decreases in labour productivity growth. The analysis is based upon productivity comparisons, for the 1984-1998 period, among three provinces and three sectors of the Canadian economy. The three provinces selected consist of a "have-not" (New Brunswick), a "middle of the road" (Manitoba) and a "have" (Ontario). Two key sectors of the Canadian economy are also selected, namely agriculture and manufacturing, as well as the all-industries counterpart. The model used as a framework of analysis is based upon the non-parametric approach to productivity and efficiency measurement (PEM, hereafter) of Färe, Grosskopf and Lovell (1994) and Färe and Grosskopf (1996). This theoretical construct is briefly described in the next section, to be followed by a discussion of the empirical results. The basic conclusion is that declines in total factor productivity may be attributable to economies-of-scale factors rather than to labour productivity considerations. The Conclusions section expands upon this issue.
THE METHODOLOGICAL FRAMEWORK
The PEM model is essentially a benchmarking efficiency model, based on the Data Envelopment Analysis (DEA, hereafter) framework (Cooper, et.al., 2000a) and the methodological suggestions of Dyson, et.al. (2001). Each "DMU" (Decision-Making Unit) is measured relative to a best practice frontier, formed by the performance, i.e. the efficiency, of "related" units. Here, a DMU represents a province/sector/year and the related DMUs are the observations for the 1984-1998 period for each province/sector. Following the conclusions reached by the Centre for the Study of Living Standards (1998), the two inputs associated with each DMU and subsequently used for the computation of the best practice frontier include measures of human and physical capital. Specifically, the two inputs are the total number of hours per year per worker employed (HW) and the capital stock per worker employed (CSW). The output is a measure of the GDP per worker employed, namely the value added per worker employed (VAW). Efficiency is measured in terms of the transformation of the minimum possible number of units of the inputs, HW and CSW, into the maximum possible number of units of the output VAW. Within this context, a DMU is said to be efficient if it is not possible to increase the value of the output without increasing the usage of at least one input. Alternatively, a DMU is said to be efficient if it is not possible to decrease the usage of an input without decreasing the value of the output (Cooper, et.al., 2000a). This definition corresponds to the Pareto-efficiency concept of economics (Varian, 1999).
There are several advantages to using a non-parametric model, such as PEM, over that of its traditional production-function counterpart, to model the input-output relationship. This is primarily due to the ability of PEM to relax four restrictive assumptions embedded in the traditional neoclassical model, based upon the work of Solow (1956) identified in the previous section. These assumptions are (Arcelus and Arocena, 2000:106-107): "(i) the definition of a specific form of an underlying production function that characterizes the existing technology, such as the Cobb-Douglas production function; (ii) constant returns to scale; (iii) an optimizing behaviour, with no room for inefficiencies, be it technical or allocative; and (iv) the use of a Hicks-neutral technological change to calculate total factor productivity." For computational purposes, the first restrictive assumption is the most important one, because it affects directly the estimation of the weights that define the input/output relationship. In PEM, these weights vary with each observation and the determination of their values forms an integral part of the efficiency measurement process. In contrast, the traditional approach requires the computation of coefficients, which are normally constant throughout the time period under consideration because their estimation is based upon a regression-based average-performance criterion. As for the other three, PEM allows for the testing of the hypotheses related to the appropriateness of the assumptions. In fact, as stated earlier, one of the main conclusions of this report is that non-constant returns to scale, a violation of the second assumption, accounts for a large part of the recent decrease in total factor productivity. This justifies the selection of DEA as tool for the measurement of total factor productivity and hence of operational effectiveness to assess the extent to which sectoral productivity differences across Canadian regions represents a barometer of global competitiveness.
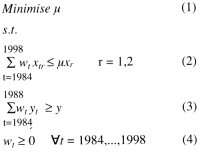
The starting point of the efficiency measurement process is the constantreturns- to-scale (Charnes, et.al., 1981) version of the DEA formulation, normally denoted by CCR. In this paper, there are two inputs and one output. For each province/sector combination, let (i) wt , t=1984,...,1998, be the weight assigned to the t-th DMU; (ii) xti be the values of the inputs CSW (i=1) and HW(i=2) associated with the i-th DMU; and (iii) yt be the corresponding value of the output VAW. Then, the CCR formulation for t-th DMU may be expressed as follows:
The interpretation of the CCR/DEA formulation is straightforward. DEA generates a hypothetical DMU, which is a composite of all t=1984,..., 1998 DMUs under consideration. Each DMU�s efficiency is compared to that of the composite. The inputs of the composite are modelled, in the left-hand side of each input constraint in (2), as the weighted average of the t values for the corresponding input. Similarly, the output of the composite is modelled in the lefthand side of the output constraint in (3), as the weighted average of the output values of the t DMUs. The same weights, i.e. the wts, t=1984,...,1998, are used for the inputs and the output. In accordance to the definition of efficiency alluded to earlier, the objective function, denoted by ( in (1), minimises the proportion of the inputs used in the generation of the output VAW. The right-hand side of (3) indicates that the output level generated by the composite cannot be below that produced by the DMU being evaluated. Similarly, the right-hand side of (2) indicates that the input levels used by the composite in the generation of VAW cannot exceed the efficient input consumption level, i.e. ut xti, of the DMU under evaluation. Finally, (4) merely indicates that the weights must be non-negative.
The development of PEM requires consideration of two additional characteristics of the production process, likely to impact upon the generation of the best practice frontier and thus upon efficiency/productivity computations. These are inputs disposability and returns-to-scale. Weak disposability of inputs, denoted by WDI, indicates the presence of congestion, which implies the need for costly reduction in the production of output to reduce wastage in input utilisation. "Evidence of congestion is present when reductions in one or more inputs can be associated with increases in one or more outputs - or, proceeding in reverse, when increases in one or more inputs can be associated with decreases in one or more outputs - without worsening any other input or output." (Cooper, et.al., 2000a:2) Conversely, strong output disposability, denoted by SDI, indicates absence of congestion and is part of the neoclassical assumptions that are tested in this study. Returns-to-scale is related to the change in output generated by a given change in inputs. Constant returns to scale (CRS) are said to occur when inputs and outputs change at the same rate, whereas variable returns (VRS) are said to occur when inputs and outputs change at a different rate. Evidence of VRS is prevalent in spatial economics, with its corresponding important impact upon sectoral agglomeration within the regions (Clark, et.al., 2000). Of importance also for the purposes of this paper is whether or not the rate change in the inputs and in the outputs could occur in the same direction (IRS, increasing returns to scale) or if the returns to scale could be non-increasing (NIS).
With these definitions, the computation of the efficiency indices proceeds along the following steps (Färe, et.al., 1994; Färe and Grosskopf, 1998a; Nasierowski and Arcelus, 2003). Let subscripts s and d refer to returns-to-scale and inputs disposability respectively, where (i) s=CRS, VRS, NIS represents the type of returns-to-scale exhibited by the best production frontier; and (ii) d=SDI, WDI identifies the type of disposability of inputs. Further, let usd be the efficiency index with characteristics (s,d), for a province/sector combination. The CCR formulation in (1)-(4) above yields the best practice frontier characterized by (s,d)=(CRS,SDI), i.e. by strong disposability (SDI) of outputs and constant returns to scale (CRS). To test for weak disposability of inputs (d=WDI), (2) should be replaced by a strict equality constraint labelled (2'). Also, to obtain the VRS and the NIS frontiers, a fifth constraint should be added to the CCR formulation, i.e.
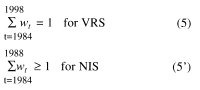
Then, the efficiency indices uCRS,SDI, uVRS,SDI, uVRS,WDI and uNRS,SDI required for the computations are obtained from the DEA formulations categorised, respectively, by [(1)-(4)], [(1)-(5)], [(1), (2'), (3)-(5)] and [(1)-(4), (5')]. From these indices, it is possible to calculate a congestion index, CI=uVRS,SDI/uVRS,WDI≤1, which measures the extent to which a given DMU is free of congestion. There is also a scale index, SI=uCRS,SDI/uVRS,SDI≤1, which indicates the extent to which a DMU is operating at CRS (SI=1) or not. If not, the scale inefficiency is due to increasing returns-to-scale, if uNIRS,SDI=uCRS,SDI and to DRS (decreasing returns to scale), if uNIRS,SDI>uCRS,SDI. In this way, uCRS,SDI, the original CCR inefficiency measure obtained from (1)-(4), is decomposed into three sources of inefficiency, namely scale, congestion and pure technical inefficiencies, as follows:
uCRS,SDI = (SI)x(CI)x(uVRS,WDI) (6)
Based upon this framework of analysis, the next section reviews the empirical results.
THE EMPIRICAL RESULTS
Tables 1-3 summarise the efficiency results. As stated earlier, the information includes efficiency estimates for the 1984-1998 period, three Canadian provinces, Ontario (Table 1), Manitoba (Table 2) and New Brunswick (Table 3) and three sectors of the economy, agriculture, manufacturing and all industries. Such a cross-section is representative of the Canadian economy. In accordance to the methodology described in the previous section, each table includes four effectiveness indices. These are the usd's, with (s,d)= [(CRS,SDI); (VRS,SDI); (VRS,WDI); (NIRS,SDI)]. This is followed by the values for the scale (SI) and congestion (CI) indices and by the determination of the type of returns-to-scale exhibited by each DMU. The discussion that follows emphasises the components of the efficiency/productivity decomposition in (6). All computations have been carried out with the OnFront software package (Färe and Grosskopf, 1998b).
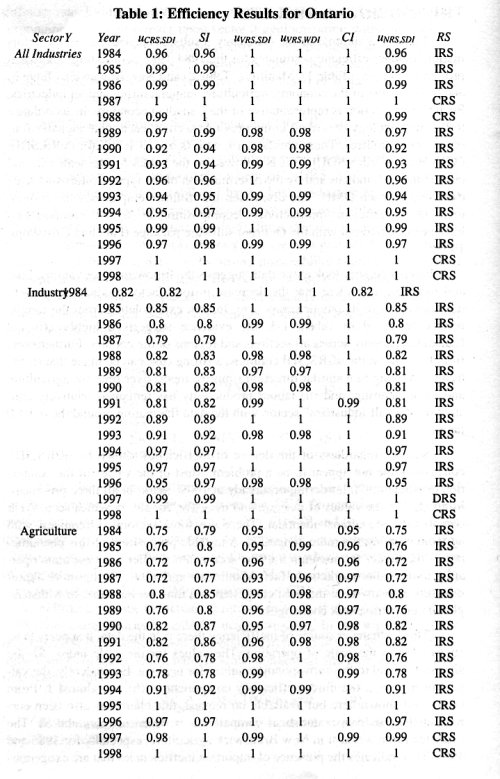
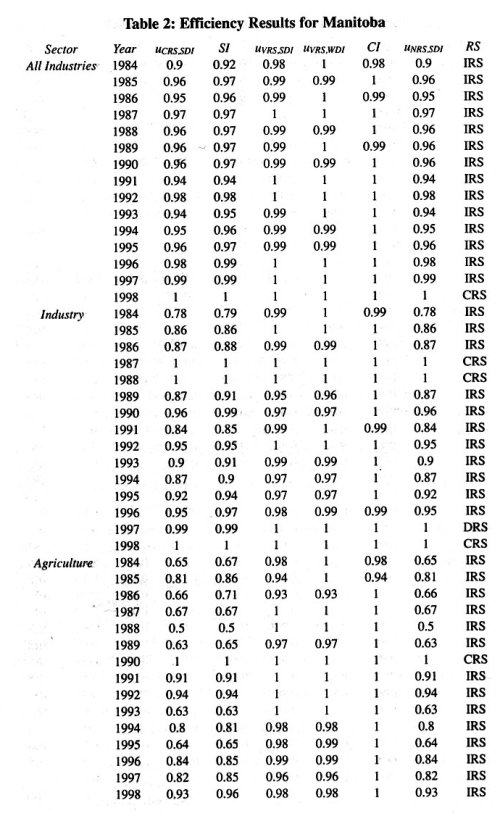
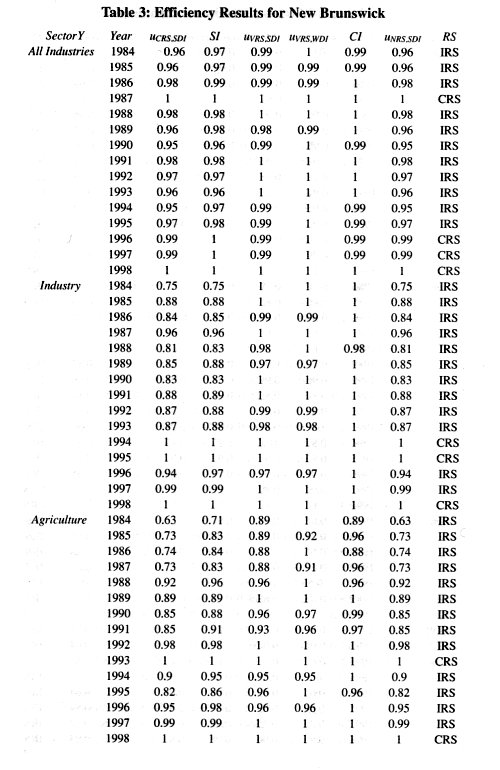
Even a cursory look at the data suggests the following observations. First and foremost, it is clear that the decrease in total factor productivity growth does not apply to its labour component. In fact, extrapolating from the sample results presented in Tables 1-3, the evidence suggests a highly efficient Canadian economy across all sections and regions of the country. Furthermore, from the data on the uCRS,SDI columns, a strong case can be made that (i) the trend is moving in a similar direction (improvement) over time for agriculture and manufacturing; and (ii) labour productivity has remained relatively constant for the "all-industries" sector, with the data fluctuating around the 0.9-1.0 range.
Second, regardless of the degree of inefficiency shown by uCRS,SDI, congestion doe not appear to be a problem. Most of the values of the congestion coefficient, CI, bordering or already at 100% mark, in all three provinces. Equivalently, the values of uVRS,SDI and uVRS,WDI, for any province sector/year combination are almost identical. There are some sectoral differences, with agriculture being the more congested. A testable proposition of this phenomenon is the higher fragmentation of the sector into smaller business units operating into smaller markets. In fact, Manitoba's agriculture, being more export oriented, appears to be the least congested and thus the best able to withstand global competitiveness challenges.
Third, whatever source of inefficiency there is in the data, it appears to be attributable to the scale of operation. The values for the scale index, SI, are almost identical to the corresponding values for uCRS,SDI. Equivalently, the values for uVRS,WDI, the third inefficiency component in (6), are almost 1. From results not shown here but available on request, this claim has also been corroborated by pair-wise statistical comparisons between uCRS,SDI and SI. The evidence is the weakest in New Brunswick agriculture, especially for 1985 and 1987. This indicates the presence of important inefficiencies that are exogenous to those identified in the decomposition of (6). It also ties in with earlier studies (Auer, 1975; Economic Council of Canada, 1975) that identify scale as the most important factor explaining labour productivity in the poorer provinces.
Fourth, the evidence from the returns-to-scale column indicates that labour productivity throughout the 1984-1998 period under consideration has enjoyed an almost continuous growth at an increasing rate, to judge by the number of ISRs. The data also indicate that such a trend appears to be reversing in the last two years, where CRS predominates, except for the worrisome DSR exhibited by the manufacturing sectors of Ontario and Manitoba. A likely explanation from Production Economics for this phenomenon is that it marks the beginning of a more mature stage of development in the life cycle of these economies.
SOME CONCLUDING COMMENTS
This paper has endeavoured to determine whether labour productivity across a sample of regions and sectors of the Canadian economy has followed the decreasing trend exhibited by total factor productivity in the last 20 years and thus become a hindrance to meeting the competitiveness challenges from abroad. On the basis of the evidence presented here, the answer is unequivocally in the negative. The analysis has been placed within the context of a nonparametric productivity approach, based upon the DEA methodology. One of the main imports of the analysis is the three-way decomposition of the degree of inefficiency. The saliency of the first two, i.e. of the congestion and of the scale factors, can be assessed in the paper itself. The other, dealing with the residual or pure technical efficiency factor, cannot be explained by the model and requires further analysis.
Once other factors are taken into consideration, the evidence is quite clear that labour productivity is growing. This result by itself augurs high degrees of global competitiveness in the future, for the regions and sectors under study. Scale appears to be the main source of inefficiency, as expected in a spatial setting. The evidence also suggests some areas where further investigation is certainly warranted. New Brunswick agriculture seems to suffer from some special inefficiency concerns, for reasons related neither to scale nor to congestion. Determining the nature of these concerns is outside the scope of this paper and thus requires further investigation. The end of increasing returns-to-scale also deserves further treatment, since it has serious implications for the development of employment and inflation policies. Another important issue is the search for the reasons for the productivity growth decreases, now that decreases in labour productivity growth have been ruled out as a determinant. Even though the literature is quite abundant on this topic (Centre for the Study of Living Standards, 1998; Ezeala-Harrison, 1995; Gunderson, 1995; Porter and Martin, 2000; Wolfe and Gertler, 1999), no generally acceptable conclusions have been reached and it also remains subject of additional work.
Finally, inefficiency appears to be primarily due to the fact that these economies are exhibiting increasing returns-to-scale. Together with their normally small size, regions/sectors exhibiting increasing returns are normally associated with the earlier stages of growth. Whereas these trends are promising in terms of improving their global competitiveness position, it is worth keeping in mind that "(t)he way forward for Canada to greater competitiveness is through uniqueness not replication, through bold strategy choice not operational effectiveness." (Porter and Martin, 2000, p. 24) Early indications from the negative results on total factor productivity indicate that maybe Canada has not fully heeded the warning of Porter (1991) and thus too many sectors still follow the imitation/replication approach rather than the innovative approach. The study of these and other issues justify additional research.
ACKNOWLEDGEMENTS
Financial assistance for the completion of this research from the Natural Science and Engineering Research Council to the first mentioned author and from the Faculty of Administration of the University of New Brunswick to both authors is gratefully acknowledged
REFERENCES
Arcelus, F. and Arocena, P. (2000). Convergence and productive efficiency in fourteen OECD countries: a non-parametric approach, International Journal of Production Economics, 66, 105-117.
Auer, L. (1975). Disparities of Productivity and Growth in Canada, Ottawa: Economic Council of Canada.
Barro, R. and Sala-i-Martin, X. (1995). Economic Growth, Boston: McGraw Hill.
Centre for the Study of Living Standards, (1998). Productivity: Key to Economic Success, Ottawa.
Charnes, A., Cooper, W.W. and Rhodes, E. (1981). Data envelopment analysis as an approach to evaluating program and managerial efficiency - with an application to the program follow-through experiment in U.S. public education, Management Science, 27, 668-688.
Clark, G.L., Feldman, M. and Gertler, M.S. (2000). Oxford Handbook of Economic Geography, Oxford: Oxford University Press.
Cooper, W.W., Seiford, L.M. and Tone, K. (2000a). Data Envelopment Analysis, Boston: Kluwer.
Cooper, W.W., Seiford, L.M. and Zhu, J. (2000b). A unified model approach for evaluating inefficiency and congestion with associated measures in DEA, Socio-Economic Planning, 24, 1-25.
Dyson, R.G., Allen, R., Camanho, A.S., Podinovski, V.V., Sarrico, C.S. and Shale, E.A. (2001). Pitfalls and Protocols in DEA, European Journal of Operational Research, 132, 245-259.
Economic Council of Canada (1975). Chapter 5: Behind Labour Productivity Differences, in Living Together, Ottawa: Queen's Printer.
Ezeala-Harrison, F. (1995). Canada's global competitiveness challenge: trade performance versus total factor productivity measures, American Journal of Economics and Sociology, 54, 57-76.
Färe, R. and Grosskopf, S. (1996). Intertemporal Production Frontiers, Boston; Kluwer.
Färe, R. and Grosskopf, S. (1998a). Reference Guide to OnFront, Lund: Economic Measurement and Quality i Lund AB.
Färe, R. and Grosskopf, S. (1998b). User�s Guide to OnFront, Lund: Economic Measurement and Quality i Lund AB.
Färe, R., Grosskopf, S. and Lovell, C.A.K. (1994). Production Frontiers, Cambridge: Cambridge University Press.
Gunderson, M. (1998). Regional impacts of trade and investment on labour, Canadian Journal of Regional Science, 23, 197-225.
Ivanova, I.M., Arcelus, F.J. and Srinivasan, G. (1997). Assessing country differences in international competitiveness, Journal of International Management, 3, 89-118.
Lucas, R. (1988). On the mechanics of economic development, Journal of Monetary Economics, 22, 3-42.
Martin, R. and Sunley, P. (2003). Deconstructing clusters: chaotic concept or policy panacea?, Journal of Economic Geography, 3, 5-35.
Nasierowski, W.and Arcelus, F.J. (2003). On the efficiency of national innovation systems, Socio-Economic Planning Sciences, 37, 215-234.
Perraton, J. (2003). Balance of payments, constrained growth and developing countries: an examination of Thirlwall's hypothesis, International Review of Applied Economics, 17, 1-22.
Porter, M. (1990). The Competitive Advantage of Nations, New York: Free Press.
Porter, M. (1991). Canada at the Crossroads, Ottawa: Business Council on National Issues.
Porter, M. (2001). Regions and the New Economics of Competition, in A. Scott (Ed.) Global City Regions, Oxford: Blackwell, 139-152.
Porter, M. (2002). Regional Foundations of Competitiveness and Implications for Government Policy. Paper presented at the Department of Tyrade and Industry Workshop on Regional Competitiveness, DTI, London.
Porter, M. and Martin, R. (2000). Canadian Competitiveness: Nine Years after the Crossroads. Paper presented at the CSLS Conference on the Canada- U.S. Manufacturing Productivity Gap, Ottawa.
Romer, P. (1990). Endogenous technological change, Journal of Political Economy, 98, 71-102.
Solow, R. (1956). A contribution to the theory of economic growth, Quarterly Journal of Economics, 70, 65-94.
Staber, U. (1996). Networks and Regional Development: Perspectives and Unresolved Issues, in U. Staber, N. Schaefer and B. Sharma, B. (Eds.) Business Networks: Prospects for Regional Development, Berlin: Walter de Gruyter, 1-23.
Varian, H.R. (1999). Intermediate Economics, New York: Norton.
Wernerheim, C.M. and Sharpe, C. (2003). "High order" producer services in metropolitan Canada: how footloose are they?, Regional Studies, 37, 469- 490.
Wolfe, D. and Gertlet, M. (1999). Globalization and Economic Structuring in Ontario: From Industrial Heartland to Learning Region? Paper presented at the NECSTS/RICTES-99 Conference on Regional Innovation Systems in Europe, Donostia, Spain.