Competitiveness through Increased Added Value: A Challenge for Developing Countries
Per LindLinkoping University, Sweden
Abstracts
A rising standard of living is the result of many contributing factors interacting in a complex pattern. One such contributing factor is the capacity of a nation's firms to achieve high levels of productiv ity, and to increase productivity over time. Small and Medium Enterprises (SMEs) in developing countries have significantly lower productivity, as measured by added value per employee in comparison with developed countries. One reason for this imbalance is the traditional business practice in many developing countries of price competition as opposed to product innovation and superior customer value. The concept of added value is used to characterise three business strategies with decreasing, unchanged and increasing added value. In the third strategy the increased added value is the result of a price increase, justified through improved functional product or service quality. Since product improvement mostly leads to higher costs, the crucial issue is to find a method to analyse when increased sales price, and hence also increase in added value, leads to lower profit due to higher production costs. The model suggested to cope with this issue is based on three parameters: added value grade, profit margin and refinement cost grade.Introduction
1 The concept of added value is one of the more fundamental concepts in economics and business literature as judged by numerous textbook references and general management literature ( Meredith and Shaffer, 2002; Jones and Tilley, 2003). In spite of this there are a few occasions where the significance of added value such as its role as indicator of a firm's business and innovation capability, is explicitly discussed. The purpose of this paper is to show how the concept of added value can be used to demonstrate the very essence of business, and to illustrate how added value and customer value are two sides of the same coin.
2 The significance of added value comes from the fact that value creation is what makes enterprises competitive. A conscious business strategy focusing on adding value to products and services is still lacking in many small and medium enterprises (SME), particularly in developing countries. Creating management awareness about the linkage between added value, customer value and profit is therefore an urgent issue in most developing countries. It is therefore imperative that small and medium enterprises in developing countries grasp the fundamentals of generating value to their clients.
3 Through interviews with about two hundred SME managers in African and Asian countries, the author has found that most managers accept, in principle, the business idea of an active customer dialogue. However, in reality, business is conducted in a most traditional way, with decisions made incrementally from previous commitments rather than from analysis of customer information. This paper is therefore a contribution to the discussion on how to improve business performance in SMEs in developing countries. The discussion below is partly based on a model that takes into account added value, profit margin and the refinement grade. The model is used to illustrate how an increase in added value may lead to a decline in profit margin. The model is intended to be used as a platform to discuss the nature of added value and its significance as a measure of enterprise performance.
Background
4 International trade is dominated by industrialised countries whose trade share is around the 80 per cent mark. This should
be compared to developing regions such as Latin America and Africa. These countries'trade share is only 6 and 2 percent respectively
(O'Brien and Williams, 2004). In contrast, the world's 48 poorest countries have seen their share of world trade decline by
more than 40 percent since 1980 to a mere 0.4 percent in 2000 (Oxfam, 2000). In many developing countries trade means exporting
primary commodities and importing high added value products. Apart from being exposed to vulnerability from a price mechanism
that poorer countries have limited chance of influencing, the high costs for imports give little margin for investment in
technology and skills. In a few developing countries (e.g. China, India and Brazil) there was early a shift away from this
traditional dependence on the export of primary commodities to more labour-intensive and low technology manufactured products
(O'Brien and Williams, 2004). More recently this process has partly developed into added value production. For example, Indian
software industry is often cited in this context as an example of a highly competitive and export oriented industry sector
based on human capital. However, the same industry is reported to represent the lower value-added end of the global software
market (Forbes and Wield, 2002).
“Sri Lanka has an annual income from spice exports amounting to 85 million USD. Ninety percent of this export is sent in
bulk form and not in added value form, the highest value addition of spices being in the perfume industry. The maximum amount
of value addition that could be obtained from the perfumery industry could range from between 3 to 30 fold"(The Business Standard,
Colombo. January 30, 2004).
5 An industry strategy that leads to improved added value production must therefore be of high priority in developing countries, especially more the gap between developing and developed countries measured by added value per employee is substantial. It should therefore be important to analyse what hampers added value growth and what can and should be done in order to pave the way for increased added value production.
The Concept of Added Value
6 The general definition of added value is the difference between a product's market sales price and the cost of input material. The definition highlights the important aspect of added value. Normally that value is not determined by the producer but by the market. a product's added value is not determined by the producer but by the market. Economic theory states that the value of a product is not tied to the cost of production or inherent in the product but by a judgment made by the user's level of satisfaction obtained through its usage or consumption (Menger, 1950). It is therefore partly misleading to claim that changes in the production process lead to added value growth (e.g. Forbes and Wield, 2002). Improvements and innovations in the production may lead to better product quality, which in turn may motivate a higher price and thus higher added value. However, precondition for this to happen is that there are customers who value the improved quality and are willing to pay a for it.higher price.
7 The value-chain concept introduced by Michael Porter in the 1980s emphasised the role of the organisation as a system that creates value for the customer (Porter, 1985). Increased customer value does not automatically lead to increased added value but increased customer value may lead to increased added value under certain conditions (e.g. if and when the customer realises and accepts that the higher customer value justifies a higher price). When improved product functions (e.g. quality and service) result in higher customer value they may justify a higher sales price and thus also higher added value. The creation of added value should therefore be a challenge and strategy for any firm since increase in added value will not happen unless the customer value is satisfactory. As the following analysis shows, the difference in adding value creation between developing and developed countries is significant. .
Added Value in Developing and Developed Countries
8 The measure used in the following analysis is added value per employee, with data from UNIDO International Yearbook on Industrial Statistics (UNIDO 1999, 2003). Ten different industry sectors have been selected, viz. Textile (321), Footwear (324), Furniture (332), Industry Chemicals (351), Rubber products (355), Plastic products (356), Iron and steel (371), Metal products (381), Electrical machinery (383) and Transport equipment (384). Numbers in brackets refer to the international ISIC code - International System for Industry Classification.
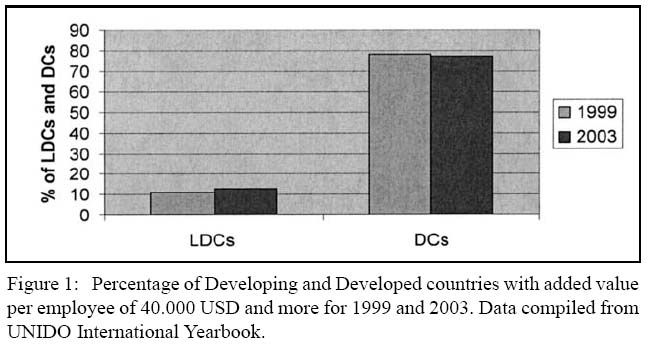
9 Countries have been arbitrarily assigned into into six groups for each industry sector, with each group having a range of added value per employee (total added value produced in the sector per year divided by total number of employees employed by the sector). The groups are defined as follows (USD per employee): less than 5,000 between 5,000 and 10,000, between 10,000 and 20,000, between 20,000 and 30,000, between 30,000 and 40,000, and more than 40.000 USD per employee. The six groups are numbered from one to six. The UNIDO Yearbook creates the number of countries that fall within each group. Figure 1 shows a comparison and between developing and developed countries (UNIDO classification) for the number of countries with added value per employee more than 40.000 USD. The group comparison is made between all ten industry sectors specified above for the years 1999 and 2003.
Figure 1: Percentage of Developing and Developed countries with added value per employee of 40.000 USD and more for 1999 and 2003. Data compiled from UNIDO International Yearbook.
Display large image of Figure1
10 Figure 1 shows that there has been a slight increase in the average of the added value produced by the sector from 1999 to 2003 in developing countries. There has also been a small decrease in the same value for developed countries in the same period. In spite of this, employees in developed countries produce an average of six times as much added value as employees in developing countries.
11 When all the sectors (one to six) are compared, the average added value per employee is 45.700 USD for developed countries and 16.800 USD for developing countries.
12 The values above are based on macro data at regional and country levels, which is accumulated added value data from individual firms within the regions. The rest of the paper will concentrate on reasons for the imbalance.
Added Value and Customer Value
13 In its simplest form customer value can be defined as perceived benefits of a product or service in relation to perceived sacrifice (i.e. price and other transaction costs ) (Naumann, 1995). Customers are interested in obtaining quality at a good price. They use product and service attributes to evaluate the benefits that will be received (Stock and Lambert, 2001). In a sales situation involving a producer and a customer it is possible to identify three business strategies depending on the success or lack of success of the producer's marketing attempts. If the seller fails to sell the product or service, the following strategies can be expected:
- Reduce the price towards a amore attractive ratio between product performance and price, hoping that the customer will buy;
- Improve performance (new functions, better service etc) but without increasing the price; becoming more attractive as supplier;
- Improve performance and increase the price, hoping that the improved product performance will justify a higher price.
14 The first two strategies may be attractive to the customer and ultimately result in a sale. However, both alternatives will result in lower profit and are therefore poor alternatives - in the first case because of lower revenue, in the second case because the enhanced performance (the new functions) are likely to result in higher production costs. Therefore, the third alternative is preferable under the assumption that the increased price can compensate for the added costs incurred by the higher product performance.
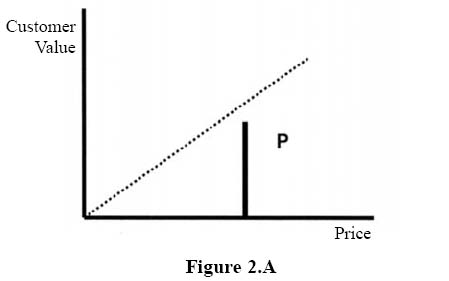
15 To elaborate on the discussion above we introduce the notion of indiffer ence curve, i.e. an imaginary optimal price-performance curve, representing products and services that a consumer may acquire at price levels that in the consumer's subjective view are reasonable. The vertical axis in Figure below shows the perceived customer value and the horizontal axis shows the monetary price of the product or service. Each point in the diagram corresponds to a particular combination of price - customer value. A consumer choosing among products located along the indifference curve would be indifferent among the offerings. Products offering price - value combinations located below the indifference curve yield a lower consumer preference than those yielded by products along or above the indifference curve.
Figure 2.A
Display large image of Figure 2
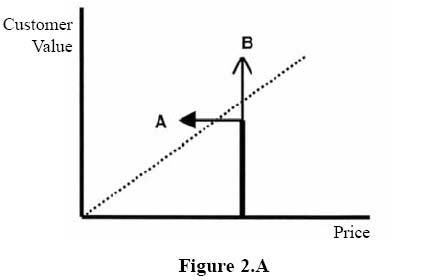
16 As customer value does not reach the price-performance curve for the actual price P in the diagram above, the perceived sacrifice (cost) is higher than the perceived benefits. The producer therefore has two options - either to reduce the price of the product (or service) so much that the price/performance ratio becomes attractive to the customer, or alternatively to enhance its performance or functionality so that the customer values the offering higher. The two alternatives A and B are shown in Figure 2.B.
Figure 2.B
Display large image of Figure 3
17 Alternative A means reduced price and hence a better performance / price ratio which is now more attractive to the consumer.
In case this will also result in a sale, the producer's income will be lower, and if the costs are unchanged the profit will
be reduced. This is a scenario that is well known in many developing countries with competition based on price. The lower
sales price may result in higher volumes sold, and the total revenue may be increased. According to our definition this does
not lead to higher added value, but rather a reduction of added value.
IE Electronics is a manufacturer of electrical appliances such as TV antennas and other types of equipment for the electronics
consumer market in Sri Lanka. Being customer oriented is part of the company's strategy, and the company has therefore hired
new a and dynamic sales staff to cope with market demand and customer requirements. The new development has led to increased
operating costs (salaries and over-head), and the owner/manager has advocated a price-cut on key products to meet competition,
especially from overseas vendors now entering into the local Sri Lankan market. This has led to red figures, which are expected
to turn into profit as sales will grow due to better customer service and lower prices.
The risk is that the red figures will continue as higher volumes and improved customer service require increased administration
costs and more employees. Reduction in both added value and profit margin may ultimately be the end effect of the price cuts.
(Interview with General Manager).
18 In alternative B the producer adds functions and/or features to the product, thereby improving product performance while the sales price remains the same. The new product and service attributes (e.g., new functions and features) do result in increased costs for the supplier with the same end-effect (i.e. reduced profit).
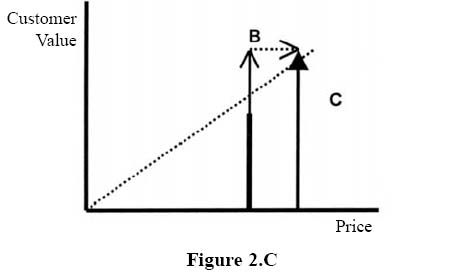
19 In this alternative (B) the consumer value may yield a surplus as the value - price combination is located as much above the indifference curve that the consumer accepts a price increase. This means that with the new extended product performance the perceived extra benefits are higher than for the original product, and hence justify the higher sacrifice (price). This is illustrated in Figure 2.C:
Figure 2.C
Display large image of Figure 4
20 The possibility for the producer to increase the price accordingly will depend on his ability to translate the added product
and service attributes to financial or other real benefits for the customer. If the producer fails in translating the improvements
into customer benefits they may go unrewarded and just result in extra costs that cannot be compensated for. If the price
can be increased to compensate for the extra costs profit will be unchanged or higher. The variables in price, costs and profit
must therefore be balanced. Many SMEs in developing countries are too often caught in a vicious circle from which they do
not escape. When encouraged to embark on an alternative business strategy aimed at higher added value, many enterprises find
it difficult to break away from the traditional price competition pattern and instead compensate for higher production costs
through increased sales price. Customer value as well as added value therefore remains at modest levels as per the following:
Lowest price to get the order ⇨ limited financial scope to develop new products, new materials, new types of service etc.
⇨ limited use of new skills to enhance present capacity ⇨ limited interest to bring in new employees with new knowledge/ideas
and acting as change agents (albeit at a higher cost) ⇨ limited input of new ideas to develop new business concepts or add
new product functions ⇨ little increase in customer value ⇨ price competition remains the primary business strategy ⇨ lowest
price to get the order.
21 This pattern may explain why so many manufacturing enterprises in the SME industry sectors produce a great number of different products in small quantities. As added value is low, these enterprises have few competitive advantages and therefore must accept orders that are possible to produce with existing production facilities at a price that the customers are willing to pay. Profits are mostly at low levels and the margin between profit and loss often so small that any extra costs incurred as a result of an added value strategy may seem too risky for many firms.
22 The three alternatives mentioned above describe three business situations that are well known to SME managers. In the first case, price reduction can under certain circumstances be justified if the strategy is to break into a new market. The strategy may be to keep the low price for a period and later revert to the original price. However, experience shows, however, that once the market has become accustomed to one price level there is resistance from the market to pay the original (higher) price unless there are obvious changes in the product offering. Often, price reduction is not a conscious strategy but a com-petative strategy come out of desperation. Another background strategy may let the reduced price lead to higher volumes sold. Already reduced profit margins may however, shrink even more if the extra volumes result in additional administrative and distribution costs.
23 In the second strategy the decision to add customer value to the product/service, at an extra cost for the producer is a conscious strategy with the assumption that the extra customer benefits will increase attraction of the product and lead to increased sales volumes. As in the previous strategy, the extra sales volumes may result in additional administrative and distribution costs.
24 In the third strategy the extra customer value justifies an increase in sales price, and hence also an increase in a value. Of the three strategies, the third is the most commercially interesting. The crucial question related to the third alternative is how can the extra costs incurred by the additional functions and/or service be compensated for through the higher price?
Analysing the Three Strategies
25 Three parameters are used for the following discussion: (m) is the cost of purchased material that is refined through a production process to a finished product; (q) is the cost to produce the finished product, and (Q) is the sales price. Added value is defined as the difference between sales price and input material, i.e. Q - m.
26 Added value has two components Q - m = (Q - q) + (q - m), i.e. sales surplus (Q-q) and in-house production costs (q-m).
27 The following table summarises the three strategies with regard to changes in sales surplus, production costs and added value:
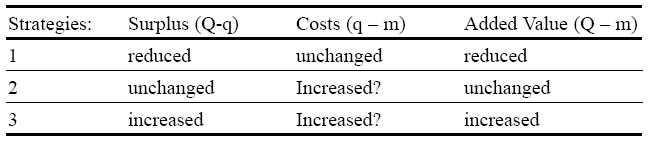
Display large image of Table 1
28 For both strategies two and three it is assumed that the costs (q - m) are increased; for strategy three it is uncertain if the increased production costs are higher than the increase in added value. This is of great importance, and we shall return to this point in the discussion below.
Strategy 1 (top)
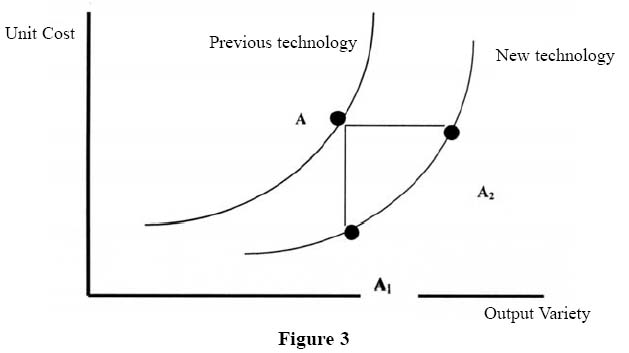
29 The alternative of reducing the price in order to increase sales can be justified if costs of production can also be cut, which may happen if new production techniques or new technologies are adopted. Technology is here used in its broadest sense (i.e. not only techniques but also the way of organising and managing techniques and related procedures as well as its psychological and philosophical implications and aspects). In Figure 3, the two technology trajectories illustrate how the use of a previous technology can produce a product at a certain unit cost and a certain output variety. Applying a newer technology means that the same product can be produced at a lower unit cost (A1) with the same output variety or with additional output variety with the same cost as before (A2), or in a combination of the two.
30 In many developing countries, the issue of adopting a new technology is not as straight-forward as may appear. Francis Stewart
describes the situation as follows:
“The technology available to a particular country is all those techniques it knows about (or may with not too much difficulty
obtain knowledge about) and could acquire, while the technology in use is that subset of techniques it has acquired. It must
be noted that the technology available to a country cannot be identified with all known techniques: on the one hand weak communication
may mean that a particular country only knows about part of the total methods know to the world as a whole. This can be an
important limitation on technological choice. On the other hand, methods may not be available because no one is producing
the machinery or other inputs required. This too limits technological choice"(Stewart, 1978).
Display large image of Figure 5
31 Jumping from one technology level to another that allows reduced production costs may be theoretically attractive and possible but with practical limitations. As an example, the Internet,has become a tool for information that is often mentioned as a suitable tool for SME managers in third world countries to gain access to information that was earlier unreachable for many. A simple example illustrates the barriers that many SME managers face when turning to the Internet for information about a new type of lathes.: Yahoo gives 224,000 responses! If we assume that 5 seconds is enough to view one response to find out whether that particular item could possible give the required information, it would take about 39 eight-hour working days before all items have been viewed. Additionally, Internet users in many developing countries would have longer response timesdepending on communication line capacity, it may take 0 to 15 seconds to view a response, double or triplinge the total time, i.e. 80 or 120 days. If the topic instead were 'robots'there are 2,690.000 responses (Yahoo) which would take about two years of continuous computer working. Even if the entered search key-words can be more qualifying, the number of possible useful items would still be large. Few SME managers would spend the necessary time to view all alternatives. Communication about new techniques therefore remains a hampering factor to adopting new technology in many developing countries.
Strategy 2 (top)
32 Here, the sales price is unchanged as additional features / functions are added. The underlying strategy may be to increase customer value and thereby also increase sales volumes since more potential clients are attracted due to the new features / functions. This will not either result in increased added value since the price is unchanged. It may, however, result in higher costs as higher volumes may ultimately result in more administration and additional sales staff.
33 If the new features / functions were based on newer technology the diagram above shows that the use of newer technology might allow increase in output variety, but without changes in costs. Local conditions such as lack of skilled personnel and the need for technical adaptations may, however, result in additional costs. As a consequence the additional output variety is many times achieved only at a higher cost than indicated by the diagram.
Strategy 3 (top)
34 Strategy 3 results in increased added value, but may also lead to higher costs. The crucial question is how to balance the higher costs with the increased price.
35 The critical point here is that many commercial relationships in developing countries lack dialogue between supplier and customer. Customer value is created when perceived benefit is greater than perceived sacrifice. It is therefore of utmost importance for the supplying firm to find out what are the expected or the perceived benefits to the client. Such information is only obtainable through dialogue, and through the creation of sufficient trust between the two parties. The aim of the supplier-customer dialogue should therefore be to realise how the supplier's products and services can contribute to improving the customer's business with his customers. The Customer's Customer Concept shown as Figure 4 is a simple way of highlighting the importance of a creative and explorative supplier-customer dialogue where not only selling but also listening to customer requirements is of importance.
Figure 4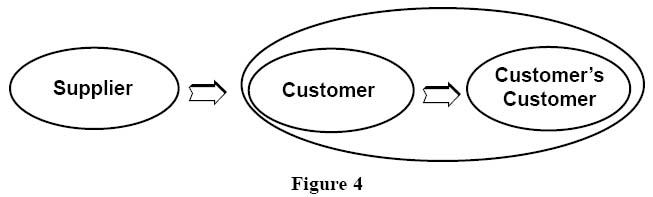
Display large image of Figure 6
36 The traditional contact between supplier and client ('Customer') is primarily to maximise the sales of the supplier's products
and services. In this traditional picture the supplier has little knowledge about the customer's market situation and no real
incentive to learn. Finding out more about the customer (and in particular about the customer's customer(s)) in order to learn
how the supplier's products and services may contribute to increased customer business will ultimately result in increased
trust and dependence on the supplier. By taking advantage of opportunities in every customer encounter, the customer-focused
enterprise creates mutually advantageous relations that transform customers into loyal advocates (Johnson, 1992). Customer
encounters are seen as opportunities to learn and inform, not just as opportunities to present and sell. When trust has been
created, such encounters will increase over time as customer and supplier learn more about each other's wants and opportunities
and become more mutually dependent. It is here important that the supplier can argue in favour of a reasonable price level.
Indian Casting Co. is a small casting company in Uttar Pradesh, the main product being motor blocks. Durability and material
strength are factors that determine the quality of motor blocks, and which are highly influenced by the degree of impurities
(e.g. carbon, magnesium) in the castings. An engine that malfunctions because of low quality motor blocks may jeopardize the
whole business of the engine manufacturer.
Indian Casting Co has therefore invested in a computer based control system for continuous monitoring of impurities of the
batches. The customer receives a protocol with each delivery, showing the quality of the motor blocks. The company is thereby
in the position of guaranteeing product quality to the customers who are prepared to pay a higher price compared to other
suppliers in the region who lack this service. The higher customer value has thus lead to more added value (Interview with
General Manager).
However, the increase in costs due to improved product performance may be higher than the increase in price, which leads to
a reduction in profit. We will next analyse this situation.
Added Value vs. Profit Margin
37 For the analysis we introduce the three parameters - Added Value Grade, Profit Margin and Refinement Cost Grade as
Added Value Grade (A): (Q - m) / Q
Profit Margin (P) : (Q - q) / Q
Refinement Costs Grade (R): (q - m) / q
where Q is sales price, q denotes production cost, and m is cost of material. Added Value Grade is thus the share of added
value to sales (or turnover); in practice a more appropriate measure than just added value as it enables comparison between
firms of different sizes. The same applies to parameters P and R.
38 Added Value Grade (A) is the share of revenue from own produced added value. Profit Margin (P) is the profit share of revenue, and Refinement Costs Grade (R) the share of own costs to product cost. From the definitions above one has the relation P = (A - R) / (1 - R).
39 The parameter L is now introduced as the ratio between surplus (Q - q) and costs (q - m), and can be expressed in P and R so that P = LR / (1 + LR).
40 The diagram below is the graphic representation of the expression P = (A - R) / (1 - R) and illustrates strategy 3 above, with added value grade before and after the increase in sales price. Figure 5 is the alternative graphic representation of P, now expressed as a function of R and with the parameter L in the form P = LR / (1 + LR) with different values of L illustrating how both surplus and costs vary in strategy 3.
Figure 5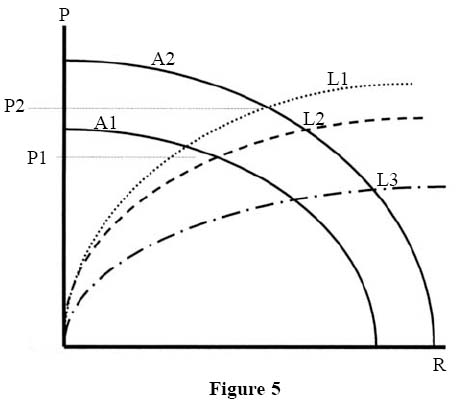
Display large image of Figure 7
41 Under the assumption that L does not change as A is increased from A1 to A2, profit margin increases from P1 to P2, i.e. the intersection between L1 and A1 and A2 respectively. As L decreases from L1 to a lower value L2 as a result of increasing production costs, profit margin P2 may still be greater than P1, and it is not until L has reached the lower value of L3 that P2 is less than P1, i.e. profit margin has decreased. That the value of L is less than A1 L1 / [A2 + L1 (A2 - A1)] is a necessary condition for this to happen
42 To summarise, as long as the ratio (L) between surplus and production cost remains the same, an increase in added value grade always results in higher profit margin. It is not until the value of L is below a certain level (expression given above) that increase in added value will not result in higher profit margin. Both parameters A and L may be useful to monitor early warning signals for a firm.
Concluding Remarks
43 It is often emphasised that the only meaningful concept of competitiveness at the national level is national productivity (Porter, 1990). A rising standard of living depends on the capacity of a nation's firms to achieve high levels of productivity, and to increase productivity over time. As productivity is mostly measured by the amount of added value being produced with the input of resources (e.g., capital, labour), added value has become a frequently used measure at macroeconomic levels. It has also been claimed that the best measure of competitive advantage for SMEs is added value, rather than profit or return on investment or market shares. Improvements in added value provide an indication of more effective internal processes and stronger market performance (Johns and Tilley, 2003).
44 An increase in productivity means that the same or more added value is produced with less or the same input, which on the firm level means production costs. Change in added value is the result of a change in output price or material costs or both. However, with the same production costs, however, profit may rise with increased added value. Likewise, the refinement cost may also increase with increasing added value as a result of extra costs that stem from new product design and new features. In fact, a number of scenarios with changes in profit and refinement costs can be envisaged as added value increases. One of the scenarios is higher added value but lower profit.
45 Encouraging the growth of SMEs is widely seen as an important strategy in the economic development process in most developing countries. A stronger SME sector is expected to contribute to creating new jobs and alleviat poverty as well as enhancing managerial capacities and increasing vertical integration in industry. In addition, SNEs need to contribute to expanding the added value part of the industry. In countries with own natural resources, the refinement of the own natural resources into added value products is an important development strategy. In countries without natural resources, finding niches for high added value export production is an important way of generating export incomes.
46 It is therefore important to encourage the SME sector to strive for higher production added value while at the same time keeping costs under control. Studies have shown that administrative overhead costs tend to increase as the service content represents a bigger portion of the final product offering. Overhead costs therefore represent a potential cost saver in many SMEs.
47 SMEs in developing countries should therefore include a value as in their strategic parameters, and embark on a business strategy of continuous added value grade increase. The model presented in this paper can be implemented as a management monitoring tool that tracks the parameters A and L which together assist managers in this monitoring process.
48 To embark on an added value strategy a firm should consider a number of steps to follow such as identifying the needs of the most important customers through an intensive customer dialogue. From the customer dialogue the firm should furthermore improve own products and service offerings in accordance with what the most important customers needs, and make the necessary investments in equipment, skills and material needed to realise product improvements. The firm should also learn to argue why the improved products and services justify higher market price, and have acceptance from the customer that there are mutual benefits for a business relationship based on a win-win approach. The value that has thus been added should create opportunities for further product innovation and business development.
49 SMEs need to be innovative in products and services and be able to argue why higher quality and enhanced functions justify higher price, under the assumption that these improvements also are what the customers request. This assumes an active dialogue with customers to learn about customer needs and demands.
References
Forbes, N., & Wield, D. (2002). From Leaders to Followers - Managing Technology and Innovation. Routledge, London.
Johnson, Thomas (1992). Relevance Regained - From Top-down Control to Bottom-up Empowerment. The Free Press, New York.
Jones, O., & Tilley, F. (2003). Competitive Advantage in SMEs. Wileys, London.
Menger, Carl (1950). Principles of Economics. The Free Press, Illinois.
Meredith, J., & Shaffer, S. (2002).Operations Management for MBAs. John Wiley & Sons, New York.
Naumann, Earl (1995). Creating Customer Value: The Path to Sustainable Competitive Advantage. Thomson Executive Press.
O'Brien, R., & Williams, M. (2004). Global Political Economy - Evolution and Dynamics. Palgrave Macmillan, Hampshire.
Oxfam (2000). Millennium Summit: Closing the Credibility Gap. Oxfam, London.
Porter, Michael (1985). Competitive Advantage: Creating and Sustaining Superior Performance. The Free Press, New York.
Porter, Michael (1990). The Competitive Advantage of Nations. The Free Press, New York.
Stewart, Francis (1978). Technology and Underdevelopment. Macmillan, London.
Stock, J., & Lambert, D. (2000). Strategic Logistics Management. McGraw-Hill, New York.
The Business Standard. Daily newspaper, Colombo, Sri Lanka.
United Nations Industrial Development Organisation (1999, 2003). The UNIDO Yearbook of Industrial Statistics. The United Nations, New York.