Articles
Japan-Malaysia Free Trade Agreement:
Expectations and Achievements
Khondaker Mizanur RahmanNanzan University, Japan
Rafiqul Islam Molla
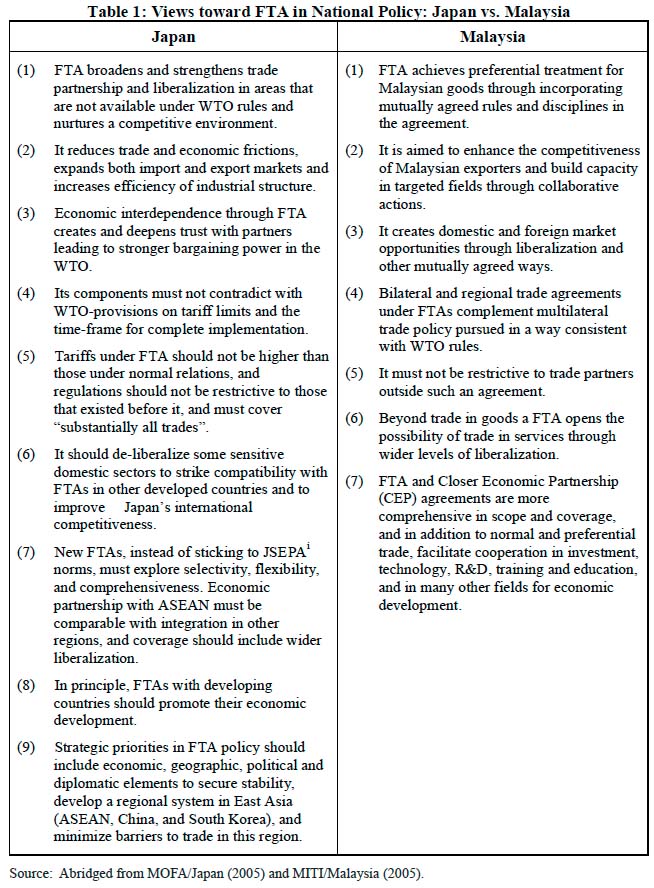
Multimedia University, Malaysia
Md. Wahid Murad
Universiti Malaysia Terengganu, Malaysia
The Japan-Malaysia free trade agreement (FTA) was signed in 2005 and implemented from 2006 with the expectation that it would further enhance the trade and investment relationship between the two countries. Yet, research suggests that the trade agreement and other tools for expanding trade between partner countries are substantially losing effectiveness. In light of this phenomenon, this study examines the role and effectiveness of the Japan-Malaysia FTA in influencing their bilateral trade. From analyses of time series data for Malaysia’s trade with the world and Japan, in terms of trade volume, trade share, and rate of growth, it is observed that during the first two years of this FTA, its influence on bilateral trade between these two countries was not significant. This research indicates that the agreement is still at a fledgling stage, and has limited scope for influencing and revamping mutual trade. The results provide weak support for the thesis that formation of a free trade agreement or bloc is an effective tool for enhancing trade between partner countries. Although a two years of engagement is not long enough to test any rigorous model nor draw valid conclusions, a FTA is indeed an effective tool as long as partners do not enter into such arrangements with many countries, which may dilute the anticipated outcome of an agreement between two countries.
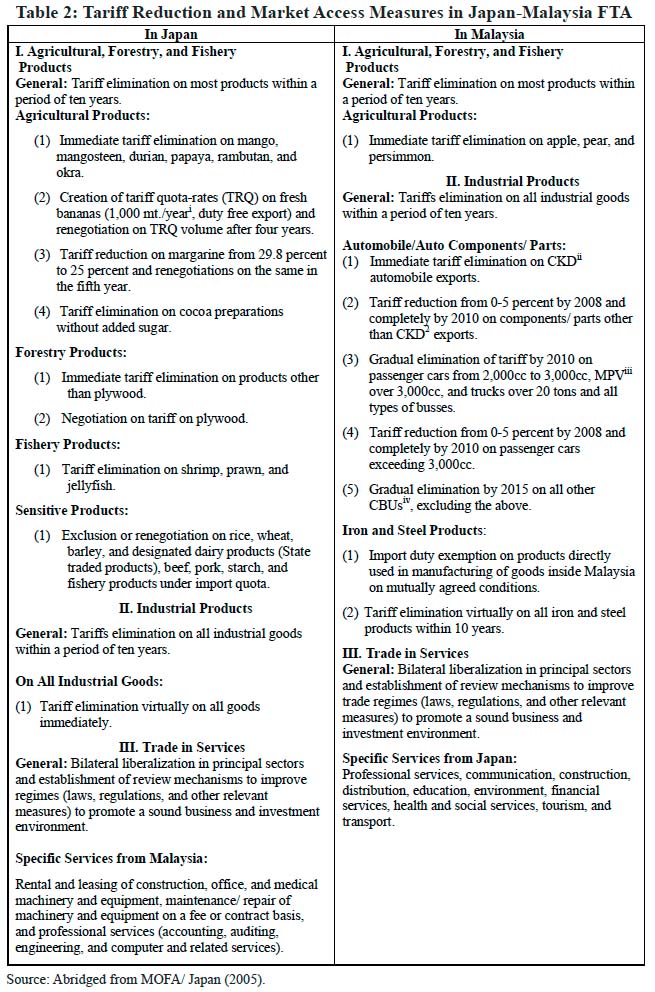
1. Introduction
1 Trade agreements cover a wide spectrum from granting small tariff-rebates to complete withdrawal of tariffs and other restrictions leading to full-scale economic integration. Balassa (1987) enumerates five stages in the process of such integration, namely preferential trade arrangements (PTA), free trade areas (FTA), custom unions (CU), common markets (CM), and economic unions (EU). PTA involves granting tariffs and other concessions without infringing on the World Trade Organization (WTO) provisions. Members of a PTA, if they want to completely eliminate tariffs and other restrictions, inter alia, form a free trade area or agreement (FTA). A FTA indeed connotes a generic business relationship between and/or among trading partners, whereby they can abolish, eliminate, remove, or soften any restrictive regulations (tariffs or non-tariffs) on all trade between and/or among them. Although such a FTA keeps tariffs and barriers to non-members in varying degrees and forms, however, it provides reasonable concessions to countries left outside such arrangements. In its final shape, a FTA thus involves zero tariffs on trade among the parties in the agreement, and positive tariffs on trade with non-members.
2 Initially a FTA or trade bloc was viewed and promoted as an effective strategy for gaining the benefits of globalization even when the member nations were operating basically under the perspectives of economic nationalism and defensive mercantilism. A FTA makes nations open their economies to member nations in a limited and controlled manner for expanding trade among themselves to reap the benefits from such trade. However, research suggests that in the presence of multiple trade agreements between/among member countries with other members and or non- member countries FTAs (and other regional trade agreements and arrangements) as a whole substantially loses effectiveness as a tool for expanding trade between partner countries. By using a factor endowment-based version of the gravity model, Saxonhouse (1993: 412-13) found that East Asian nations, namely China, Indonesia, Taiwan, Japan, Korea, Malaysia, Philippines, and Thailand had little regional bias in their trading patterns from the formation of trading blocs. He further argues that while trading arrangements under blocs are expected to give rise to a form of ‘tactical merit’, this was not supported by evidence from research. The Japan-Malaysia FTA is ab initio subjected to this uncertainty in its impact on trade between the two partners. Due to its short tenure, its outcomes have not yet been elaborately studied. Yet, two obvious questions arise – is this FTA capable of generating its anticipated outcomes? Or, are the perceived benefits mere rhetoric of politicians and policy-makers in both countries? In view of these questions, this study aims to empirically assess the impact of this FTA on trade between the two countries by using trade data.
2. Background of Japan-Malaysia Free Trade Agreement
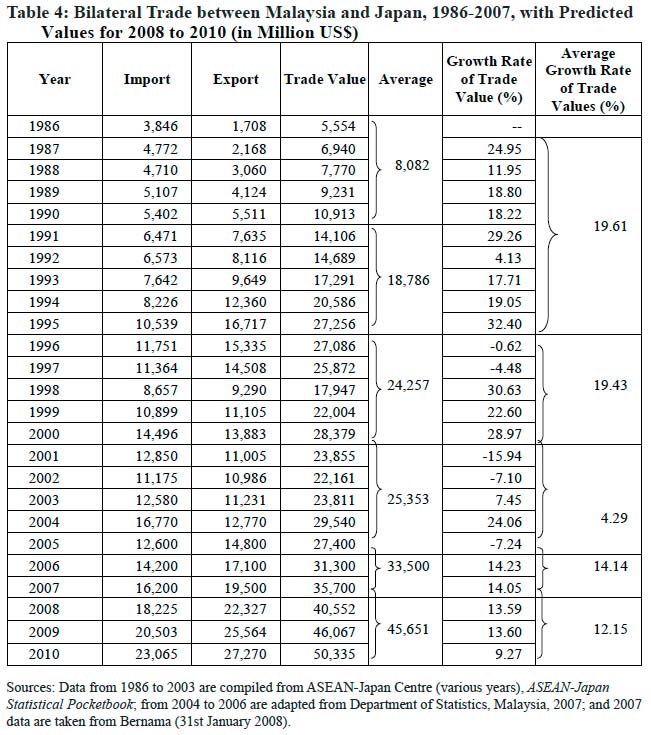
3 The Japan-Malaysia economic engagement is as old as 1967, the year of formation of the Association of Southeast Asian Nations (ASEAN). It gained enormous momentum in 1981 when Malaysia’s Prime Minister Dr. Mahathir Mohammad announced his famous ‘Look-East Policy’ with the aim to modernize and expedite his nation’s development with the support of Japanese investment and technology and by emulating its work spirit (Lim 1994). Similarly attachment of high priority to economic engagement with ASEAN and Malaysia by successive governments of Japan supported the impressive expansion and growth of trade between the two countries during the 1980s through the 1990s. A massive surge of trade and investment from Japan took place in the late 1970s throughout the 1980s and 1990s. As a result trade between the two countries increased from an annual average value of US$8.08 billion during 1986-1990 to US$18.79 billion (an increase of 132.4 percent) during 1991-1995 (Table 4). They signed a bilateral investment agreement in 1996 (Bernama 2008) and that added further momentum to this cozy economic relationship. The average annual trade value further increased to US$24.26 billion in the next five years, a 29.1 percent increase over that of 1991-1995.
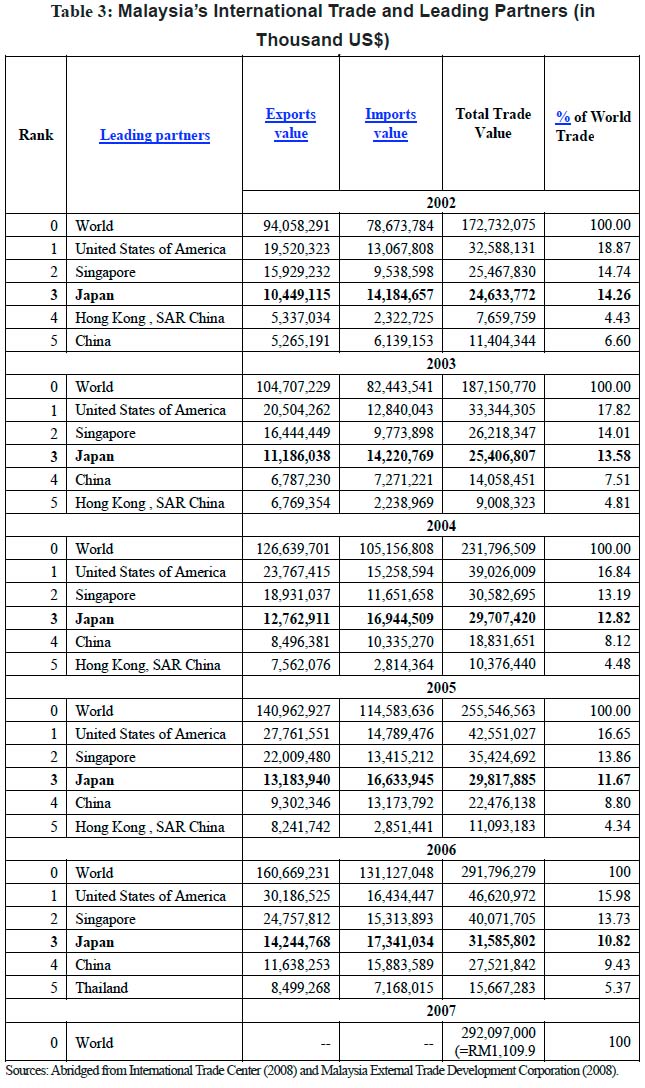
4 During his visit to Malaysia in January 2002, Japanese Prime Minister Junichiro Koizumi gave the proposal of a ‘Japan-ASEAN Comprehensive Economic Partnership’ to his Malaysian counterpart. A joint Working Group, composed of government officials, private sector representatives, experts, and academicians, was formed in 2003 to study issues related to liberalization, facilitation of trade and investment, enhancement of the business environment, and to assess the economic impacts of the proposed agreement on the economies of both nations (MOFA 2005). After eight rounds of deliberations and negotiations, the Japan-Malaysia Economic Partnership Agreement (JMEPA) was formally signed in May 2005. The Agreement has two parts, namely a free trade agreement (FTA) component, which is intended to be fully realized within a period of ten years, and an ‘economic cooperation’ component, to further enhance trade and investment relationships. Although some of the provisions of this Agreement were in the process of implementation since the middle of 2005, the agreement was finally ratified in July 2006.
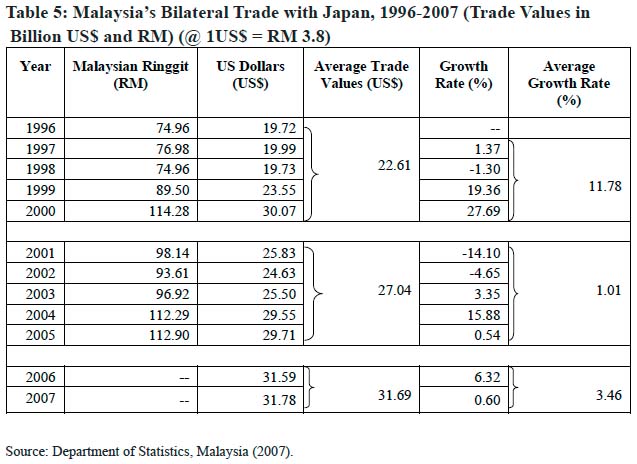
2.1. Roles and Expectations
5 Both Japan and Malaysia pursue FTAs as strategies to create additional benefits amid advancement in the dimension and coverage of economic regionalization and globalization. Both countries, within the framework of their respective national circumstances, have developed general, product-specific, and industry sector– specific strategies to promote FTA. Malaysia, being much weaker than Japan in the international and multilateral forums with the developed countries in particular, seeks to achieve wider objectives than simple market access for its products in particular through favorable tariff and non-tariff facilities under a FTA. Japan, on the contrary, aims to achieve regional and global stability of its trade and economic activities, and also to contribute to the economic development of its FTA partners. These kinds of diverging goals and objectives, in fact, create diverse opportunities for member countries to achieve mutual business and economic goals. Japan being a developed economy has a broader view of FTAs; and Malaysia, as a developing economy has a relatively narrow perspective on FTAs. The role and expectations of FTAs are, thus, viewed somewhat differently by the two nations. These views are articulated in Table 1.
2.2. Contents and Coverage
6 Japan-Malaysia Economic Partnership Agreement (JMEPA) envisaged realizing fully the goals of its (FTA) component within ten years, the time frame that the WTO provisions stipulate. This ten-year period is indeed a moratorium for domestic industries in both countries to help them adjust to circumstances that would emerge from the withdrawal of restrictions.
Table 1: Views toward FTA in National Policy: Japan vs. Malaysia
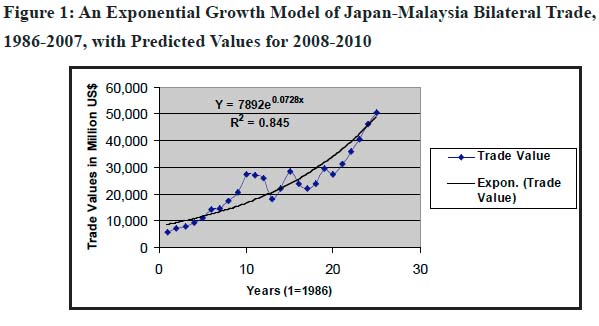
Display large image of Table 1
7 The FTA or simply the trade component covers trade in agricultural and industrial goods, trade in services, investments in all categories, rules of origin (ROO), movement of people, custom procedures, safeguards, standards and conformance, intellectual property rights, competition policy, promotion of business environment, and measures to safeguard mutual interests and settlement of disputes (MITI/Malaysia 2005). On trading of goods, the agreement provides for elimination of duties on selected items, progressive reduction/ elimination of duties over a period of ten years, flexible treatment for sensitive sectors, and collaboration in the automotive sector. On investment, it includes liberalization of regimes to promote, facilitate, and protect investment. On trade in services, it introduces forms for liberalization, an initial package of commitments, and mechanisms for transparency and subsequent negotiations to achieve the ultimate goal of progressive liberalization.
8 The other component concerns developmental cooperation, also called the economic cooperation components. It includes bilateral cooperation in the fields of primary sector commodities (agriculture, forestry, and fishery), education, human resources development, information and communication technology (ICT), promotion of small and medium enterprises (SMEs), science and technology, environment, and tourism. As envisioned, the cooperation in these fields would enhance trade and investment relations, and increase opportunities to formulate new projects for mutual benefits, especially in the fields of high-tech industry, bio-technology, ICT and multimedia, and services industry that support the manufacturing industry (MITI/Malaysia 2005).
9 These two components, when fully realized, are expected to generate a multiplier effect on the FTA’s impacts towards realization and sharing of gains from trade by both of the countries. The major elements of the FTA are summarized in Table 2. More precisely those are: (a) On agricultural, forestry, and fishery products - elimination of tariffs in general within ten years and promotion of market access measures in Japan for primary products which are produced in plenty in Malaysia due to its natural endowments; (b) on industrial goods - both countries comprehensively eliminate or reduce tariffs, and will cooperate to enhance competitiveness and market expansion in the Malaysian auto industry (vehicles, auto components, and parts) in particular; (c) on tariff procedures - both countries will promote information exchange and cooperation to simplify and harmonize regimes and procedures, and to enforce those effectively to facilitate trade; (d) on trade in services – an initial offer of bilateral liberalization in principal sectors and establishment of review mechanisms to improve regimes (laws, regulations, and other relevant measures) to promote the business and investment environment in the sector; (e) on investment - promotion of a sound framework of investment between the two countries through adoption of regimes and measures to liberalize fields, accord most favored nation (MFN) and other preferential treatments, and protection of investment and investors; (f) regarding intellectual property - institution and enforcement of adequate and effective measures to safeguard intellectual property rights to further promote trade and investment; (g) for maintaining competition - adoption of appropriate measures to smooth competition and control anticompetitive activities; (h) for avoiding and resolving disputes - establishment of standards and conformance and a framework to negotiate mutual recognition arrangements; and (i) for smooth operation and implementation - establishment of a suitable mechanism with suitable representatives from governments of both sides, respective private sectors, and other relevant organizations (MOFA/ Japan 2005; MITI/Malaysia 2005) to oversee implementation, suggest improvement, and formulation of policy-recommendations. The core of this JMFTA is that Japan will promote measures to help access of Malaysian products into its market, and Malaysia will do the same for Japanese products.
Table 2: Tariff Reduction and Market Access Measures in Japan-Malaysia FTA
Source: Abridged from MOFA/ Japan (2005)2.3. Expected Impacts on Trade in Some Specific Products
10 During negotiation of this agreement, both countries were intensely eager to optimize conditions for their respective competitive sectors/products, and to preserve the viability of competitively disadvantaged sectors/products within the FTA environment. While Japan negotiated to abolish Malaysia’s high tariffs on automotive (Ling 2005) and steel and iron products and to liberalize investment and services sectors, Malaysia wanted to relax tariffs on its plywood exports (10 percent) to Japan and to increase cooperative areas.
11 Malaysia manufactures automobiles in the domestic sector. Its national automobile maker Proton produces passenger cars and other vehicles, and the domestic market was kept highly protected through incentives to customers and by imposing high import and excise duties on foreign-made as well as domestically assembled cars by foreign makers (Business Week 2005). Domestic assemblers, however, considered such protections/ restrictions detrimental to their business. An immediate outcome of this FTA is that Malaysia has abolished tariffs on CKD vehicles assembled in the local market by Japanese auto makers. Tariffs are also exempted on completely-built-up (CBUs) vehicles from Japan that do not compete with Malaysian models (ICTSD 2005). Tariffs on components exported from Japan will be reduced between zero to 5 percent in 2008 and be eliminated completely by 2010 (Ling 2005). Vehicles with engine capacity of 2,000cc to 3,000cc, multi-purpose vehicles (MPVs), and trucks with carrying capacity of 20 tons and more will be gradually made tariff free by 2010. Tariffs on those with engines more than 3,000cc will be reduced between zero to 5 percent by 2008, and abolished completely by 2010. The FTA now has made the competition environment more accommodative and transparent. This will thus necessitate an immediate policy framework for the automobile industry in Malaysia to keep it competitive as well as lucrative over time.
12 Local assemblers who procure parts and components from Japanese makers will likewise benefit from this FTA-led tariff reform. They will face new challenges from Japanese auto-makers’ technologically advanced designs, quality, brand image, price and fuel efficiency, and will need serious adjustments and improvements to sustain their existence in the new market format. On the part of consumers, the FTA will enlarge their car shopping opportunities with much freedom to choose brand and model from a wide range of merchandise offered by various makers that match their purse and dignity.
3. Analysis of the Effect on Bilateral Trade
13 Keeping the research questions in mind, the impacts of this FTA on bilateral trade between Malaysia and Japan are analyzed in terms of trade growth, trade share, and trade growth, and a prediction of growth and growth rate using various data sets are provided. The results are shown below.
3.1. Trade Growth
14 Malaysia’s total trade with the world increased significantly during the four years of 2001-2005. It increased from US$172.7 billion in 2002 to US$255.55 billion in 2005; for the same period aggregate trade with Japan increased; but in percentage terms it virtually declined. The average annual value of trade stood at US$27.39 billion (Table 3). Analyses in Table 4 reveal that during 2001-2005 its trade with Japan similarly remained stagnant with average annual value of US$25.53 billion which is only 4.5 percent higher than that for 1996-2000. During this period, Japan lost a significant proportion of its share of trade with Malaysia to newcomer China (Table 3).
15 However, after introduction of the FTA in 2006 bilateral trade between Japan and Malaysia increased. Average annual trade value for 2006 and 2007 was US$33.50 billion which was 32 percent higher than that of 2001-2005 (Table 4). This indicates that the FTA had a positive influence on trade growth between the two countries. The data set in Table 5, however, gives a slightly different picture. Average annual trade value during 2001-2005 was US$27.04 billion which was 19.6 percent higher than that of the period 1996-2000. Average annual trade value during 2006 and 2007 was US$31.69 which was 17.2 percent higher than that of the period 2001-2005. This suggests that trade grew as usual following the dynamics of growth. The FTA talks and its final adoption had some significant impact on trade between the two countries, in that it reduced the massive decline that could have come from the China factor in world trade.
3.2. Trade Share
16 Analysis of Japan’s share of Malaysia’s trade shows that regardless of variations in trade volumes Japan consistently remained the 3rd largest trading partner of Malaysia during 2002 to 2007. Its total trade value expanded from US$24.63 billion in 2002 to US$31.78 billion in 2007 but still held the same 3rd position among Malaysia’s trading partners (Table 3). One argument might be that trade between the two countries has expanded simply following the expansion of Malaysia’s total world trade. Had there not been a FTA, the Japan-Malaysia trade value and rank as trading partners would deteriorate. However, it can be inferred that the FTA had offset changes caused by China, and that is reflected in the increase in gross trade value with the world as well as with Japan. Also, for 25 traditional and non-traditional products, Malaysia ranked as the number one exporter to Japan in 2006 (ASEAN-Japan Centre 2007). Especially, export of fruits, wood, furniture, and other primary products to Japan will further increase due to the implementation of the FTA rules. Export and import of machinery and other finished products between these countries may further influence the trade picture in the future.
Table 3: Malaysia’s International Trade and Leading Partners (in Thousand US$)
Display large image of Table 3
Table 4: Bilateral Trade between Malaysia and Japan, 1986-2007, with Predicted Values for 2008 to 2010 (in Million US$)
Sources: Data from 1986 to 2003 are compiled from ASEAN-Japan Centre (various years), ASEAN-Japan Statistical Pocketbook; from 2004 to 2006 are adapted from Department of Statistics, Malaysia, 2007; and 2007 data are taken from Bernama (31st January 2008)3.3. Trade Growth Rate
17 Growth rates of trade values are calculated in Table 4, by using the formula: {(Trade Value t2 - Trade Value t1) / Trade Value t1} x 100.
Table 5: Malaysia’s Bilateral Trade with Japan, 1996-2007 (Trade Values in Billion US$ and RM) (@ 1US$ = RM 3.8)
Display large image of Table 5
18 A period by period analysis of the growth rate of trade between Malaysia and Japan reveals an interesting phenomenon to suggest that its youthful nature and vigor with a 19.61 percent growth rate during the early phase of their economic engagement continued till 1995. Its momentum with a 19.43 percent growth rate made it reach the level of maturity by 2000. It stabilized during the period 2001-2005 with a minimal growth rate of 4.29 percent. An attempt to revamp and give it a second life through this FTA apparently was able to achieve success in the sense that during 2006 and 2007 it started regaining momentum with annual average growth rate of 14.14 percent. The scenario looks as shown below:
- During the period 1987 -1995 = 19.61%
- During the period 1996 - 2000 = 19.43%
- During the period 2001 - 2005 = 4.29%
- During the period 2006 - 2007 = 14.14%
19 With the entry of China into the list of trading partners of Malaysia, the impacts of this FTA are likely to be eroded significantly in coming years. Already China has taken away from Japan (and also from the USA) a big share of trade with Malaysia, and this situation may continue further, which means, the influence of the FTA on bilateral trade between Japan and Malaysia is likely to be short lived.
3.3.1. An Exponential Growth Model for Prediction of Trade Growth and Growth Rate
20 Based on observation of Malaysia’s trade data from 1986 to 2007 we consider that an exponential growth model of the form Y = ex, which is well known for its use in growth studies, will properly fit the nature of the data and will be more appropriate for prediction purposes. In the model Y is total trade value, and X is time (years). The estimated empirical model that we get is Y = 7892e0.0728x with following statistical features: R2 = 0.845; average trade value = 20,427 million; standard deviation = 8,629 million. A trend curve derived from this model is usually steep and shows increasing slope, since the functional relationship between the independent and the dependent variables goes in the same direction and increases by the same parentages.
21 With a high R2 value of 0.845 this exponential growth function is, therefore, a very good fit for the data analyzed, and it suggests that this is an appropriate model for properly predicting the growth pattern of Japan-Malaysia bilateral trade. Figure 1 depicts a graph of the data and the predicted values. The look of the graph also supports the claimed suitability of the model for this purpose. The slope of the curve is rather steep, which is not usual for this type of model. However, a high standard deviation of 8,629 signifies the fact that the growth pattern of bilateral trade is characterized by the existence of a high rate of fluctuations in annual trade volumes.
22 Using this model the predicted trade values for 2008, 2009, and 2010 are found as US$40.55, US$46.07 and US$50.34 billions respectively (Table 4). It is, also, observed that the predicted trade growth rate starts falling from 2010. This suggests that unless a qualitative change takes place in the composition of trade within the framework of planned economic expansion (e.g. in ‘Vision 2020’ of Malaysia), it is less likely that the FTA will be able to maintain the recent momentum of bilateral trade growth beyond 2010. Indications of this can be seen from the predicted trade values and the falling of the growth rate for 2010 in Table 4.
Figure 1: An Exponential Growth Model of Japan-Malaysia Bilateral Trade, 1986-2007, with Predicted Values for 2008-20104. Conclusion
23 Analyses of Malaysia’s trade with the world and its bilateral trade with Japan, for the last 21 years, in terms of growth, trade share, and projections of growth reveal that the FTA with Japan does not have a major influence on the bilateral trade between the two nations. Trade performance during the first two years of the FTA shows its limited scope for influencing and revamping their bilateral trade. This finding, in fact, has conformity with the thesis that formation of trade blocs may not be always an effective mechanism for influencing trade growth between partners. The analyses and results, however, suffer from the limitation that only two years into the life of a FTA is not long enough for an assessment of its long-term impacts. Furthermore, an itemized examination of trade between the two countries over a longer period may show a more complete picture of its results.
References
ASEAN Japan Centre (various years). ASEAN-Japan Statistical Pocketbook, Tokyo, Japan.
______ 2007. ASEAN-Japan Statistical Pocketbook 2007, Tokyo, Japan.
Balassa, Bela. 1987. Economic Integration: The New Palgrave Dictionary of Economics, Macmillan Press, London.
Bernama. 2008. Malaysia-Japan trade up 14.2 pct in 2007. Bernama – Malaysian National News Agency (Online), 31 January at www.bernama.com.
Business Week. 2005. Proton hits heavy traffic. McGraw-Hill, New York, July 25/August 1, pp. 16-17.
Department of Statistics, Malaysia. 2007. Malaysia Economic Statistics, >Department of Statistics Malaysia, Putrajaya.
ICTSD. 2005. http://www.icstd.org/weeekly/05-05-25/inbrief.htm (retrieved on July 7).
International Trade Center. 2008. International Trade Statistics by Country and Product Group at www.intracen.org/menus/search.htm (retrieved on May 16).
Lim, Hua Sing. 1994. Japan’s Role in ASEAN – Issues and Prospects, Times Academic Press, Singapore.
Ling, Yeow Pooi. 2005. Free trade agreement lifts tariffs on Japanese cars, The Star (online), http://biz.star.com.my/news/story2005/5/26 (retrieved on July 7).
Malaysia External Trade Development Corporation (MATRADE). 2008. Trade Statistics, www.matrade.gov.my/foreignbuyer/Msiatradestats.htm (retrieved on March 29).
Ministry of Foreign Affairs (MOFA), Japan. 2003. Japan-Malaysia Economic Partnership – Joint Study Group Report, MOFA, December, at www.mofa.go.jp (retrieved on July 7).
Ministry of Foreign Affairs (MOFA), Japan. 2005. Japan-Malaysia Economic Partnership Agreement ─ Joint Press Statement at www.mofa.go.jp/region/asia-paci/Malaysia/joint0505-2.html (retrieved on September 25).
Ministry of International Trade and Industry (MITI), Malaysia. 2005. Malaysia and Free Trade Agreements ─ Japan-Malaysia Economic Partnership Agreement at http://www.miti.gov.my/fta-japan.html (retrieved on July 7).
Saxonhouse, Gray R. 1993. Trading blocs and East Asia, in De Melo, Jaime, and Panagariya, Arvind (ed.), New Dimensions in Regional Integration, CEPR/ Cambridge University Press, Cambridge/NY, pp. 388-416.
End notes
