Vol. 16 No. 2 January 2005
Improving the Logistics of Biofuel Reception at the Power Plant of Kuopio City
Kari Väätäinen
Finnish Forest Research Institute
Joensuu, Finland
Antti Asikainen
Finnish Forest Research Institute
Joensuu, Finland
Jukka Eronen
Forest and Environment Group Ltd.
Joensuu, Finland
ABSTRACT
In Finland, many bio power and heating plants have been recently built and existing power plants have been improved to allow increased energy production. To meet the increasing demand of solid fuel at bio power plants, a large transportation fleet is needed and both the logistics of solid fuel transportation and power plant fuel reception must be improved. This study investigated fuel truck arrival and unloading processes at a power plant which produces heat for the city of Kuopio and electricity for the national grid. The aim of this study was to minimize fuel truck queuing times, and balance the use of two delivery bays by improving the logistics of fuel handling at the receiving station and by distributing truck arrivals at the power plant more uniformly throughout the day. Discrete-event simulation was implemented as a method for analyzing the system. To balance the utilization of both delivery bays at the power plant and shorten the queuing times, the most feasible solution was for more effective control of truck interaction with the delivery bays: having the shortest queue and faster fuel flow from delivery bay to combustion by arranging fuel transport with a new conveyor to the boiler. Adaptable scheduling of truck arrivals was found to be feasible during the morning to smooth out the peaks of the truck arrivals in cold periods when fuel consumption at the power plant is at its highest.
Keywords: bio power plant, peat, biomass, forest chips, fuel transportation, logistics, queuing, discrete-event simulation, arrival process, Finland.
INTRODUCTION
In Finland, large District Heating (DH) plants supply heat to the DH-network, and also produce electricity for the national grid. Their primary fuels are peat and wood chips. The use of solid bio fuels is increasing mainly because of a combination of cost reasons, nationally secured energy supply and environmental policy. New bio power- and heating plants have recently been built and existing power plants have been improved, thereby allowing increased energy production [7, 17]. For example, the combustion of forest chips in the energy companies' power and heating plants has increased from 303,000 m³ to 960,000 m³ from 1995 to 2001 [1, 6]. These changes directly affect the logistics of solid fuel transportation and power plants' fuel reception. To meet the increasing demand for solid fuel at bio power plants, a large transportation fleet is needed. Typically, a DH plant receives 10,000 - 15,000 truckloads annually, which calls for effective unloading practices.
The logistics and management of biofuels differs from timber transport. Round wood transport to the sawmills and pulp mills is strictly controlled in Finland. Transport control is generally based on geographic information system (GIS) with GPS-assisted niche navigation and/or tools to assist in finding the shortest routing. Information systems produce a weekly schedule for each truck showing when to arrive at a mill with a certain load. The driver makes the final route selection with support from the system, which calculates and presents an optimal driving route [11, 14]. By accurately controlling the timber flows, considerable savings in both logistic and capital costs have been achieved. The information systems have been in operation for several years in the large wood procuring companies.
In peat fuel transportation the trucks are always filled to capacity, though they may be required to get their load from a few locations, while timber trucks can sometimes fill their loads at several landings. With forest chips, the situation resembles the normal timber transportation; loads are often accumulated at several landings. In principle, the logistics and control of fuel deliveries should be as easily arranged as for pulpwood and timber, but in one respect, the transport logistics of forest fuels are more complex: while timber trucks are only used for wood and managed by one transport manager, fuel trucks can transport several goods under the management of several transport managers and organizations.
The intermittent arrival of the fuel trucks occasionally overloads the receiving station of the power plant [13]. Especially during the winter, when energy consumption is at its highest, the operating capacity of the fuel handling apparatus in the receiving stations can be too limited, resulting in extended waiting times for the trucks. Instead of improving the fuel handling and fuel flow at the receiving station, the other possibility to minimize waiting times at the station would be through scheduling the arrival of each truck. Increased use of back hauls of other goods in connection with bio energy transports impedes the scheduling of fuel arrivals. At some power plants, however, forest chips transports are scheduled in order to provide improved fuel mixture [7].
Queuing problems in real life situations can be analyzed and investigated by queuing theory or by simulation. In both techniques the queuing system consists of customers, service providers and their interactions. Customers arrive at a service process according to random distribution, such as Poisson; the service time is also described as random distribution, e.g. exponential [2]. Although queuing theory has originally evolved out of successful applications in teletraffic systems, extension of queuing results to other areas has been less successful [15]. Mainly the difficulty of modeling queuing situations mathematically with rough assumptions calls for the use of simulation as an alternative tool [15, 16]. However, queuing theory has proven to be very valuable for verification and validation of simulation models [8].
In the field of forestry, queuing theory has been implemented for studying the effects of scheduled timber trucking on the terminal costs of a pulp mill [10]. Stals-3, a timber-harvesting program, uses both queuing theory and simulation techniques to analyze skidding, loading and trucking interactions at a "hot landing" [9]. However, discrete event simulation has been successfully applied to many forest operation systems, where machine interactions and their waiting times were studied, therefore studies can be applied to systems where queuing occurs [2, 3, 4, 5, 18].
The power plant that was studied produces heat for the city of Kuopio and electricity for the national electricity grid. Numerous development needs in the logistics of fuel transportation and fuel unloading functions have been identified. Trucks sometimes have to wait for hours before they are able to unload to one of the power plant's two delivery bays. The queuing and waiting problems occur principally in wintertime, when there is a high degree of power plant capacity utilization. In addition, fuel truck arrivals peak during the morning, resulting in an increase in truck waiting times at the receiving station.
The utilization of fuel Delivery Bay 1 (DB1) has been much lower than that of Delivery Bay 2 (DB2). This is mainly because the smaller of the power plant's two combustion units exclusively uses fuel which is unloaded at and conveyed from DB1. Combustion Unit 1 has only a third of the rated heat output of Combustion Unit 2. Additionally, DB1 can receive both rear unloading trucks and side tipper trucks, whereas only rear unloading trucks can unload at DB2. These restrictions of the power plant's fuel handling facility are the main structural reasons for the queuing.
In the future, the usage of the forest chips is likely to increase at the Kuopio plant. This will require changes of operations and equipment. One solution to this situation would be the construction of a new delivery bay, including the most advanced technology, thereby reducing the queuing problem considerably. On the other hand this would create significant overcapacity, which is not desired. Therefore, as a first step, it is economically rational to investigate solutions based on the existing setup to resolve the queuing problem.
The objectives of the study were formulated with the assistance of the managers of the receiving station of the plant. The aim of this study was to try to minimize the queuing times of the fuel trucks and balance the use of delivery bays by improving the logistics of fuel handling at the receiving station and by changing truck arrival procedures at the power plant. The effects of these alternatives were analyzed using the discrete-event simulation method. The following options were studied:
SIMULATION
Material for Simulation
Initial data for the simulation models was derived from the plant's fuel receiving station database, which was collected during the year 2000 by an automatic data collection system. The system is used for the follow-up and management of the power plant's fuel reception. The data included truck arrival times to the weighing station, starting and ending times of unloading and departure times from weighing station. The data also included information regarding unloading technique, fuel suppliers, supplied fuel, the fuel's caloric value, volume and mass of the load. During the year 2000, the number of truck arrivals was 13 479 and the total delivered fuel mass was approximately 500, 000 tonnes. The biggest supplier provides 80% of the fuel. Smaller local supply companies delivered the rest of the fuel supply.
Some of the trucks unloaded from the rear using special bull chain conveyors. The remainder of the trucks had side tipper containers. In this study the rear unloading trucks will be referred to as RU and side tipper trucks to as ST. The total annual number of RU truck arrivals was 10 832 and ST trucks 2 647. There were 30 trucks delivering the fuel. The simulation study focused on the winter period, which is the period when energy production is highest and the bottlenecks of the operation at the receiving station were easier to detect. Main data figures for the winter season are presented in Table 1 (January-April and October-December).
Table 1. Key figures of the winter season fuel deliveries in 2000 (January-April and October-December).
| DB1 1, RU 2 | DB1, ST 3 | DB24, RU | |
|---|---|---|---|
| Total Number of Arrivals | 369 | 2 031 | 7 655 |
| Total Mass of Delivered Fuel, tonnes | 13 623 | 75 322 | 284 959 |
| Degree of Capacity Utilization, % | 10.8 | 10.8 | 65.5 |
| Unloading Time, minutes ( | 22.2, 22.0, 8.6 | 12.7, 9.0, 23.8 | 27.7, 24.0, 33.7 |
| Queuing Time, minutes ( | 21.0, 12.0, 23.8 | 15.2, 6.0, 25.1 | 28.3, 21.0, 29.8 |
1 DB1 = delivery bay 1, 2 RU = rear unloading truck
3 ST = side tipper unloading truck,
4 DB2 = delivery bay 2
General Construction of the Base Model
The base model was made to describe the initial situation of the truck arrivals and functions of fuel receiving station at the Kuopio power plant during the winter of 2000. The simulation results of improved logistic solutions were compared to the base model's simulation.
The simulation model was constructed using WITNESS - software, which is designed mainly for the modeling of industrial production systems [19]. Basic elements for the model were 30 fuel trucks, one fuel-loading bay, roads from/to loading place to/from fuel receiving station, weighing station, roads from/to weighing station to/from DP1 and DP2, and two delivery (unloading) bays (DP1 and DP2) and their fuel hoppers (Figure 1). The main issue was the queuing time, which was automatically registered by the model. Additionally the model calculated the degrees of utilization of the delivery bays, which meant in this case the ratio between total unloading time for trucks and total in-shift time for a certain delivery bay.
In the model, an algorithm which defined departure times for each truck controlled movement of the trucks and its characteristics (fuel and unloading type and fuel supplier).
The timing of truck departures from the fuel stores was done so that trucks arrived at the mill in a manner resembling the current situation. When simulating the other study alternatives, changes to the base model were made in the truck controlling unit, in guiding rules of trucks after weighing and in the speed of fuel flow from delivery bay 1's hopper to combustion.
Description and Functioning of the Base Model
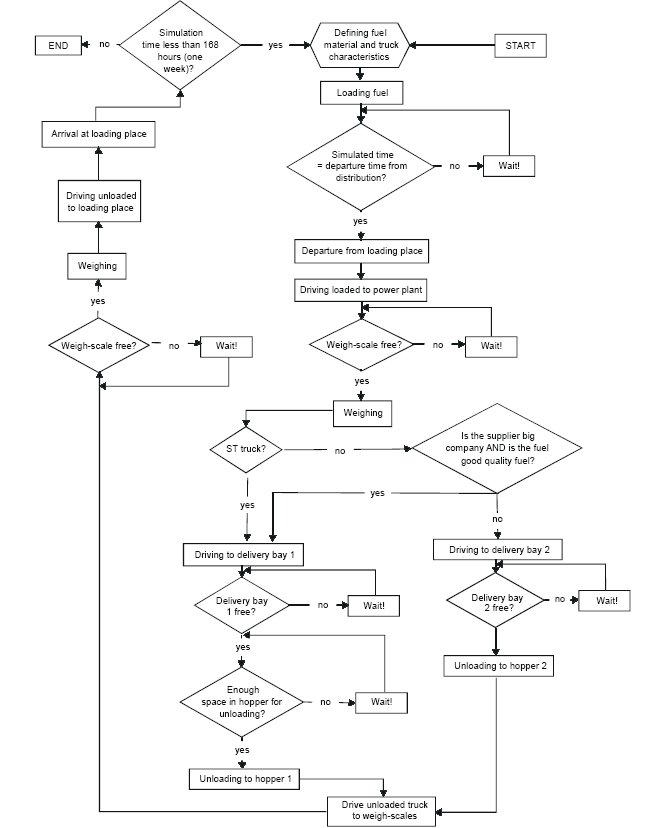
The length of a simulation run was set to one week. The parameters of the simulated week correspond to an average week, which was built up from the winter season data (October - April). For every departing truck the model defined the truck type as RU or ST, fuel supplier, fuel type and quality. Each truck's characteristics were defined randomly using the WITNESS -software random number generator and the truck proportion data presented in Table 2. The flow chart of the truck work cycle is presented in Figure 2.
After definition of the truck attributes, the truck was loaded with 110 m³-loose of fuel, which corresponds to the average load volume for the current situation. For every hour of the simulation, the number of departing trucks was estimated by a theoretical Poisson distribution (equation 1), which is typically used to estimate the number of events (arrivals) occurring within a fixed time interval [16, 19]. The Poisson distribution was tested using a few samples taken from the database using the "chi-square test of goodness of fit" [15].
Truck arrivals during the summer differ greatly from truck arrivals during the winter. Finally, the exact departure time of each truck within an hour varied randomly.
![]() k = 0, 1, 2, ... (1)
k = 0, 1, 2, ... (1)
The Poisson distribution's expectation values, l (trucks per hour) were taken from the analyzed database in the base model. Based on production statistics, three different truck arrival sets (wintertime, coldest month and coldest week) were used in the simulation experiments (Figure 3).
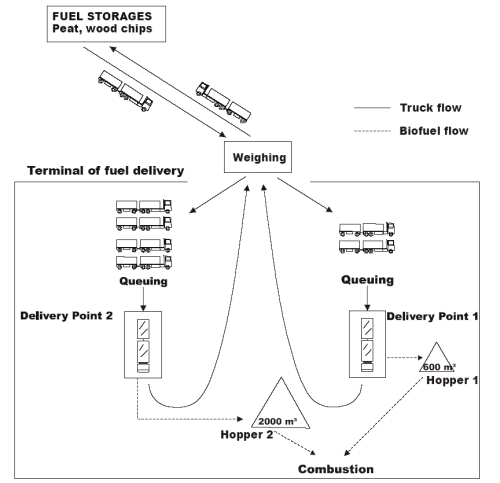
Figure 1. Supply of fuel and terminal functions at Juopio plant.
Table 2. Truck characteristics and truck delivery bay assignment and their proportion of the total number of truck arrivals.
| Truck characteristics | Delivery bay | Proportion of truck arriving |
|---|---|---|
| Large supplier, side tipper | DB1 | 21 % |
| Large supplier, rear unloader, high quality fuel | DB1 | 8 % |
| Large supplier, rear unloader | DB2 | 51 % |
| Small suppliers, rear unloader | DB2 | 20 % |
| Total | 100 % |
The distance between the loading bay and the power plant was 60 km and the driving speed of trucks 60 km/h. The truck is first weighed as it arrives at the fuel reception. In the base data weighing times had only a small variation. Thus a constant value of 30 seconds per truck was used in the model. The delivery bay was determined after weighing, depending on the truck's unloading function, supplied fuel material and its quality and the fuel supplier.
The length of the road from the weigh station to the DB1 was 400 m and to DB2,200 m. The driving speed of the trucks to the delivery bays was 12 km/h and while for returning trucks it was 20 km/h. The registered queuing time for each queued truck started at the end of the arrival road and ended when unloading started. Only one truck could unload at a time in each delivery bay.

Display large image of Figure 2
Figure 2. Flow chart of fuel trucks work cycle and model's functions in the base simulation model.
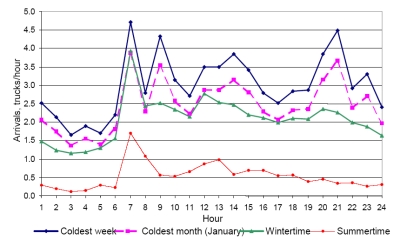
Figure 3. Truck arrivals within a 24-hour period (average values) in different time periods based on the production statistics for the Kuopio power plant.
At DB1, unloading was straight into the hopper,
whose capacity was 600 m³. In the simulation, unloading started
when 110 m3 of empty volume was available in DB1's
hopper. In the base model the rate of fuel flow from hopper 1
to combustion storage was 110 m³/h, which was also
the average fuel consumption for combustion unit 1
during the winter period. The maximum fuel consumption for
combustion unit 1 was 146 m³/h. A lognormal distribution
was used to describe the unloading times in DB1: RU
trucks, lognormal (![]() : 21.0 min., SD: 3.0 min.) and ST
trucks, lognormal (
: 21.0 min., SD: 3.0 min.) and ST
trucks, lognormal (![]() : 9.5 min., SD: 3.0 min.). The distributions
for both truck types were derived from the data, which
included the unloading times with other operational
breaks, except breaks caused by the hopper reaching capacity.
: 9.5 min., SD: 3.0 min.). The distributions
for both truck types were derived from the data, which
included the unloading times with other operational
breaks, except breaks caused by the hopper reaching capacity.
At DB2, trucks unloaded directly onto the conveyor, which transported the fuel to a hopper with a capacity of 2 000 m³. Because of the constant speed of the conveyor, large hopper capacity and high combustion rate of combustion unit 2, the hopper was never full. Thus, in DB2, an empirical distribution (: 26.2 min, SD: 8.6, minimum value: 15.0 min) was used for estimating the truck unloading times, which included all the delays caused by fuel quality, truck unloading method and fuel conveyor technical problems.
After unloading, the fuel truck returns to the weigh scale to measure the tare weight. In the simulation model, the working cycle of a truck ends when the truck returns back to the loading site to wait for the truck requirements for the next work cycle.
Simulation Experiments
In the simulation four feasible scenarios were set up. These scenarios were divided into two sub-scenarios and further into different experiments (Figure 4). Each experiment was repeated 10 times, in order to reach the desired confidence interval of decision variables.
In every replication, initial values of the model parameters were kept constant, but random number streams varied between the replications. In the simulation the same set of seed numbers were used to generate random number streams for each replication sequence. By that means, the differences in the experiment's simulation outputs were basically due to differences in the alternative designs in the experiments, not as a result of experimental errors [15]. Except in scenario B, experiments in each situation had a similar fuel truck arrival process by using the same random number streams.
In scenario A, the queuing was minimized through intensified usage of DB1 so that some of the principal fuel supplier's RU trucks were guided there. Controlling the principal fuel supplier's RU trucks was based on the minimization of queuing so that RU trucks were guided to the delivery bay with the shortest queue. In addition to truck controlling, the fuel flow speed of hopper 1 was increased to enable the balancing of capacity utilization between the delivery bays. The increase of the hopper's fuel flow speed from 146 m³/h to 200 m³/h or even faster requires modest rearrangements to DB 1's conveyors. Base sub-scenario A1 refers to the current situation at the plant.
In scenario B, truck arrivals at the plant were time-scheduled in order to lighten the morning rush hour on site and thereby minimize the queuing of trucks. In sub-scenario B1, the time-schedule was set at a constant with two trucks arriving each hour (Figure 5). In sub-scenario B2, the number of trucks arriving at night was lower than during the day (Figure 5). The base sub-scenario modified with the time-schedules and different hourly arrival distributions was simulated first. A constant number of arrivals/hour meant that a given number of trucks could arrive at any time during an hour. Arrivals uniformly pitched and constant number of arrivals/hour meant that the trucks had to arrive uniformly, for example, at 20-minute intervals and their count during one hour was given. In sub-scenario B2, the model was run by guiding the RU trucks of the main company to the shortest queue. In all experiments in scenario B, the fuel flow speed from hopper 1 to combustion was 110 m3/h.
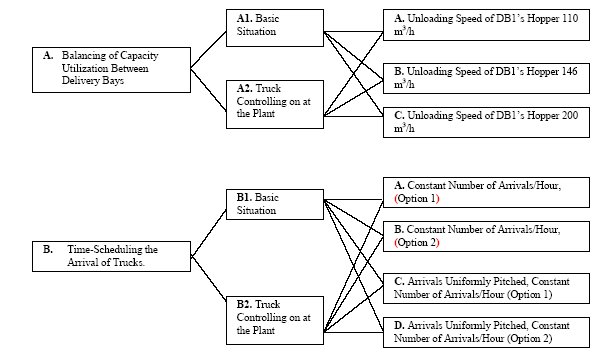
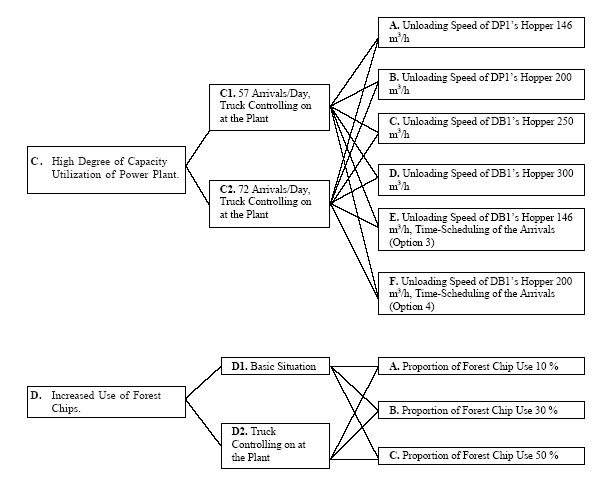
Figure 4. The studied scenarios and experiments (DB1=Delivery Bay 1).
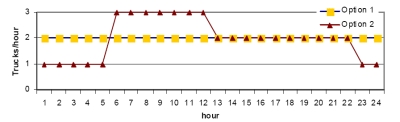
Figure 5. Time-schedule of the truck arrivals used in scenario B.
The effects of a cold winter spell were examined in scenario C when the plant's degree of capacity utilization and fuel consumption are at their peak. In sub-scenario C1 the number of the truck arrivals was 57 per day and in sub-scenario C2 72 trucks per day. Fifty-seven arrivals per day was the average value that was derived from the coldest month data and 72 trucks per day was derived from the coldest week data. In both scenarios the RU trucks of the big company were directed to the shortest queue. In the first four experiments the fuel flow speed at DB1's hopper was raised gradually from 146 m3/hour to 300 m3/hour. Options 3 and 4, with fuel flow speed of 146 and 200 m3/hour, respectively, were used in the last two experiments (Figure 6). In those experiments the rate of truck arrivals was uniform during an hour.
The effect of the increased use of forest chips to replace the use of peat on queuing times was examined in scenario D. Because the energy content of forest chips is around 0.1 MWh per loose m³ less than peat, the transport of solid fuel increased. As the share of forest chips in the total fuel load is raised from 10% to 30% to 50%, the resulting increases in truck arrivals are 1.5%. 3.7% and 6.3% respectively, when compared to the current situation. The impacts of increasing arrivals were compared to the base simulation, where 48 trucks per day were arriving on average. It was assumed that the same transporting equipment could be used and no changes to unloading times and other functions would take place. Only the expectation values of Poisson distributions, which defined the number of arriving trucks per hour, were modified.
RESULTS AND DISCUSSION
Scenario A - Balancing of capacity utilization between delivery bays
Each experiment contains the average values of ten simulation runs; queuing times and degrees of utilization of delivery bays are reported. Acceleration of the hopper's fuel flow at DB1 had only a minor effect on queuing times and practically no change on the use of delivery bays was detected (Figure 7 and Table 3). When the main fuel supplier's RU trucks were directed to the shorter queue the queuing times decreased considerably (experiments A2A-A2C). The fuel flow speed of 110 m³/hour at DB1 was not fast enough to enable shorter queuing times, when truck controlling was on. In that situation many trucks had to wait for hopper 1 to become empty, which is determined by the consumption speed of combustion unit 1, before they could unload. In these runs, increment of fuel flow speed of DB1's hopper increased the utilization rate of DB1. Compared to the base scenario (A1A), increasing the speed of fuel flow of hopper 1 from 110 m³/h to 200 m³/h and directing the RU trucks to the shortest queue diminished average truck queuing time from 19.9 minutes to 5.8 minutes.
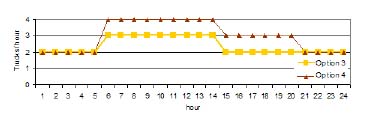
Figure 6. Time-schedule of the truck arrivals used in scenario C.
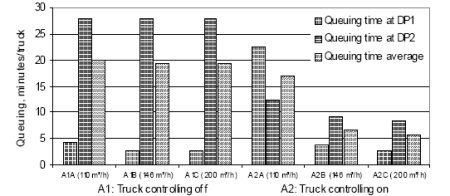
Figure 7. Average queuing times of fuel trucks at the receiving station and its' delivery bay in simulation scenario A (Increasing the use of DB1). Values in parentheses are DB1 hopper's fuel flow speeds.
Table 3. Degrees of capacity utilization of both delivery bays at the fuel receiving station in different experiments in simulation scenario A (Increasing the use of DB1).
| Degrees of capacity utilization in different experiments, % | ||||||
|---|---|---|---|---|---|---|
| A1A | A1B | A1C | A2A | A2B | A2C | |
| DB1 | 14.9 | 14.8 | 14.8 | 23.2 | 25.1 | 25.3 |
| DB2 | 57.9 | 58.1 | 58.1 | 47.7 | 45.4 | 44.8 |
Scenario B - Time-Scheduling of Arriving Trucks
Although, in experiments B1A-B1D the utilization degrees did not differ markedly from each other, queuing varied significantly (Figure 8 and Table 4). Time-schedule option 1, where two trucks were set to arrive during every hour, was an improvement of the current situation. Moreover, queuing times of trucks diminished further when truck controlling was applied in the simulations.
Concerning queuing, the best alternative among B scenarios was B2C, when the trucks were set to arrive uniformly with truck controlling at the plant and with time-schedule 1. On the other hand, in the experiments B2A-B2D queuing times were very short and also the degree of utilization of DB1 increased. For example, the sub-situation with constant truck arrivals (B2B) resulted in 10.9 minutes shorter queuing time per truck than in the base scenario (A2A) (both scenarios had truck controlling and speed of fuel flow in hopper 1 was 110 m³/h).
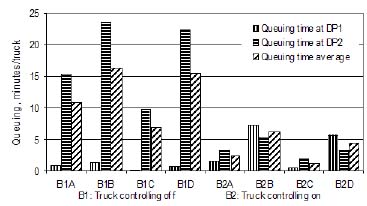
Figure 8. Average queuing times of fuel trucks at the receiving station and its delivery bays, when scenario B (time-scheduling of arriving trucks) was used in simulations.
Table 4. Degrees of capacity utilization of both delivery bays at fuel receiving station in different experiments (scenario B).
| Degrees of capacity utilization in different experiments, % | ||||||||
|---|---|---|---|---|---|---|---|---|
| B1A | B1B | B1C | B1D | B2A | B2B | B2C | B2D | |
| DB1 | 125 | 13.6 | 12.3 | 13.4 | 23.4 | 23.2 | 24.3 | 23.5 |
| DB2 | 59.2 | 58.2 | 59.8 | 58.8 | 45.8 | 45.8 | 44.8 | 46.1 |
Scenario C - High Use of Fuel
When the use of fuel was high in the power plant, more trucks were queuing at the receiving station even if truck controlling was applied (Figure 9). Increase of the fuel flow at DB1's hopper from 146m³/h to 200 m³/h would shorten the queuing remarkably. An additional increase to 300 m³/h did not greatly affect queuing times. At peak truck arrivals (72 trucks/day) the current maximum fuel flow speed (146 m³/h) with truck controlling at the station resulted in an average queuing time of 65.5 minutes per truck. Increasing the hopper's fuel flow speed to 200 m³/h diminished queuing time to 19.5 minutes/truck.
When time scheduling was used for truck arrivals, the queuing time decreased noticeably in experiments C1E, C1F and C2F (Figure 10). However, the speed of fuel flow in hopper 1 was critical, when 72 trucks arrived per day. Increase of the fuel flow at DB1's hopper from 146 m³/h to 200 m³/h decreased the average queuing times per truck remarkably (from 43.5 min to 6.5 min).
The degree of utilization of DB1 was approximately 30% in experiments C1A-C1F (Table 5). Only a small increase in utilization of DB1 was detected when the speed of fuel flow increased. At both delivery bays the increase of utilization degree was 10 percentage points when arrivals increased from 57 to 72 trucks per day.
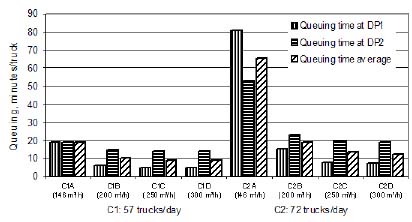
Figure 9. Average queuing times of fuel trucks at the receiving station and its' delivery bays, when scenario C (increased truck arriving per day, a cold period) was used in simulations. Values in parentheses are DB1 hopper's fuel flow speeds.
Table 5. Degrees of capacity utilization of both delivery bays at fuel receiving station in different experiments (scenario C).
| Degrees of capacity utilization in different experiments, % | |||||||||||||
|---|---|---|---|---|---|---|---|---|---|---|---|---|---|
| C1A | C1B | C1C | C1D | C1E | C1F | C2A | C2B | C2C | C2D | C2E | C2F | ||
| DB1 | 29.7 | 31.3 | 31.5 | 31.5 | 30.2 | 30.2 | 31.0 | 39.5 | 40.6 | 40.6 | 33.5 | ||
| 41.4 | DB2 | 53.6 | 51.4 | 50.9 | 50.9 | 52.0 | 51.9 | 63.8 | 60.1 | 59.5 | 59.1 | 70.5 | 61.2 |
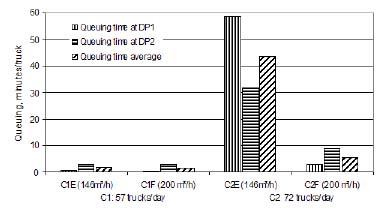
Figure 10. Average queuing times of fuel trucks at the receiving station and its' delivery bays, when scenario C's (increased truck arriving per day, a cold period) experiments of trucks time schedule were used in simulations. Values in parentheses are DB1's hopper's fuel flow speeds.
Scenario D - Increased Use of Forest Chips
The transported volume increases, if forest chips are used instead of peat. Replacing 10 % of the peat with forest chips increases the transport volume by 1.3%. However, in the simulations the change, in queuing time and degree of utilization of both delivery bays compared to the current situation, was insignificant (Figure 11 and Table 6). If 50% of the fuel is forest chips, fuel transporting increases by 6.3% and queuing times increase by 3.5 minutes per truck compared to the base situations. Implementing truck controls at the fuel receiving station has a greater effect on queuing than the increased use of forest chips.
CONCLUSION
Discrete-event simulation was chosen to analyze the procedures involved in the arrival and unloading of the trucks. The possibility of using detailed arrival data for modeling the simulation system [15, 16] and the variability in the arrival process such as peaks of arrivals during the day [8] underlined the necessity of using simulation instead of queuing theory. Simulation is an appropriate method with this kind of problem where no optimal situation is sought, but different solutions are compared. Furthermore, sensitivity analyses are considered essential where simulation is the appropriate tool [15, 16].
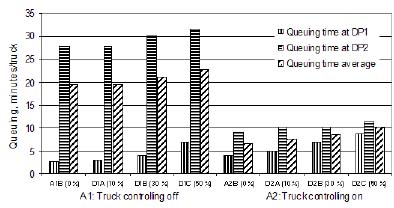
Figure 11. Average queuing times of fuel trucks at the receiving station and its delivery bays, when scenario D (increased use of forest chips) was used in simulations. Values in parentheses are proportions of forest chips of total fuel use.
Table 6. Degrees of capacity utilization in both delivery bays at fuel receiving station in different experiments (scenario D).
| Degrees of capacity utilization in different experiments, % | ||||||||
|---|---|---|---|---|---|---|---|---|
| A1B | D1A | D1B | D1C | A2B | D2A | D2B | D2C | |
| DB1 | 14.8 | 15.3 | 15.5 | 17.4 | 25.1 | 25.3 | 25.6 | 27.1 |
| DB2 | 58.1 | 57.8 | 58.3 | 59.6 | 45.4 | 45.7 | 46.1 | 47.8 |
The most practical way to shorten the queuing times effectively is to direct RU fuel trucks to the delivery bay with the shortest queue. This arrangement, however, requires approval of deliveries of more varying quality fuel to delivery bay 1. By minimizing trucks' lead-times at the receiving station, the use of traffic lights could control the flow of deliveries. Following weighing, the fuel truck would be guided to the appropriate delivery bay to minimize the queuing and waiting times.
A major bottleneck in the fuel receiving operations at the plant proved to be the speed of fuel flow from DB1's hopper to combustion. To increase the degree of utilization of DB1 and to minimize the lead-times of the trucks, the speed of fuel flow from the hopper must be increased together with truck controlling at the station. Increasing the fuel flow over 146 m³/h requires the feeding of fuel from the hopper 1 not only to boiler 1's storage silo but also to boiler 2's storage silo. This could be arranged by installing a new feeding conveyor to the storage silo of boiler 2.
The scheduling of truck arrivals was found to be a very effective way to reduce queuing times, which has also been found in previous studies [10]. Strict schedules, where truck arrivals are uniform, with constant truck arrivals per hour would, however, be difficult to attain in real life: the truck drivers would be opposed to working nights, in addition to the realistic fact that precise scheduling is impossible in practice. Strict scheduling of truck arrivals could even redistribute the waiting time of the trucks to some other phase of fuel transport. A more feasible option would be an adjusted truck arrival schedule, where arrival peaks in the mornings are smoothed out and trucks can arrive at any time during a particular hour (like simulation scenario B2B).
Cold periods, when the power plant is producing energy at its capacity, is critical for the reception of fuel to ensure that fuel feeding to combustion is not delayed. Truck controls to ensure the minimal queuing time and an increase in the fuel flow speed of hopper 1 up to 200 m³/h effectively reduced the queuing times of trucks in "cold week" simulations. Short lead-times of trucks at the reception station ensure smooth fuel receiving at the power plant and also provide possibilities for transport entrepreneurs to improve their own operations. Fleet management systems using new mobile phone technology facilitate the control and optimization of transportation for smaller entrepreneurs [13].
Increased use of forest chips did not significantly affect queuing times even if the use of forest chips increased to 50% of total fuel consumption. It must be kept in mind that these results did not consider possible restrictions and extra time consumption caused by modifications to fuel handling devices and combustion techniques.
In theory, building high capacity fuel hoppers and unloading equipment, which do not limit the unloading of the trucks, could solve many logistical problems concerning the reception of fuel at the power plants. Examples may be found in the pulp industry. Such facilities, however, would be expensive and during warm seasons their capacity would be underutilized at the power plants. Generally the fuel terminal's facilities and equipment account only for a minor part of the total investment of a power plant. However, their importance is considerable for the efficiency of the whole plant, especially as more than half of the operating failures at plants are linked to the fuel handling machinery [12].
Subjects for further simulation studies could be the effect of capacity changes of the hoppers and truck containers on the fuel receiving process. To find the most feasible alternative for improving the fuel receiving system at the plant would require the introduction of monetary factors to the simulation model. At this stage costs of investment options were not available, but possible cost additions to the simulations could be made in further studies.
ACKNOWLEDGEMENTS
The authors would like to thank Mr. Matti Voutilainen and Mr. Ari-Pekka Savolainen for giving the information on the structure and operations of fuel reception at the power plant, Mr. Jukka Pietilä for analyzing the data from the fuel receiving database, Mr. Juha Nisula for making the simulation runs and recording their results. Also thanks goes to Mr. David Gritten for checking the English language.
This study was part of the "Logistics of Forest Chips Transportation" -subproject of the Wood Energy Technology Program (1999-2003) and was mainly funded by National Technology Agency of Finland.
AUTHOR CONTACT
Mr. Väätäinen can be reached by e-mail at --
kari.vaatainen@metla.fi
REFERENCES
[1] Alakangas, E. 2002. Puuenergian teknologiaohjelman vuosikirja 2002. [The Yearbook 2002 of the Finnish Wood Energy Technology Programme.] VTT Symposium 221. 422 pp.
[2] Asikainen, A. 1995. Discrete-event simulation of mechanized wood-harvesting systems. University of Joensuu, Faculty of Forestry, Research Notes 28. 86 pp.
[3] Asikainen, A. 1998. Chipping terminal logistics. Scan. J. For. Res. 13(3): 386-391.
[4] Asikainen, A. and J.Nuuja, 1999. Palstahaketuksen ja hakkeen kaukokuljetuksen simulointi. [The simulation of forest stand chipping and long-distance transporting of forest chips.] Metsätieteen aikakauskirja 3/1999:479-490.
[5] Asikainen, A. 2001. Simulation of logging and barge transport of wood from forests on islands. International Journal of Forest Engineering. 12(2):43-50.
[6] Hakkila, P. 2003. Developing technology for large-scale production of forest chips. Wood Energy Technology Programme 1999-2003. Technology Programme Report 5/2003. National Technology Agency, TEKES. 54 pp.
[7] Impola, 2001. Puupolttoaineille soveltuvat vastaanotto- ja käsittelyjärjestelmät. [Receiving and handling systems suited for wood fuels.] In: Alakangas. E. [Ed] The Yearbook 2001 of the Finnish Wood Energy Technology Programme. VTT Symposium 216: 315-327.
[8] Joustra, P. E. and N. M Van Dijk, 2001. Simulation of check-in at airports. Proceedings of the 2001 Winter Simulation Conference. Crystal Gateway Marriott, Arlington, VA. December 9-12, 2001. Pp. 1023-1028.
[9] Koger, J. 1992. Analyzing timber harvesting systems using STALS-3. Forest Products Journal, 42(4): 25-30.
[10] Korpilahti, A. 1987. Puutavaratoimitusten ajoitus tehdasvastaanoton kustannusten optimoinnissa; jonoteoriaa soveltava tarkastelu. [Timing of round wood delivery in optimisation of costs of mill's wood receiving.] Metsätalouden liiketieteen lisensiaattityö. Helsingin Yliopisto. 80 pp.
[11] Linnainmaa, S., J. Savola, J. and O. Jokinen. 1995. EPO - A knowledge based system for wood procurement management. Aikins, J. and H. Shrobe. Pp 107-113. [Ed]. Proceedings of the Seventh IAAI-95 Conference on innovative applications of artificial intelligence, August 21-23, 1995, Montreal.
[12] Nojonen, O. and T. Järvinen,. 1996. Tehokas ja pölytön seospolttoaineiden vastaanottoasema sekä käsittely- ja kuljetinjärjestelmä. [Efficient and dustless receiving station of mixed fuel components and handling- and conveyor mechanism.] In: Alakangas, E. [Ed] Bioenergian tutkimusohjelma. Vuosikirja 1995. Osa 3. Bioenergian käyttö ja biomassan jalostus. Pp. 96 - 97.
[13] Ranta, T., A. Asikainen, M. Lehikoinen, K. Väätäinen, P. Halonen, and P. Frilander, 2002. Metsähakkeen autokuljetuksen logistiikka. [The logistics of transporting forest chips.] Tutkimusselostus. VTT Prosessit. 31 pp.
[14] Savola, J. and O. Jokinen, 1995. Puunkorjuun suomalainen ratkaisu. [A finnish solution for timber harvesting.]VTT -tietotekniikka. 9 pp.
[15] Taha, H. A. 1992. Operations research. An introduction. 5th edition. New York, NY MacMillan. 822 pp.
[16] Thesen, A. and L.E. Travis, 1992. Simulation for Decision Making. West Publishing Company, St. Paul, Minnesota. 384 pp.
[17] Vuosikertomus. [Yearbook.]2001. Vapo Oy. 50 pp.
[18] Väätäinen, K., L. Sikanen, and A. Asikainen, 2000. Rakeistetun puutuhkan metsäänpalautuksen logistiikka. [Logistics of returning granulated wood ash back to the forest.] Joensuun yliopiston metsätieteellisen tiedekunnan tiedonantoja 116. 99 pp.
[19] Witness. 1996. Witness. Release 8. Book 2 - Creating Witness models. Lanner Group. 206 pp.
The authors are, respectively, Researcher and Professor at the Joensuu Research Centre of the Finnish Forest Research Institute, and Researcher at the Forest and Environment Group Ltd.