Vol. 16 No. 2 January 2005
Energy Use in Swedish Forestry in 1972 and 1997
Eva-Lotta Lindholm
Staffan Berg
The Forestry Research Institute of Sweden
Uppsala, Sweden
ABSTRACT
A comparison is made of energy usage and the contribution made to the global warming potential (GWP) by present (1997) and past (1972) forestry operations (including secondary haulage) in Sweden. The results are expressed in units of one cubic metre (solid u.b.) of harvested timber.
The results indicate that, since 1972, improvements in fully mechanized forestry operations, particularly logging, have led to a reduction in total energy use from 1972 (236 MJ). In fact, the energy used by today's (1997) mechanized logging systems (147-200 MJ) is roughly the same as that used by motormanual systems back in 1972 (156-177 MJ). The same is true as regards the contribution made to global warming potential: more fossil carbon was released in mechanized forestry (22 GWP) in 1972 than in 1997 (13-17 GWP). What's more, the contribution to GWP in 1997 is on the same level as that made by motormanual systems in 1972 (15-16 GWP).
It is accepted that forest management in Sweden mitigates the global warming potential. This is because the resulting sequestration effect in forest biomass is greater than the level of emissions from forestry operations.
Keywords: Energy use, harvesting, forestry operations, forest technology.
Note: All measurements of timber in "m3" in this paper are cubic metres solid under bark.
BACKGROUND
Following the War in the Middle East in October 1973 and the attendant oil crisis, the Royal Swedish Academy of Agriculture [19] launched an energy inquiry into forestry and agriculture in Sweden. In 1975, Genfors & Thyr [12] published an analysis of energy use in Swedish forestry for the years 1956 and 1972. In the period between those years, both the extraction of timber and the secondary haulage operations were mechanized, and river driving was superseded by road haulage. This technological development led to a threefold increase in the energy demand.
With the establishment of the World Commission on Environment and Development (WCED) process [2], the ecological evaluation of products, production processes and services took on a new importance in trade and marketing, with businesses seeking to find tools that could define and demonstrate environmental properties. For sectors like the forest products industry and the automotive industry, this became critical, as the perception in some customer segments was that some of the products and production processes were having an adverse impact on environment. A variety of tools, such as certification, eco-labelling and life cycle assessment (LCA) [34] were developed to identify the impact on the environment of certain goods and services [6].
Since the Earth Summit in Rio de Janeiro in 1992 (UNCED), both forests and forestry have been added to the international agenda for a variety of reasons; above all, because of the ability of the forest to function as a potential carbon sink, thus helping to reduce the level of greenhouse-gas emissions into the atmosphere, which are deemed to influence the Earth's climate [15].
Forestry and land use in general are unique in this context, in that their capability to store carbon can be influenced and controlled. Forest vegetation sequesters CO2 from the atmosphere, although CO2 is released through respiration and the decay of organic matter and litter. Harvesting also causes CO2 emissions, as sequestrated carbon is transferred to industrial forest products and logging residue. The fuel consumed in forestry operations also gives rise to emissions into the atmosphere that contribute to the landowner's and country's total emissions of CO2.
The new policy on products had implications for the forestry sector and numerous LCAs and studies on energy use relating to forestry and forest products were carried out. Noteworthy are those by Schweinle [24] and Schweinle and Thoroe [], who present a technical analysis of forest production in Germany; and Winkler [31] and Knechtle [17, 18] from Switzerland. Karjalainen and Asikainen [16], Berg and Karjalainen [7] and Berg & Lindholm [8] present data on energy use and related emissions from forest operations in Sweden and Finland.
According to several European forestry studies over the past decade (Table 1), the energy use in silviculture and logging ranges from less than 100 MJ/m3 up to 135 MJ/m3. Secondary haulage accounts for 90-125 MJ. This raises total energy use to a level of 180-230 MJ/m3. Higher energy use has been demonstrated in exceptionally difficult terrain conditions [30], and in long- distance haulage of pulpwood [25].
Table 1. Studies on energy use in forest operations in the 1990s (MJ/m3).
| Silviculture and logging | Secondary haulage | Total | |
|---|---|---|---|
| Germany [24], saw logs, spruce (transport distance 50 km). | 135 | 92 | 227 |
| Switzerland [17, 18], Mechanized logging, | 91 | - | - |
| Switzerland [17, 18], Motor-manual logging, | 111 | - | - |
| Germany [30], (Transport distance 50 km). | 62 | 125 | 187 |
| Central Sweden [8]. | 88 | 99 | 187 |
The purpose of this study is to compare forestry systems in Sweden in the late 1990s with the situation in the early 1970s, with regard to energy use and greenhouse-gas emissions per cubic metre of timber delivered to the mill.
METHODS AND MATERIALS
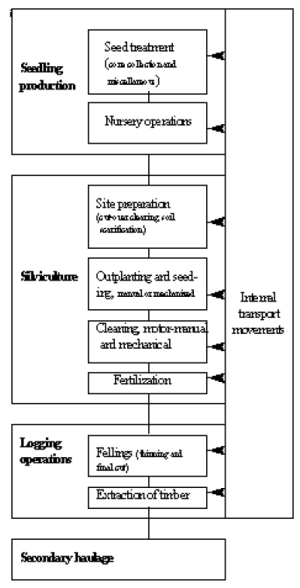
The forestry systems considered included: seedling production (seed treatment and nursery operations), silviculture (site preparation, outplanting and (direct) seeding, cleaning, and fertilization), logging (felling and extraction) and secondary haulage (see Fig.1). Internal transport movements have been apportioned to the various forest operations.
Data on energy use in forest operations in Sweden in 1996-7 [8] (hereinafter referred to as 1997) were compared with corresponding data for 1972. Total fossil energy use and operations of the latter were evaluated in accordance with Genfors & Thyr [12] and national statistics [21].
The operations in 1972 varied both in extent and the technology used. One particular system was used in small-scale forestry, whereas two other systems, using mutually different methods, were used in large-scale operations. The annual cut in 1972 was 56.8 million cubic metres. Large-scale harvesting accounted for 63% of the cut, with small-scale forestry accounting for the rest. Motormanual felling dominated in both large-scale and small-scale forestry, with only 2% of the cut being felled by mechanized methods. Mechanized limbing and bucking (17%) was also used in large-scale logging. Several methods of secondary transportation were used: road haulage, rail haulage, river driving and rafting. The data for energy input in forest seedling production in Sweden 1972 was estimated according to data from the National Board of Forestry [21].
Logging in 1997 was carried out by means of a fully mechanized dual-machine system employing the cut-to-length method, with secondary haulage being done by road or rail. Data was collected from parts of northern, central and southern Sweden. The northern and central areas each comprised a forest-management district (business unit) of a large forest enterprise in their respective areas, with operations in their own forests covering an area of 700,000 and 350,000 ha, respectively. The southern area, which comprised 335,000 ha, belonged to a large industrial forestry cooperative. Each of the three areas had an annual cut of about one million cubic metres. Data on machine operations, contractor services and other commodities (product or service that is available on a market [32]) used in achieving the annual cut were taken from actual operating statistics and business accounts. Production data for containerized seedlings was derived from Aldentun [1]. The figures for each area were broken down by using the number of seedlings per hectare and the area planted. The areas supplied with seedlings from the individual nurseries were determined by their geographical location (Table 2).
Table 2. Input of plants/ha for outplanting in forest areas 1997.
| North | Central | South | |
|---|---|---|---|
| Number of plants outplanted per hectare | 2300 | 2300 | 3200 |
| Nursery | Kilåmon | Lugnet, SörAmsberg | Lugnet, Hille |
An estimate was made of fuel consumption in internal transport movements in silvicultural operations in both large-scale and small-scale forestry in 1972. The figures for large-scale forestry were derived from a forest worker employers' association, and those for small-scale forestry (family-forest enterprises) from statistics on the number of hours worked and the average distance to the site. The corresponding fuel-consumption figures for 1997 came from forestry contractors and the forest enterprises.
Data collected on input energy and commodities (in this case diesel, petrol, oils, lubricants and electricity) was applied to both the operations performed and the volume harvested (Table 3). The study was limited to the extraction of energy carriers (substance or phenomenon that can be used to produce mechanical work or heat or to operate chemical or physical processes [32]) that had been injected into the operations. It did not include energy carriers involved in the production of capital goods (machinery and buildings) nor transport from the manufacturer to the forest management region. The outputs were roundwood, and emissions contributing to the global warming potential (GWP).
The levels of emissions into air and water attributable to energy use were calculated using representative emission series. Emission factors for forestry machines used in 1997 came from contemporary studies of tractors and forestry machines [14], and were adjusted to the forestry machines of 1997 according to [8]. The data source for machines used in 1972 was the Swedish EPA [28]. Emission reports produced by the Network for Transport and the Environment [20] were used for diesel truck engines, petrol and diesel cars, ships and ferries.
Figure 1. Forest operations in the forestry system.
The electric power used in the systems was taken from the Swedish grid. In 1972, the approximate mix of the power generated was 82% hydro, 16% oil and 2% nuclear. The corresponding figures for 1997 were based on the mix in 1995, as calculated by CIT Ekologik [3]. They were 47% hydro, 46% nuclear, 0.1% oil, and 6.7% CHP (combined heat & power). Owing to shortcomings in the availability of data for electricity generation in 1972, the production figures for hydro, oil and nuclear power from 1995 were used [9]. In addition, as no figures for data on the extraction and production of oil in 1972 were available, the data used for both 1972 and 1997 was taken from Frischknecht et al. [11].
The impact of energy use on global warming has also been evaluated, with the aid of the weighting system devised by the Intergovernmental Panel on Climate Change (IPCC) [15]. The unit of measurement used is the Global Warming Potential (GWP), which is based on the underlying assumption that anthropogenic emissions of greenhouse gases can influence the climate. The weighting system weights substances as greenhouse gases according to their strength. The emitted greenhouse gas per kg produced material and the potential greenhouse effect is given in kg CO2 equivalents per kg for each gas. The most important man-made greenhouse gases are the following: CO2 (carbon dioxide) = 1 GWP; CH4 (methane) = 21 GWP; N2O (nitrous oxide) = 310 GWP; halocarbons (CFCs = hydrocarbons containing chlorine, fluorine or bromine) = 100-1200 GWP [26].
RESULTS
Energy Use
Seedling Production
Energy use in forest-tree seedling production was higher in 1997 than in 1972 (Table 4), which reflects advances in seedling production, whereby the use of bare-root seedlings (85%) was replaced by container seedlings cultivated in heated greenhouses.
Silviculture
Fuel consumption in silvicultural operations is shown in Table 5. As can be seen, fuel consumption reflects the scale of operations (Table 3). In 1972, most areas designated for soil treatment were scarified (97%), with prescribed burning being carried out on the remaining 3% of the area. In 1972, planting was carried out on 98% of the regeneration sites, with direct seeding being performed on the remaining 2%. In 1997, mechanized planting was carried out on some regeneration sites in the northern and central regions (9% and 12%, respectively, of the regeneration area). Natural regeneration, in the form of seed-tree and shelterwood systems, was practised in both 1972 and 1997. This is not shown in Table 5, as no usage of fuel was reported for these systems.
Table 3. Annual cut and area treated in the forestry systems.
| Forestry systems | Northern 1997 | Central 1997 | South 1997 | Large-scale mechanized systems, 1972 | Small-scale, motormanual system 1972 | |||||
|---|---|---|---|---|---|---|---|---|---|---|
| Forest operations | Area, hectares | Volume, m3 s.u.b. | Area, hectares | Volume, m3 s.u.b. | Area, hectares | Volume, m3 s.u.b. | Area, hectares | Volume, m3 s.u.b. | Area, hectares | Volume, m3 s.u.b. |
| Soil scarification | 7 377 | 1 733 | 1 927 | 74 122 | 25 082 | |||||
| Prescribed burning | 49 | 3 148 | 397 | |||||||
| Direct seeding | 2 104 | 1 339 | ||||||||
| Planting, manual | 4 010 | 1 793 | 3608 | 103 163 | 65 577 | |||||
| Planting, mechanized | 387 | 249 | ||||||||
| Pre-regeneration clearing and clearing of under storey trees, motor-manual | 3 300 | 482 | 1100 | 128 792 | 85 020 | |||||
| Pre-regeneration clearing and clearing of under storey trees, manual | 14 310 | 9 225 | ||||||||
| Cleaning, motor-manual | 3 386 | 3 407 | 1 104 | 157 906 | 102 878 | |||||
| Cleaning, manual | 8 311 | 5 415 | ||||||||
| Cleaning, mechanized | 361 | |||||||||
| Fertilization 1 | 533 | 1 416 | 114 5971 | 114 5971 | ||||||
| Thinning 2 | 7 940 | 172 987 | 2 916 | 166 300 | 1 684 | 165 000 | ||||
| Final felling 2 | 6 630 | 994 713 | 3 398 | 770 600 | 3 816 | 935 000 | 35 868 000 | 20 916 000 | ||
| Total logged | 14 570 | 1 167 700 | 6 314 | 936 900 | 5 500 | 1 160 000 | ||||
| Secondary haulage | 1 234 165 | 1 131 309 | 1 100 000 | 35 868 000 | 20 916 000 | |||||
1 The total area fertilized in both large- and small-scale forestry.
2 In 1972, no distinction was made between the volume of cut and the area felled in thinning and final felling.
Table 4. Energy use in forest tree seedling production in 1972 and 1997 (MJ/m3).
| Forestry systems | Petrol | Diesel, truck | Diesel, tractor | Sea transport | Electricity | Heating oil and lubricants | Total |
|---|---|---|---|---|---|---|---|
| Northern Sweden, 1997 | 0.029 | 0.96 | 0.10 | 0.000 | 0.90 | 3.3 | 5.3 |
| Central Sweden, 1997 | 0.034 | 0.59 | 0.19 | 0.011 | 2.33 | 5.4 | 8.5 |
| Southern Sweden, 1997 | 0.017 | 0.70 | 0.16 | 0.003 | 1.80 | 6.3 | 9.0 |
| All systems 1972 | 0.31 | 0.22 | 1.05 | 1.6 | |||
In 1972, cleaning and clearing work were largely carried out motormanually by brush saw and chainsaw, with only about 10% performed manually. In 1997, most cleaning and clearing work was still being performed motormanually. Mechanized cleaning was practised only in central Sweden—on 10% of the area.
In 1972, 114,600 ha of forest land was fertilized, which was a greater extent than in 1997, in terms of its proportion of the annual cut (Table 3). Light aircraft were used to spread fertilizer on 97% of the treated area. In 1997, the fertilizer in the central region was transported to the site by road and then spread by helicopter, whereas spreading in the northern region was done by forwarder or tractor.
The total fuel consumption for all silviculture work is shown in Table 5. As regards large-scale forestry, the column includes data on both systems, as the only difference between them is in the logging technique employed.
Table 5. Energy use in silvicultural operations 1972 and 1997 (MJ/m3).
Energy use MJ/m3 |
|
|---|---|
| Northern Sweden, 1997 | 16 |
| Central Sweden, 1997 | 15 |
| Southern Sweden, 1997 | 3.5 |
| Large-scale mechanized, and motor-manual, 1972 | 7.8 |
| Small-scale motor-manual, 1972 | 28 |
Logging Operations
In 1972, all felling and processing in small-scale forestry was performed using motormanual methods, and these methods were also dominant in large-scale forestry—except for about 2% of felling and 17% of processing, which were mechanized. Most extraction work was also mechanized, with forwarders accounting for 95% in large-scale forestry, and farm tractors accounting for 76% in small-scale forestry. The mechanized large-scale systems used more energy per cubic metre—142 MJ/m3, as compared with 63 and 64 MJ/m3, respectively, in motormanual large-scale logging and small-scale forestry (see Table 6).
By 1997, all logging operations had been mechanized. Harvesters now felled, limbed and bucked (cross-cut) the stems in thinnings and final fellings, and forwarders extracted the logs to the roadside. The variation in energy use was lower in 1997 than in 1972, with the range across the regions being between 66 MJ/m3 in the north and 57 MJ/m3 in the south (see Table 6)
Secondary Haulage
In 1972, it was assumed that energy use in secondary haulage was the same in both small-scale and large-scale forestry. The various modes of transport were road (55%; tonne km), rail (16%, tonne km), river driving (10%, tonne km) and rafting (19%, tonne km). In 1997, the haulage of timber to the mill involved a combination of road haulage vehicles (79%, tonne km) and rail (21%, tonne km). The average energy use in 1972 was 84 MJ/m3; in 1997, secondary haulage used more energy in the north and central regions (113 and 99 MJ/m3) than in the south (77 MJ/m3) - see Table 7.
Table 6. Energy use in logging operations in 1972 and 1997 (MJ/m3).
| Energy Carriers | Large-scale, mechanized 1972 | Large-scale, motor-manual 1972 | Small-scale forestry 1972 | North 1997 | Central 1997 | South 1997 |
|---|---|---|---|---|---|---|
| Fuel use, felling | 88 | 16 | 16 | 34 | 40 | 29 |
| Fuel use, forwarding | 46 | 46 | 42 | 28 | 23 | 24 |
| Lubricants | 8.6 | 1.3 | 6.2 | 3.9 | 2.0 | 4.8 |
| Sum | 142 | 63 | 64 | 66 | 65 | 57 |
Table 7. Energy use in secondary haulage to the mill, 1972 and 1997 (MJ/m3).
| Forestry Systems | Road | Rail, Electricity | Rail, Diesel | Floating | Rafting | Total |
|---|---|---|---|---|---|---|
| All systems 1972 | 76 | 3 | 0.1 | 4 | 84 | |
| Northern Sweden, 1997 | 98 | 10 | 4.9 | 113 | ||
| Central Sweden, 1997 | 91 | 8.3 | 99 | |||
| Southern Sweden, 1997 | 77 | 77 | ||||
Total Energy Use
The fossil energy required to produce one cubic metre of timber, from the regeneration phase to delivery at the mill, differed from one system to another (Table 8). The highest energy demand (236 MJ/m3) occurred in mechanized large-scale logging in 1972, followed, in 1997, by logging in the north (200 MJ/m3) and central regions (187 MJ/m3), in which energy use was comparable to that in small-scale systems in 1972 (177 MJ/m3). The lowest energy use (147 MJ/m3) was recorded in the southern region in 1997. Despite the advances in technology that occurred between 1972 and 1997, the amount of energy used in both large and small-scale motormanual operations in 1972 (63 and 64 MJ/m3) was roughly the same as in the northern and central regions in 1997 (66 and 65 MJ/m3). Exceptions to this were mechanized operations in 1972 (142 MJ/m3) and logging in the south in 1997 (57 MJ/m3).
Table 8. A breakdown of fossil-energy use by operation in forestry, 1972 and 1997 (MJ/m3).
| Forestry systems | Seedling Production | Silviculture | Logging | Secondary Haulage | Sum | |
|---|---|---|---|---|---|---|
| Northern Sweden, 1997 | 5.3 | 16 | 66 | 113 | 200 | |
| Central Sweden, 1997 | 8.5 | 15 | 65 | 99 | 187 | |
| Southern Sweden, 1997 | 9.0 | 3.5 | 57 | 77 | 147 | |
| Large-scale mechanized, 1972 | 1.6 | 7.8 | 142 | 84 | 236 | |
| Large-scale motor-manual, 1972 | 1.6 | 7.8 | 63 | 84 | 156 | |
| Small-scale motor-manual, 1972 | 1.6 | 28 | 64 | 84 | 177 | |
In 1997, secondary haulage accounted for 53-57% of the total energy used in the systems. Because the secondary haulage systems used in 1972 were universal in Sweden, the levels of energy used (84 MJ/m3) were also the same. Accordingly, secondary haulage accounted for 48% of the total energy used in small-scale forestry, for 52% in large-scale operations with motormanual logging, and for 35% in large-scale operations with mechanized logging.
Seedling production and silviculture together used less energy than logging or secondary haulage. Small-scale forestry in 1972 accounted for the highest energy demand (30 MJ/m3), with large-scale forestry having an energy demand of only 10 MJ/m3. In 1997, energy use in the northern and central regions was 21 and 24 MJ/m3, but only 12 MJ/m3 in the south.
Global Impact -- Climate Change Caused By Greenhouse-Gas Emissions
The estimated contribution to global warming made by forest operations is shown in Figure 2 and Table 9.
Table 9. Breakdown of greenhouse-gas emissions (per cubic metre of timber produced) from forestry systems, 1972 and 1997.
| Substance | Carbon dioxide, CO2 (kg) | Methane, CH4 (g) | Nitrous oxide, N2O (g) | |
|---|---|---|---|---|
| Large-scale mechanized, 1972 | 20.8 | 28.1 | 0.7 | |
| Large-scale motor-manual, 1972 | 14.0 | 18.8 | 0.4 | |
| Small-scale motor-manual, 1972 | 15.3 | 20.8 | 0.4 | |
| Northern Sweden, 1997 | 16.6 | 22.0 | 0.8 | |
| Central Sweden, 1997 | 15.6 | 20.4 | 0.6 | |
| Southern Sweden, 1997 | 12.6 | 16.6 | 0.4 | |
Because carbon dioxide was found to be the principal contributor to global warming, the findings concur well with the energy demand shown in Table 8. Large-scale mechanized logging in 1972 accounted for the highest energy demand and, because CO2 is a product of fuel combustion, this system also had the highest potential global-warming impact (22 GWP) per cubic metre of timber produced. This was closely followed by the northern and central systems in 1997 (17 and 16 GWP, respectively), and the large and small-scale motormanual systems of 1972 (15 and 16 GWP). The difference between the systems of 1972 lay in the logging systems used, with mechanized logging producing the highest impact (13 GWP or 61%). The impact of the fully mechanized logging operations in 1997 was almost the same as that of motormanual methods in 1972 (6 GWP). The highest emissions of greenhouse gases came from secondary haulage in the 1997 systems (7-9.5 GWP or 52-55%) as against 7.5 GWP in 1972. If the energy use and GWP emissions/m3 from the systems were put in proportion to the annual cut in Sweden, 1997, 60.5 Mm3 [22] they would amount to ca 9-14 PJ or 0.8 -1.3 Giga GWP, which corresponds to 0.20-0.36 Mt of carbon (assuming that the GWP consists entirely of CO2).
DISCUSSION
Genfors and Thyr [12] found that the energy demand increased in Swedish forestry between 1956 and 1972. The main reason for this was the mechanization of logging operations and the increased use of road vehicles for the secondary haulage of timber. The results of the present study indicate that energy use in the total system of 1997 (147-200 MJ) was lower than in the mechanized system of 1972 (236 MJ), but of roughly the same magnitude as in the motormanual systems of that time (156-177 MJ). Increased mechanization since 1972 has not resulted in a rise in total energy use; in fact, it has led to more energy-efficient logging machines. In contrast, energy use in silviculture has increased, owing to supposedly higher ambitions in technology and silvicultural treatment. The same is also true in secondary haulage because of the greater use of road vehicles.
There was a wide difference in energy use between silvicultural systems, which amounted to 2-15% of the total energy used. There are many reasons for this. Firstly, internal transport movements in silvicultural work involve considerable energy usage. It has been difficult to identify and specify all relevant transport movements in this field. The estimates might be imperfect. Secondly, there have been developments in seedling production. In 1972, bare-root seedlings were dominant, but the situation was reversed in the 1990s, when container seedlings became the most widely used. Container-seedling systems use more fossil energy than the bare-root system does, but they also offer advantages in outplanting and seedling establishment in the field. This latter advantage may not be fully reflected in this work because of shortcomings in the data on internal transport movements.
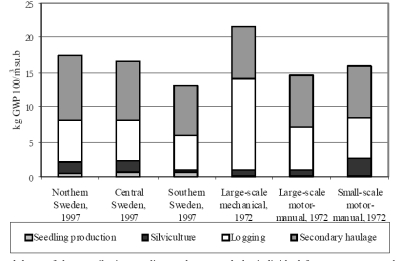
Figure. 2. Breakdown of the contribution to climate change made by individual forestry systems and operations. Global Warming Potential (GWP).
The results illustrate improvements in forest operations in general, and in logging in particular. This can largely be explained by the advent of more-efficient machines thanks to improvements in engine and machine design, operational logistics, productivity and operational efficiency. In 1972, single-function machines were used in mechanized logging for all logging operations, ie, felling, limbing, bucking and extraction [27]. In 1972, mechanized logging was in its infancy; in contrast, by the 1990s, logging had become fully mechanized, with the most common logging system comprising a harvester (a single-grip or two-grip machine), which felled, limbed and bucked the trees, and a forwarder that extracted the timber to the roadside. Advances in technology produced machines that were both more efficient and more sophisticated, resulting in a step up from mechanization to automation.
It is difficult to predict how logging operations will be improved in the future. It would be possible to reduce fuel consumption in processing, and important advances in forwarding might be achieved through an expansion of the forest-road network. Other improvements might include longer knucklebooms on harvesters [13] and optimizing route planning by equipping forwarders with GPS [5]. The combined harvester-forwarder, known as a "harwarder", might lead to lower fuel consumption, as the system would consist of a single machine rather than a dual-machine system.
Secondary haulage accounted for more than 50% of the energy use in Swedish forestry in 1997. In fact, it created a higher energy demand and a greater contribution to GWP in 1997 than in 1972. This was due to an increase in road haulage and, possibly, longer haulage distances in 1997 than in 1972, when 30% of transport work involved river driving and rafting—which imposed a very low demand on external energy sources. Researchers in timber haulage [10] argue that there are many ways of decreasing the energy demand in secondary road haulage, such as by reducing the transport distance, adjusting the load factors, using better route-planning systems, improving the standard of roads (widening, curve geometry, better surfacing/pavements) and adopting a more-economical driving style.
The total energy use per cubic metre in the Swedish forestry system fits into a European perspective, as reflected by data from [17, 24, 25 and 30], but results also reveal that energy use in logging operations in Sweden is low compared with operations in continental Europe.
The environmental impact of energy use contributes to the global warming potential. Advances in technology reduced the environmental impact of logging in the fully mechanized systems of 1997 to a level below that of the motormanual systems of 1972.
With the advent of the Kyoto Process, the contribution of forestry to global warming is now a topic on the international agenda [4]. If we assume that forest management is sustainable, the impact of forest operations on global warming will be determined by energy use (burning of fossil fuels). Because of sustainable forest management, there is also an annual growth of forest tree biomass that sequesters certain quantities of carbon [23]. There is a tendency in some quarters to interpret this carbon sequestration to mean that it will give rise to a reduction in the potential for global warming. But the magnitude of the environmental impact is both unclear and also, to some extent, subject to international negotiation. According to the latest session in Marrakech [29], the level for Sweden is set at 0.58 Mt of carbon per year (2.13 Mt of CO2/year), which is higher than the estimated figure given in this report for carbon emissions from forest operations 1997 (0.20 - 0.36 Mt carbon. However 0.58Mt is a considerable underestimate of the actual sink, the difference between growth in forestry biomass and removals, which is estimated to be as high as 8 Mt carbon per year for the periods of 1990-2002 [33].
AUTHOR CONTACT
Dr. Staffan Berg can be reached by e-mail at --
staffan.berg@skogforsk.se
REFERENCES
[1] Aldentun, Y. 2002. Life cycle inventory of forest seedling production - from seed to regeneration site. Journal of Cleaner Production. (10): 47-55.
[2] Anon. 1987. The World Commission on Environment and Development, WCED (Brundtland Commission). Our Common Future, Oxford. Oxford University Press 1987.
[3] Anon.1996. Chalmers Industriteknik (CIT) Ekologik. LCA Inventory Tool (LCAiT) version 2.1. Software programme. 1996. (Using data from Brännström-Norberg et al. Life-Cycle Assessment for Vattenfall´s Electricity Generation, Summary Report. Stockholm Vattenfall. 1996).
[4] Anon. 1997. FCCC/CP/1997/L.7/Add.1. Kyoto Protocol to the United Nations Framework Convention on Climate Change. http://www.unfccc.int/resource/docs/cop3/l07a01.pdf. As read August 27, 2003.
[5] Arvidsson, P-Å., P. Eriksson, I. Eriksson, M. Rönnqvist, A. Westerlund and P. Igeklint, 1999. Smartare vägval i skotningen - bra för både ekonomi och miljö [Smarter route planning for forwarders benefits both profitability and the environment. Resultat Nr 22:1999. SkogForsk. In Swedish with summary in English.
[6] Berg, S. 2000. Methods for Environmental Assessment of Forestry Operations - An Overview. Forest and Society: The Role of Research. Sub-Plenary Sessions vol.1. XIX IUFRO World Congress 2000. International Union of Forestry Research Organisations.
[7] Berg, S. and T. Karjalainen. 2003. Comparison of greenhouse gas emissions from forest operations in Finland and Sweden. Forestry 76(3): 271-284.
[8] Berg, S. and E-L. Lindholm. 2005. Energy use and environmental impacts of forest operations in Sweden. Journal of Cleaner Production . Vol. 13, pp 33-42. Available online at www.sciencedirect.com.
[9] Brännström-Norberg B.M., U. Dethlefsen and R. Johansson. 1996. Life-cycle assessment for Vattenfall's electricity generation: summary report. Stockholm : Vattenfall.
[10] Forsberg, M. 2002. Transmit - Driftstatistik och vägstandardens påverkan på bränsleförbrukningen. [Operating statistics and road standard impact on fuel consumption. The Forestry Research Institute of Sweden. Arbetsrapport 515.
[11] Frischknecht, P. Hofstetter. and I. Knoepfel. 1996. Ökoinventare für Energiesystemen. Grundlagen für den ökologischen Vergleich von Energiesystemen und den Einbezug von Energiesystemen in Ökobilanzen für die Schweiz. Energiewirtschaftliche Grundlagen. [Ecological inventory (LCI) of energy systems for LCA comparisons of Switzerland's energy industry. Bundesamt für Energiewirtschaft.
[12] Genfors, W. and B. Thyr. 1976. Dataunderlag för energibalansberäkningar inom skogsbruket. [Basic data for energy-balance evaluations in forestry. Department of operational efficiency. Department of Operational Efficiency, Royal College of Forestry. Garpenberg. Research Notes 96, 1976. 65pp.
[13] Hallonborg, U. and B. Nordén. 2001. Successful trial with long knuckleboom. . The Forestry Research Institute of Sweden. Results No. 3:2001. SkogForsk .
[14] Hansson, P-A., A. Burström, O. Norén and M. Bohm. 1998. Bestämning av motoremissioner från arbetsmaskiner inom jord- och skogsbruk [Engine emissions from agricultural tractors and forestry machines. Department of Agricultural Engineering, Swedish University of Agricultural Sciences Rapport/Report 232.
[15] IPPC 1997. Revised 1996 IPPC Guidelines for National Greenhouse Gas Inventories. Vols 1-3. Houghton, J.T., L.G. Meira Filho, B. Lim, K. Treanton, I. Mamaty, Y. Bonduki, D.J. Griggs and B.A. Callander [Eds. Intergovernmental Panel on Climate change. IPCC/OECD/IEA, Paris, France.
[16] Karjalainen, T. and A. Asikainen. 1996. Greenhouse gas emissions from the use of primary energy in forest operations and long-distance transportation of timber in Finland. Forestry 68 (3): 215-228.
[17] Knechtle, N. 1997. Materialprofile von Holzerntesystemen - Analyse ausgewählter Beispiele als Grundlage für ein forsttechnisches Ökoinventar [Material profiles from forest harvest systems. Analyses of chosen examples as a base for forest LCI. ETH Zürich, Departement für Wald- und Holzforschung, Professur Forstliches Ingenieurwesen. Diplomarbeit, WS 1996/97.
[18] Knechtle, N. 1999. Materialprofile von Holzerntesystemen als Ausgangspunkt für Ökoinventare [Material profiles from forest harvest systems as a basis for LCI. Schweizerische Zeitschrift für Forstwesen 150(3):81-87.
[19] KSLA. 1975. Skogs- och jordbruket i en energikris. Energiflödet i svenskt skogs- och jordbruk 1956 - 1972. [Energy crisis in forestry and agriculture. The flow of Energy in Swedish forestry and agriculture 1956 - 1972. Kungl. Skogs- och lantbruksakademins tidskrift. (Journal of the Royal Swedish Academy of Agriculture and Forestry). Nr 4-5:114: 213-231.
[20] NTM (the Network for Transport and the Environment). 2002-04-01, version 2000-05-31. http://www.ntm.a.se. As read on January 1, 2002.
[21] National Board of Forestry [Sweden. 1972. Statistical Yearbook of Forestry 1972.
[22] National Board of forestry [Sweden. 1998. Statistical Yearbook of Forestry 1998.
[23] Regeringskansliet. 2001. Sweden's third communication on Climate Change. Ministry of the Environment, Sweden DS2001:71.
[24] Schweinle, J. 1996. Analyse und Bewertung der forstlichen Produktion als Grundlage für weiterführende forst- und holzwirtschaftliche Produktlinien - Analysen [Analysis and evaluation of forest production as a base for forest products. Mitteilungen der Bundesforschungsanstalt für Forst- und Holzwirtschaft. Nr. 184, September 1996. Kommissionsverlag Buchhandlung Max Wiedebusch, Hamburg.
[25] Schweinle, J. and C. Thoroe. 2001. Vergleichende Ökobilanzierung der Rundholzproduktion in verschiedenen Forstbetrieben [Comparative ecobalance for timber production in different forest enterprises. Mitteilungen der Bundesforschungsanstalt für Forst- und Holzwirtschaft. Nr. 204, August 2001 Kommissionsverlag Buchhandlung Max Wiedebusch, Hamburg.
[26] Swedish Environmental Management Council (SEMC). 2000. Requirements for Environmental Product Declarations - EPD an application of ISO TR 14025 Type III environmental declarations. MSR 1999:2.
[27] Silversides, C.R. and U. Sundberg. 1988. Operational Efficiency in Forestry. Volume 2: Practice. Forest Science. Kluwer Academic Publishers.
[28] Swedish Environmental Protection Agency (EPA). 1990. Luftföroreningar från arbetsfordon [approximately "Emissions to air from work vehicles". Handlingslinjer. Underlagsrapport till Luft 90, Aktionsprogram mot luftföroreningar. Solna. Sweden.
[29] United Nations. 2002. FCCC/CP/2001/13. Add.1 21 January 2002.
[30] Wegener, G. 1994. Der positive Beitrag der Holznutzung zur CO2 Bilanz. S. 187-197 In: Kongressforum „Holz" im Rahmen der Internationalen Grünen Woche, [Positive contribution by timber to CO2 balance F.W. Bröker [Ed. Mitteilungen der Bundesforschungsanstalt für Forst- und Holzwirtschaft, April 1994, Berlin. Kommissionsverlag Buchhandlung Nr. 176, Max Wiedebusch, Hamburg.
[31] Winkler, C. 1997. Vorstudie Ökoinventare von Holzerntesystemen. ETHZ D-WAHO Forstliches Ingenieurwesen [Preliminary LCI for logging systems. Interne Berichte Nr. 7.
[32] Swedish Institute for Standards. 1999. Technical energy systems - Basic concepts. ISO 13600: 1997. Svensk standard SS-ISO 13600.
[33] Swedish Environmental Protection Agency. 2004. Sweden's national Inventory Report 2004. Submitted under the United Nations Framework Convention on Climate Change. http://www.naturvards-verket.se/dokument/fororen/utslapp/fcccdata/NIR.pdf. As read May 11, 2004.
[34] Swedish Standards Institution. 1997. Environmental management - Life cycle assessment - Principles and frame work (ISO 14040:1997) Svensk Standard SS-EN-ISO 14040. 2001.18pp.
The authors are, respectively, Researcher and Senior Researcher at The Forestry Research Institute of Sweden.