Vol. 16, No. 2 July 2005
Suraj P. Shrestha
Bobby L. Lanford
Auburn University
Auburn, AL USA
Robert B. Rummer
USDA Forest Service
Auburn, AL USA
Mark Dubois
School of Forestry and Wildlife Science University
Auburn, AL USA
The authors are, respectively, Visiting Scholar from Nepal, Associate Professor Emeritus, Auburn University; Project Leader, Forest Operations and Engineering Research, USDA Forest Service, Auburn; and Associate Professor, School of Forestry and Wildlife Sciences, Auburn University, AL.
ABSTRACT
Forest harvesting with animals is a labor-intensive operation. It is expensive to use machines on smaller woodlots, which require frequent moves if mechanically logged. So, small logging systems using animals may be more cost effective. In this study, work sampling was used for five animal logging operations in Alabama to measure productive and non-productive time elements to determine utilization with respect to operators, functions (felling and processing of trees, skidding, loading, and forwarding of logs), animals, and machines. Cost of log production was calculated from the figures reported by owners and the crew members. Average utilization of crew was 58 percent, animals (horses and mules) were utilized only 22 percent and the machines were utilized from 5 to 74 percent of scheduled time. Average cost of log production per m3 was $11.28. There appears to be an opportunity to reduce cost of log production by coordinating functions, increasing scheduled work hours, utilization of machines and animals, and reducing labor cost.
Keywords: Animal logging, utilization, felling and processing of trees, log skidding, loading and forwarding of logs.
BACKGROUND
Heinrich [12] identified three levels of harvesting operations: 1) labor-intensive, 2) intermediate-technology, and 3) fully mechanized. Logging with animals is considered to be labor-intensive. Before 1920, mule logging was a busy enterprise in the US South [16]. Oskarshamn [19] stated that worldwide 400 million draught animals were utilized for transportation and agriculture of which horses and mules comprised 37 million. Only a fraction of horses/mules are used in logging operation. Rodriguez and Fellow [21] stated that due to development of efficient machinery and high volume demand from the forest products industry, mechanization of logging developed very fast leaving behind the traditional logging systems such as horse and mule logging.
Horses are more active, faster, and more intelligent than bovine and they are easily handled and adapted to a wide range of climates [5]. In Finland, horses traditionally are used singly except where heavy equipment like wagons with a knuckleboom loader requires a pairs of horses [15]. Horses are suitable for winter weather because they can tolerate cold weather whereas mules can work better than horses in hot weather [1 and 28]. Mules are suitable to work in southern US because they can tolerate heat better than horses [28].
The North American Horse and Mule Loggers' Association (NAHMLA) was formed in 1991 for the promotion of animal logging operations [7]. In the mid-1950's Forbes [9] expressed that mechanical logging was replacing horse and mule logging but it looks like the trend has partly reversed. In selective cutting of second-growth stands on the rugged upper slopes of the Pacific Northwest, interest in animal logging has increased. Bahls [3] mentioned that near Missoula, Montana some people prefer horses as a low impact alternative for logging. British Horse and Mule Loggers' Association (BHLA) was established in 1992 due to increasing interest in animal logging in northwest England and Scotland [31]. Hedman [10] reported that there is an increasing interest in the use of horses in Swedish forestry. Wang [30] mentioned that in Heilongjiang forest region of China, the proportion of animals in logging decreased from 1951 to 1976 but was increasing after 1976. Waterson [31] mentioned that horse logging is growing, but improved techniques are needed to increase output and reduce costs.
Pynn [20] identifies draft horses such as Belgian, French Percherons and English Clydesdale as a tradition from earlier of logging days. Among horses, other popular heavy breeds are Shires and Suffolks. Both Percherons and Belgian breeds are equally well suited to logging [14]. The best horses for woods work are between five and ten years old and weigh between 590 and 820 kilograms [24]. As a rule of thumb, a horse can pull his own weight [2 and 13]. Mules can be productive to the age of 35 years, a horse is considered too old after 20 years, and an ox has a useful life of about 10 years [1 and 6].
Horse logging could also be carried out successfully by small contractors in urban areas and in forested areas of special environmental interest [11]. McCabe and Tiner [16] recommended that mule logging be carried out on small acreages with selective cutting where landowners want minimum damage to the remaining trees and areas not accessible to skidders. Shrestha [23] found that horse/mule logging operation had only 3% of ground under deeply disturbance and rutting leaving 22% slightly disturbed and 75% undisturbed ground. Thompson and Sturos [25] mentioned that horses could skid through tight spaces in partial cuts, with very little damage to residual boles, Oskarshamn [19] reported that skidding with horses is suitable for a distance of 25 to 100 meters with skidding tongs, 50 to 300 meters with sled-type equipment and skidding bogies, and 100 to 1,000 meters with wagons.
A team of horses with harness cost between $4,000 and $5,000 [20]. Animal loggers in Alabama suggested total costs of $10,000 for two horses or mules, a used pickup truck, a used logging truck, horse trailer, two chainsaws, wedges, axes, and various related items [16]. Bradley [4] estimated $3,000 for a pair of mules, $2,500 for used truck and loader, and $600 for chainsaw. Sarels and Luppold [22] estimated the cost per day for logging system owning and operating for horses was less than $200 with cost of log production at $7.85 to $11.30 per m3.
In Alabama, most of the horse and mule loggers are located in the northern half of the state. These are hilly areas with oak-hickory and mixed pine-hardwood forests typically owned by non-industrial private forest (NIPF) landowners in small tracts [26]. Toms [27] reported that animal logging in Alabama was comprised of a crew with an average of three people, two animals and one side loading truck. Weekly production of logs from animal logging operations ranged 38 to 68 metric tons, depending upon the equipment. Toms [27] found that most of the animal logging in Alabama is a family tradition and operators learned logging from their fathers. McCabe and Tiner [16] mentioned several horse/mule loggers were following family traditions, wanted to be independent, self-employed, enjoyed working as outdoors work. Toms et al. [28] mentioned that there is no problem finding work for animal loggers in Alabama.
Efficient utilization of manpower, machines, or animals is a key factor to increasing overall system productivity and reducing cost of harvesting per unit of timber. There is very little literature on the utilization and cost of log production from animal logging when machines are combined with animals.
The objective of this study was to examine utilization for animal logging operations with respect to operators,
felling and processing of trees, skidding of logs, loading or forwarding, animals, machines, and determining cost of log production when horses/mules are combined with machines for logging.
METHODOLOGY
Field data were collected during summer and fall of 1999 and in the spring of 2001. Five types of animal logging crews working in Alabama during the study period were selected as the sample for this study.
Animal Logging Operations Studied
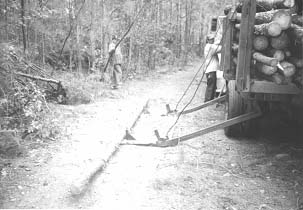
The composition of five types of animal logging operations observed for this study is summarized in Table 1. Horses with forwarder (H/FWD) crew was owned by operators but operators in mules with forwarder (M/FWD) crews were non-owners. Mules were left in the woods in a fenced area overnight for M/FWD logging operation. This crew had four mules but only two mules were used for logging each day. In the horses with side loading truck (H/SLT) operation, logs were loaded onto a truck when 2 to 5 logs were skidded by horses near the arms of truck (Figure 1). H/SLT was owned by family members. Horses with knuckleboom loader (H/KBL) (Figure 2) crew was a one man operation, who did felling and processing of trees, skidding and loading of logs. Horses with long stick cable loader truck (H/LSCLT) (Figure 3) crew was owned by a family having two horses but only one horse was used each day. Each animal logging crew had two chainsaws, harnesses for animals with tongs, hooks and accessories.
These five crews were selected to represent the range of all possible animal logging systems identified in Alabama during the study period as described by Toms [27]. They were studied when they were working. Conditions that could be found for all animal logging operations were partial cuts and almost flat ground (less than 10% slopes) in pine/hardwood mixed stands.
Figure 1. A side loading truck.
Table 1. Composition of five animal logging operations.
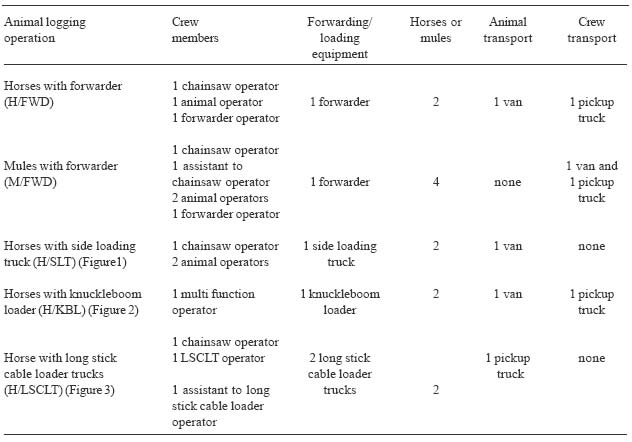
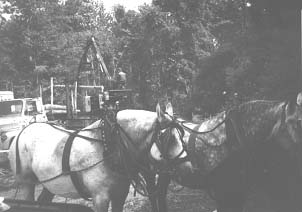
Figure 2. Horses with knuckleboom loader.
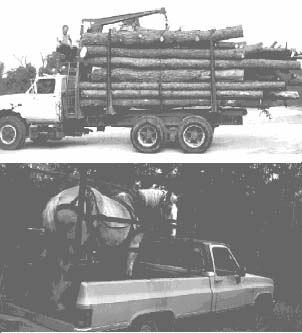
Figure 3. Horse and a long stick cable loader truck.
Utilization
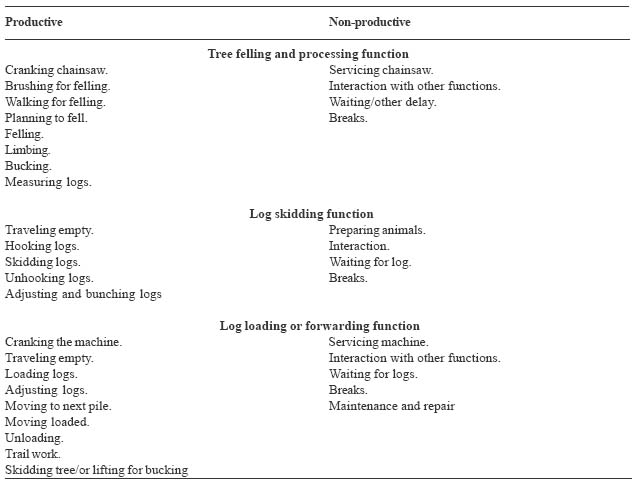
The proportion of time involved in each activity was obtained by taking a work sample of operators, functions, and animals/machines [17]. The three main functions taken into consideration were: 1) felling and processing of trees; 2) skidding of logs; and 3) loading or forwarding of logs. Hauling of logs to log yards or mills was not included in this study.
Observations were recorded at five-minute intervals for each day from the beginning of work until the end. Work performed outside the woods was not taken into account for this study. Work activities varied slightly from crew to crew depending upon the management goals, crewmembers, and animals/machines used. Crewmembers often performed multiple functions. For instance, operators who primarily ran chainsaws might also spend time skidding with horses. Utilization was defined as the ratio of productive time to total time. Identification of productive and non-productive activities was based on the best judgment of the observer during the activity. The general categories of activities for each function are given in Table 2.
Table 2. Productive and non-productive time elements for three functions.
Utilization was recorded as a binomial variable, and analyzed using least squares regression analysis. Animal logging crew, individual operators, machines and animals were independent variables. Productive and non-productive elements for felling and processing of trees, skidding of logs and loading or forwarding of logs were dependent variables. A linear regression model with dummy variables was used.
The machine rate method described by Miyata [18] was used to calculate fixed, operating, and labor costs to determine cost of log production. Daily volume of log production, fixed costs, variable costs and labor costs were obtained from owners and crew members for five animal logging operations. However, economic life of new and used equipment, and maintenance and repair costs were included as reported by owners and the crew members. All five animal logging operations purchased animals at the working age. Purchase price of horses/mules, harnesses, tongs and accessories were included. Variable cost for feeding and maintenance of animals were includes for 365 days. As reported by logging crew, economic life for a horse was set at 12 years whereas for a mule it was 15 years. All animal operators had experience of handling horses/animals for more than five years. All animal loggers had practical training in operating horse/mule from their fathers or family members. However, none of the animal operators had a formal training on animal logging operation.
RESULTS AND DISCUSSIONS
Utilization
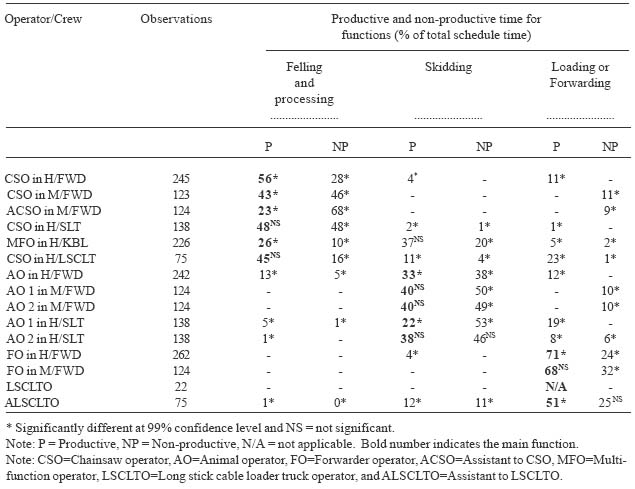
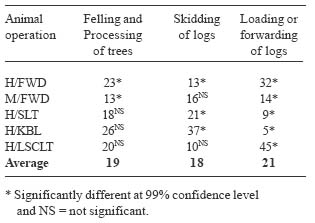
Table 3 presents productive and non-productive time for three functions for fifteen operators in five animal logging operations. All together 2,180 work sampling observations were recorded.
Table 3. Productive and non-productive time for operators in three functions.
Crew Utilization
Figure 4 shows the crew utilization. Utilization rates for crew members combined of the five animal operations were compared, and it was found that there were no significant differences among the knuckleboom loader, the long stick cable loader truck, and horses with forwarder operations. Mules with forwarder and horses with side loading truck operations had significantly lower utilization compared to horse with forwarder crew. The long stick cable loader truck crew had highest utilization of 75 percent. The reason for the mules with forwarder crew having the lowest utilization may be due to the crew members being non owners; in the other four operations, owners were directly involved in the harvesting activities.
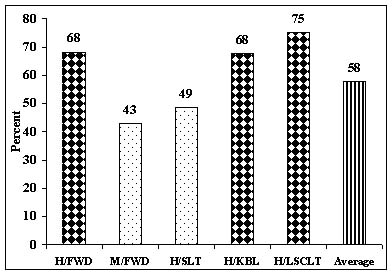
Figure 4.Crew utilization in percent.
Utilization of Individual Operators
Figure 5 shows utilization for each operator. Most operators spent time doing more than one function, that is to say, an individual's productive time might include only his primary task but usually incorporated secondary tasks also. The productive time percentages contributed by both forwarder operators (75 and 68 percent), chainsaw operators in long stick loader crew (79 percent), the multi-functional operator in the knuckleboom loader crew (68 percent), and the assistant to long stick cable loader truck (64 percent) were not significantly different from that of the chainsaw operator in the forwarder with horse operation (71 percent).
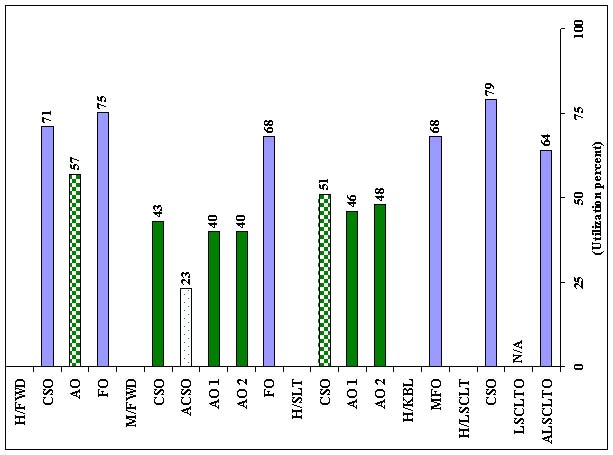
Figure 5. Productive time for all operators (% of schedule time).
Note: CSO=Chainsaw operator, AO=Animal operator, FO=Forwarder operator, ACSO=Assistant to chainsaw operator, MFO=Multi-function operator, LSCLTO=Long stick cable loader operator, ALSCLTO=Assistant to LSCLTO.
Utilization for animal operator in horses with forwarder crew; chainsaw operator, assistant to chainsaw operator, animal operators 1 and 2 in mules with forwarder crew; chainsaw operator, animal operator 1 and 2 in horses with side loading truck crew were significantly lower than chainsaw operator in horses with forwarder crew.
Utilization of the long stick cable loader truck operator was not included because most of the time was spent outside the woods. There was no significant difference for utilization between animal operator in the horses with forwarder crew and chainsaw operator in the horses with side loading truck crew. However, assistant to chainsaw operator in the mules with forwarder was significantly less utilized than animal operator in the horses with forwarder and chainsaw operator in the horses with side loading truck crew. Looking at the low utilization of assistant to chain saw operator in mules with forwarder, it seemed that harvesting for this crew could be conducted without this crewmember.
Utilization of Functions
Table 4 shows the percent of crew utilization spent in each function. Side loading truck, knuckleboom loader, and long stick cable loader crews were not utilized significantly different from the forwarder with horses crew for the felling and processing function, and the mule crew had significantly less felling and processing utilization compared to the others.
Table 4. Utilization by functions.
Felling and processing function
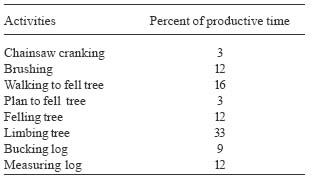
Ten operators were involved fully or partially in tree felling and processing (Table 3). Utilization for chainsaw operators in side loading truck (48 percent) and long stick cable loader truck (45 percent) operations was not significantly different from the chainsaw operator in horses with forwarder crew (56 percent), but the chainsaw operator (43 percent) and assistant to chainsaw operator (23 percent) in mules with forwarder; and multifunction operator with the knuckleboom loader (26 percent) operations had significantly lower utilization (Table 3). A breakdown of the productive activities involved for felling and processing of trees is given in Table 5.
Table 5. Distribution of productive time for felling processing from five animal logging operations.
Log skidding function
Log skidding utilization was defined as the proportion of skidding observations spent doing productive activities. Eleven out of 15 operators were involved in skidding with animals (Table 3). When examining utilization of operators performing the skidding function, it was found that there were no significant differences among the animal operators in the horses with forwarder crew (33 percent), animal operators 1 and 2 in mules with forwarder crew (40 percent each), animal operator 2 in the horses with side loading truck crew (38 percent), and the multi-functional operator in horses with knuckleboom loader crew (37 percent). Animal operator 1 with the side loading truck crew had similar but lesser utilization (22 percent) (Table 4). Distribution of productive time for skidding function for five animal logging operations is shown in Table 6.
Table 6. Distribution of productive time for skidding from five animal logging operations (%).
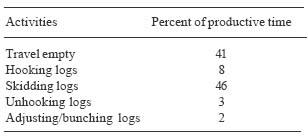
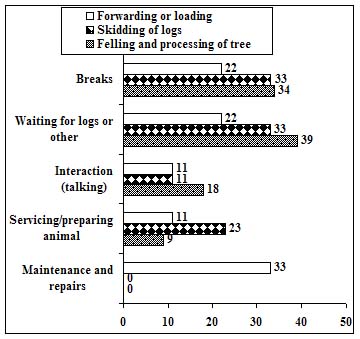
Figure 6. Non-productive time for operators in felling and processing trees, skidding of logs and loading or forwarding for five animal operations (%).
Log Loading or Forwarding Function
Forwarders, side loading trucks, knuckleboom loaders, and long stick cable loader trucks do not perform loading or forwarding in the same manner. Forwarders load skidded and bunched logs in the woods and unload onto setout trailers. Due to their large payloads and terrain capability, forwarders were used to harvest large tracts. Side loading trucks and long stick cable loader trucks loaded, skidded, and bunched logs in the woods and hauled them directly to a mill or log yard. While capable of some in-woods travel, they were more restricted than forwarders. The knuckleboom loader was placed at a landing and required the animals to skid logs to it prior to loading onto setout trailers. This system was restricted by how far the animals could skid.
It was found that there was no difference in utilization between forwarder operators for the horses with forwarder (71 percent) or the mules with forwarder (68 percent). The other operators who spent time with loading or forwarding had significantly lower utilization ranging from one percent by chainsaw operator in the side loading truck crew to 51 percent by the loading assistant on the long stick cable loader crew (Table 3).
The reason for high utilization for loading and forwarding function horses or mules with forwarder crews was due to individual operators assigned for loading or forwarding. Animal operators in the side loading truck crew that performed loading as well as skidding had lower utilization for loading and forwarding. However, the knuckleboom loader crew where one operator performed all three functions had the lowest utilization for loading and forwarding function. Distribution of productive time elements for log loading or forwarding is shown in Table 7.
Figure 6 shows non-productive time for felling and processing of tree, skidding of logs and loading/forwarding for five animal logging operations. Proportion of the overall crew utilization spent in each function is shown in Figure 7. Distribution of productive time for felling and processing averaged about 33 percent across all crews with a high of 39 percent for the knuckleboom loader crew and a low of 27 percent for the long stick cable loader crew. Skidding averaged 31 percent and ranged from 13 to 54 percent. Loading or forwarding averaged 36 percent and ranged from 7 to 60 percent (Figure 7). The knuckleboom loader crew used horses more for skidding as compared to other crews followed by the side loading truck crew and least by the long stick cable loader crew. When the non-productive time elements for all functions were grouped together and averaged, it was found that waiting accounted for 31 percent, breaks 30 percent, servicing 14 percent, interaction 14 percent, and repairs 11 percent.
Table 7. Distribution of productive time elements for loading or forwarding (%).
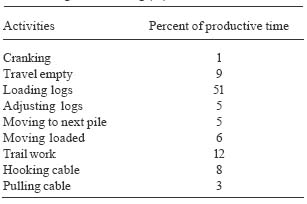
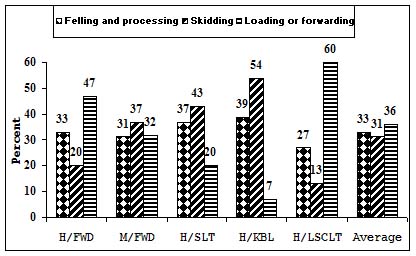
Figure 7. Proportion of productive time in each function (%).
Utilization of Animals
Table 8 compares the utilization of nine animals in the study. A tenth animal application paired the two horses used in the knuckleboom loader operation into a team. The two horses used in the horses with forwarder crew were used equally as were the horses used with the knuckleboom loader crew and the mules in the mules with forwarder crew. Only the horses with side loading truck crew were used a disproportionate amount of time. On average, animals were utilized 22 percent of the workday. Six out of the ten animal applications were utilized in equal amounts (not significantly different). The two mules and the second horse in the side loading truck crew had significantly higher utilization. The horse team with the knuckleboom loader operation was utilized significantly less, but this was due to the infrequent use of the horses in a team configuration. The reason for higher utilization of animals in mule crew and side loading truck crew was due to assignment of an individual operator for each animal.
Table 8. Utilization of animals, and loading and forwarding equipment (%).
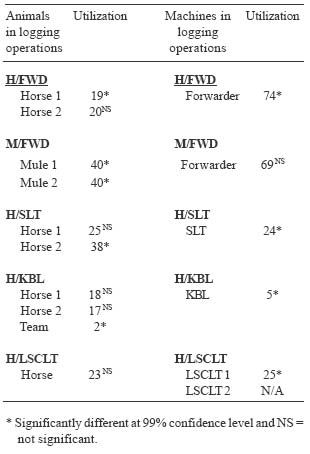
Utilization of Loading/Forwarding Equipment
When utilization of machines was compared, except for the second long stick cable loader truck, forwarders had the highest utilization. The side loading truck and one of the trucks with long stick cable loader were utilized approximately 25 percent. The knuckleboom loader was used the least. Crews with side loading truck, knuckleboom loader, and one of the long stick cable loader trucks had utilization significantly lower than the forwarders (Table 8). However, side loading truck and long stick cable loader truck 1 was utilized significantly more than the knuckleboom loader truck.
The reason for high utilization for both the forwarders was due to individual operators being assigned and traveling in the woods with these machines for loading and forwarding the logs. The other loading or forwarding equipment did not have individual operators. The side loading truck and knuckleboom loading truck were not traveling in the woods to load or forward logs. These two machines were low-priced used trucks and an individual operator was not assigned to them.
Productivity and Costs
Number of operators in crew, average daily working hours, and production of logs are shown in Table 9. Generally, the animal loggers worked less than 50 kilometers from their home. Purchase price of equipment and animals for five animal logging operations are given in Table 10. As reported by owners and crew members for five animal logging operations, depreciation for new equipment was set to be six years while five years for the used one. Interest, insurance and taxes were set at 13 percent.
As reported by the animal loggers and owners, labor cost ranged from $5.15 to $15.00 per hour. An average wage for the 15 crew members was $10.09 per hour. Workman's compensation of $1.18 per m3 and 9.65 percent of labor cost for social security (FICA) and federal unemployment insurance (FUTA) was used to determine the total cost for labor. No profit margin or overhead cost is included due to lack of valid data. Breakdown of variable costs for five animal logging operations is given in Table 11. Based on fixed costs, variable costs and labor costs; the costs of log production for five animal logging operations are shown in Figure 8. Figure 9 shows percent of distribution of fixed, variable and labor costs for five animal logging operations. Two-thirds of log production cost was comprised of labor while investment on equipment and animals averaged only sixteen percent.
Table 9. Productivity from five animal logging operations in Alabama.
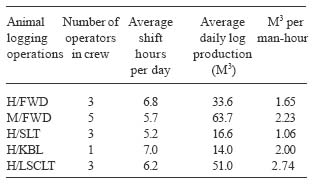
Table 10. Purchase price for five animal logging operations
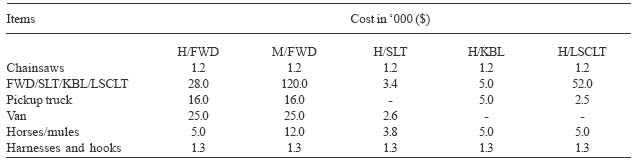
Table 11. Variable cost for five animal logging operations with schedule machine hour (SMH).
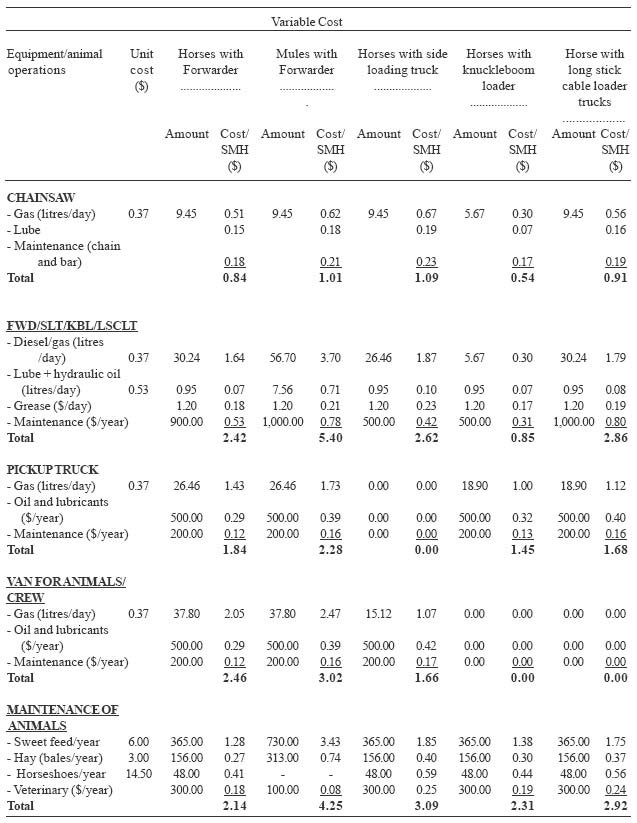
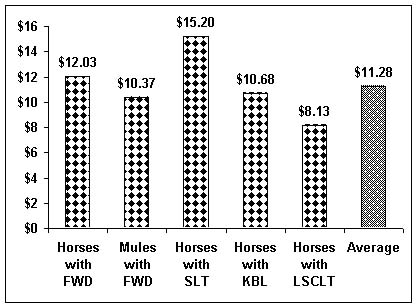
Figure 8. Cost of log production per m3 for five animal logging operations
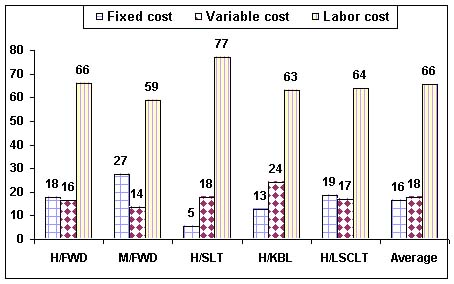
Figure 9. Distribution of fixed, variable and labor costs in percent for five animal logging operations.
CONCLUSION
Out of 15 operators, 7 operators had greater than 60 percent utilization, two had between 50 and 60 percent and the remaining six were below 50 percent utilization. This shows that there is an opportunity for the majority of operators to increase their utilization in the animal logging operation studied. Subsequently, this will increase the utilization of functions with an increase in log production.
Out of nine animals, two mules and a horse in side loading truck were utilized 40 and 38 percent respectively. The remaining horses were utilized 25 percent or less. Thompson and Sturos [25] found utilization of horses up to 60.5 percent. Fieber and Robson [8] however, found utilization of horses to be 36.6 percent. This indicates that there is an opportunity to increase utilization of animals examined in this study. This could be possible by coordinating the three functions. One third of non-productive time was for waiting due to non-coordination among the functions. However, coordination and change in composition of crew members, equipment and animal will be helpful to decrease the cost of log production by reducing percent of labor cost for animal logging operations.
Animal logging operations, if worked 8 hours per day, would have lower cost of log production due to fixed cost efficiency as well as increasing daily production. There is an opportunity to reduce waiting time and therefore, increase production.
The cost of log production per m3 was found to be directly related to log production per man hour. The higher the log production per man-hour, the lower the cost of log production per m3. Crew utilization is also directly related with the cost of log production except in the case of mules with forwarder operation.
Assignment of individual operator for loading and forwarding equipment is a crucial factor to maximize its utilization by balancing felling and processing and skidding functions. Utilization of the crew directly affects the cost of log production in an animal logging operation. More research and training are needed to improve utilization, productivity, and lower the cost of log production of animal operations.
AUTHOR CONTACT
Suraj P. Shrestha can be contacted by e-mail at --
shressp@auburn.edu
REFERENCES
[1] Anonymous. 1979. Logging with mules still alive in Mississippi. Logger and Lumberman 28(11):30c-31c.
[2] Anonymous. 1997. FAQ's of horse logging. http://www.televar.com/~gcaudell/faq's.html
[3] Bahls, J.E. 1991. Horsepower logging. American Forests 9:49-59.
[4] Bradley, M. 1995. Mule logging. Rural Heritage. Winter 1995, 11p.
[5] Brown, W.R. 1958. Our forest heritage. A history of forestry and recreation in New Hampshire. New Hampshire Historical Society, pp291-99.
[6] Damerow, G. 1994. Logging the new fashioned way. Mother Earth News. April/May, pp54-56 and 86.
[7] Deignan, J. 1997. Can tree huggers accept horse loggers? 'Equine Eco-logging.' PERC Reports, 14p.
[8] Fieber, W. and T. Robson. 1995. Jenny Spring. Horse logging as a new enterprise. USDA Forest Service. Pacific Southwest Region, 2-20pp.
[9] Forbes, R.D. 1955. Forestry handbook. Edited for Society of American Foresters by Reginald D. Forbes. Staff editor, Arthur B. Meyer. New York, Ronald Press Co.
[10] Hedman, L. 1986. The horse in forestry. Small Scale Forestry, pp13-17.
[11] Hedmen, L. 1992. Appropriate methods and techniques for horse logging under Swedish condition. Swedish University of Agricultural Sciences. Department of Operational Efficiency. Garpenberg, Sweden.
[12] Heinrich, R. 1985. Medium technology in wood harvesting. Logging and transport in steep terrain. FAO, Rome.
[13] Kidwell, B. 1995. Horse logging pulls its weight. Progressive Farmers, 48p.
[14] Kirsch, K.L. 1997. Skidding with horses. Rural Heritage. Summer, pp48-51.
[15] Leinonen, R. 1995. Horse logging in Finland. The Finnish Forest Research Institute. Research paper 557. Vantaa, Finland.
[16] McCabe, P.P. and E. Tiner. 1992. Mule logging: A dying art? Treasures Forest, Spring 1992, pp14-15.
[17] Miyata, E.S., H.M. Steinhilb, and S.A. Winsauer. 1981. Using work sampling to analyze logging operations. USDA Forest Service. North Central Forest Experiment Station. Research paper NC-213.
[18] Miyata, E.S. 1986. Determining fixed and operating costs of logging equipment. USDA Forest Service. North Central Forest Experiment Station. Res. Paper NC-55.
[19] Oskarshamn, T.A. B.P. 1983. Extraction using draught animals. Technical field note3. Swedish Forestry Technique with Possible Applications in the Third World.
[20] Pynn, L. 1991. Logging with horse power. Canadian Geographic 3(4):31-35.
[21] Rodriguez, E.O. and A.M. Fellow. 1986. Wood extraction with oxen and agricultural tractors. FAO Forestry Paper No. 49.
[22] Sarels, R.L and W.G. Luppold. 1986. Technoeconomic analysis of conventional logging systems operation from stump to landing. USDA Forest Service, Northeastern Experiment Station, Research Paper NE-577.
[23] Shrestha, S.P. 2002. Opportunities and limitations of animal logging in the US south. Ph.D. dissertation, School of Forestry and Wildlife Sciences, Auburn University.
[24] Stenzel G., T.A. Walbridge Jr., and J.K. Pearce. 1985. Skidding and forwarding. Logging and pulpwood production. John Wiley and Sons. New York City.
[25] Thompson, M.A. and J.A. Sturos. 1984. Bunching with low-investment systems in northern hardwood pole thinning. American Society of Agricultural Engineers. Paper No. 84-1599.
[26] Toms, C., J. Wilhoit, M. Dubois, J. Bliss, and B. Rummer. 1998. Animal logging fills important timber harvesting niche in Alabama. Alabama Agricultural
Experiment Station. Highlights of Agricultural Research 45(1):7-8.
[27] Toms, C. W. 1999. "Whoa, Mule!" Animal-powered logging in Alabama at the end of the twentieth century. MS thesis School of Forestry and Wildlife Sciences, Auburn University.
[28] Toms, C.W., M.R. Dubois, J.C. Bliss, J.H. Wilhoit, and R.B. Rummer. 2001. A survey of animal-powered logging in Alabama. Southern Journal of Applied Forestry 25(1):17-24.
[29] Wackerman, A.E. 1949. Harvesting timber crops. McGraw-Hill Book Company.
[30] Wang, L. 1997. Assessment of animal skidding and ground machine skidding under mountain condition. Journal of Forest Engineering 8(2):57-64.
[31] Waterson, J. 1994. The draught horses in UK forestry. Quarterly Journal of Forestry 88(4):309-33.
FUNDING ACKNOWLEDGEMENT
Funding for this project was provided by the USDA Forest Service, Forest Operations Research Unit, Southern Research Station, Auburn, AL.