Vol. 16, No. 2 July 2005
Caisa Hedlinger
SCA Containerboard Nordic
Obbola, Sweden
Benny Nilsson
Korsnäs Skog
Malung, Sweden
Dag Fjeld
Swedish University of Agricultural Sciences
Umeå, Sweden
The authors are, respectively, University Lecturer, Department of Silviculture, Swedish University of Agricultural Science, and Sales Coordinator, SCA Containerboard Nordic.
ABSTRACT
Structural changes in the Swedish forest products sector have resulted in increased round wood consumption per mill. Increased consumption volumes result in increased round wood transport distances and transport output (m³·km). At the same time, the coordination of transport services is being taken over by transport organizations of increasing size. New technological developments combined with organizational innovations have made linking between transport service providers easier. This has lead to the opportunity to offer different services through networking and diversify service levels for different customers (service divergence).
This study examines the service divergence potential of round wood transport in Sweden. The goal of the study is to develop a better understanding of customer demands and service complexity. This study is based on the interview results of 20 transport service providers and buyers in the Swedish forest sector. The results presented concern three main themes: transport service goals, decisions and decision support processes. The study reports the rankings of responses as well as their correlations in order to group them into a goal-decision-decision support hierarchy. The rankings and correlations are used to suggest a customer service matrix for round wood transport. The interview also included a fourth theme describing current problems with planning and control. The responses of this final theme are related to the different parts of the hierarchy in order to identify impediments to service divergence.
Keywords: service divergence, transport providers, wood supply.
INTRODUCTION
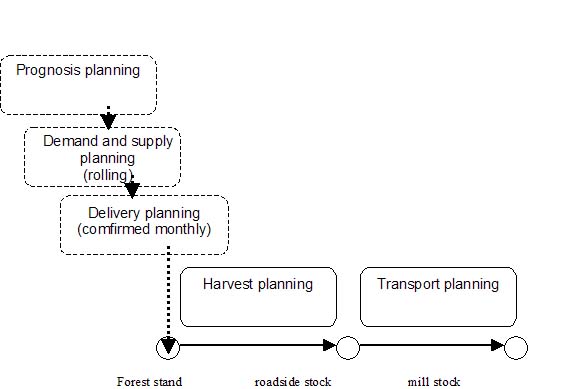
The primary function of a wood supply organization is to coordinate round wood supply with mill demand. In 2003 83.5 million cubic meters were harvested in Swedish forests with an average transport distance of approximately 100 km. This translates to an annual transport output of almost 8 billion m³·km. In order for forest companies to succeed with the supply obligations in a variable market and operational climate the whole wood supply process is divided into a number of sub-processes. These include long-term prognosis planning (1-5 years), demand and supply planning (rolling yearly or quarterly horizons), delivery planning (confirmed harvesting production aimed for specific mills on a monthly horizon), and finally harvest and transport planning (on a weekly horizon). Transport planning is the final of 5 sub-processes in wood supply and therefore subject to all the constraints of the higher sub-processes. Because the mill stock of round wood is often as little as one week's consumption transport operations have a particularly critical role in wood supply.
Transport service providers have a particularly important role in a lean wood supply chain. While the actual transfer of round wood is done by smaller owner/operators, different aspects of transport planning may be done by different parties in the supply chain. Tactical planning of round wood flows is most often done by the wood supplier or buyer while operational planning of transportation is done by the transport service provider. Structural changes towards larger service provider organizations with larger geographic operating areas enable a growing potential for differentiation of the level of service provided (service divergence). Service divergence requires a thorough understanding of the various levels of service which are possible to offer.
Goal
The goal of this study is to map the main goals, decisions and decision support processes within round wood transport for both services buyers and providers. The mapping will provide insight in the potential for service divergence. Main problems will also be mapped to locate impediments to divergence. The study is limited to road transport and does not examine rail or water transport.
Figure 1. The hierarchy of sub-processes within wood supply planning and control.
Wood Supply and the TPL Concept
Physical transfer of round wood in Sweden has for many decades been dominated by independent truck owner/operators. By the end of the 1980s most Swedish forest companies had also outsourced the majority of their operations. Wood supply groups are therefore, primarily asset-free organizations, without ownership of either harvesting or transport machinery. The basic role of the wood supply group is to manage the external material flows between the wood supplier and buyer. In other sectors this type of service provision is characterized as third part logistics provisions (TPL). Wood supply groups, however, have a primary function of wood trade. For this reason we include with a short review of the TPL literature in other sectors in order to find relevant concepts and theories for application in the forest sector.
An early definition of third part logistics (TPL) providers is given by Shapiro and Heskett [18]: An agent middlemen in the logistics channel who enters into a temporary or longer term relationship with some other entity in the logistic channel." A more focused version is given by Murphy and Poist [12]: "a relationship between a shipper and third party which, compared with basic services, has more customized offerings, encompasses a broader number of service functions and is characterized by a longer-term, more mutually beneficial relationship." Berglund [6] makes a similar statement; "A TPL provider is a company that for external clients manages, controls and delivers logistical operations."
For the purpose of this article the TPL provider and concept can be defined as the following: An external organisation which takes over the responsibility for parts of the external material flow between a company's supplier and customers. Hence, a TPL provider is the company that takes over the responsibilities for parts of another organisation's external material flow. The company which outsources parts of its external material flow to another entity uses the TPL concept.
Berglund [7] describes three major waves of entrance to the TPL branch. The first wave, occurred in the early 80:s by companies who are today called traditional logistics service providers (ASG, Frans Maas and British Exel) and started by offering structured TPL services. These companies originated from warehousing, transport and forwarding businesses. The second wave, took place in the early 90:s, when network players (DHL, TNT, UPS) initiated significant TPL-activities. The second wave differs from the first wave in that it had greater information technology (IT) capability, a knowledge of the roles of the player in the system, and skill and experience in transport business. The third wave, starting in the late 90:s, contained players with skills in IT, consulting and/or financial skills. These three waves show a gradual shift from asset-based to skill- or system-based players, but transport and warehouse activities still constitute the dominant part of the TPL services [7].
The main reason why companies choose to use TPL is to focus on core competence, thereby improving service to customers [20, 19, 16]. The TPL name, however, may cause some confusion; many companies call themselves TPL providers even though they are offering only transport services. The difference between the two is that traditional transporters execute single functions such as transport or warehousing only. TPL providers, on the other hand, execute and coordinate the multiple activities towards a stated purpose [7, 17]. The TPL concept correctly describes many of the functions typically included in a wood supply group's responsibility where ensuring a efficient and precise flow of customer-specific log dimensions and qualities characteristics at competitive prices is their core activity.
TPL and the Customer Service Perspective
Porters theory of competitive advantage [14] outlines three different kinds of competitive strategies; cost leadership, focus and differentiation. For companies producing bulk goods, such as the forestry sector, cost leadership and differentiation are typical. Porter later presented the Value Chain concept [15] where he outlined the core activities which exist in every company and which the company must manage and effectuate in the most efficient way possible. These activities are arranged from raw material procurement (left side of chain) to final product delivery (right side of chain). Porter notes that the greatest increases in value are found on the right side of the chain. The activity farthest to the right of the value chain is customer service. In the context of Porter's strategy and value chain theories and we can see that TPL services represent a differentiation strategy at the high end of the value-added chain.
Offering TPL service is therefore more a strategic than an operative choice. Sohal et al. [20] shows that decisions concerning TPL concept are now taking place higher up in the company structure than in earlier surveys. Companies are now committing TPL providers in increasingly different parts of their supply chain. A consequence of the increasing number of contacts with different TPL providers is the development of a socalled facilitator role for TPL services. These may be large companies or asset-free organizations who will be the only contact between the customer and different TPL providers offering different kind of services. This development helps ensure that the services' value-added will remain undisturbed by the use of multiple providers.
Later Research On TPL Provision
In this section two of the latest dissertations 7, 3] on TPL providers are reviewed. The reasons why these particular two are chosen are that they are the most recent dissertations from the Nordic countries and that the authors have looked into the TPL provider perspectives. Earlier research has mostly looked into the buyers of TPL services.
Berglund [7] investigated strategic positioning among active TPL providers. He did it by studying both 21 large TPL providers and 53 TPL buyers. The aims of the dissertation were:
1) to see if the TPL industry could be strategically segmented into different positions or strategic groups, and
2) to see if the TPL provider had started to position themselves.
According to Porter, the earlier a company defines its strategy the likelier it will survive in a mature market _ i.e. when competition gets tougher. Berglund developed a managerial model for the TLP provider's choice of strategy and differentiated two different strategic groups: providers of standard services and those providing more complete solutions.
The study concluded that TPL providers who already had high operational efficiency should offer standard services. Providers with well-developed operational skills were normally the providers which originated from traditional transport sector. They should continue to offer these kinds of services, i.e. simple service to many customers, in order to stay efficient. The other group, the solution provider, should have a conceptual focus on their offered services in order to stay effective. Their background for service providers was more varied, originating from different sectors. Berglund came to the conclusion that this group was most successful in offering their services to a few customers and being flexible in the provision of these services. Overall, the development of TPL strategies depended upon whether the provider's customers had logistics management as core activity or not.
Bask [3] also examined TPL strategies. The aim of Bask's dissertation was to investigate how TPL providers could give their customers a value-added service in the most efficient way. In this perspective, Bask defines value-added in logistics services as that service which enhances the performance of the service purchasing companies. Efficient service according to Bask is when an optimum trade off is made between service and quality on one side and transaction and production costs on the other side.

Display large image of Figure 2
Figure 2. Service matrix developed by Apte and Vepsäläinen [1] and Mäkelin and Vepsäläinen [13].
A definition of optimum service by Coyle et al. [8]:
"The optimum service level examines the trade off between the marginal cost and profitability of providing various service levels with the optimum service level being the one that maximizes the difference between revenue and the service costs."
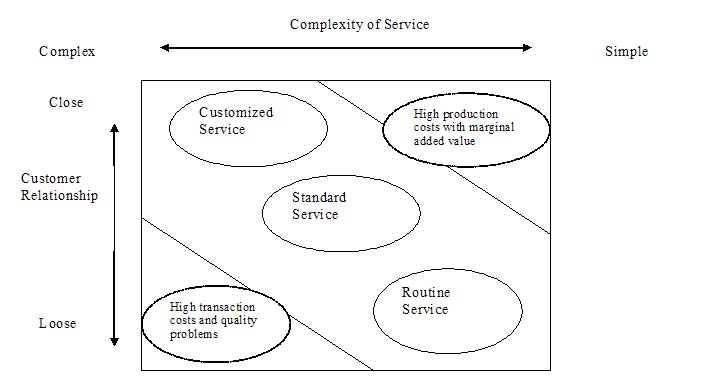
Bask builds on a generic service matrix used by Apte and Vepsäläinen [1] and Mäkelin and Väpsäläinen [13]. This matrix was used earlier to develop theories explaining efficient service divergence. Dimensions in the service matrix are the complexity of service given and the type of customer relationship. Within this matrix three different classes of service are defined (see figure 3). These include routine, standard, and customized. The service matrix shows which of the three levels of service is optimally suited to the different relationships between providers and buyers. Optimally, customized services are only offered in close customer relationships and routine services are offered for loose relationships.
Divergence of Physical Transfer Services
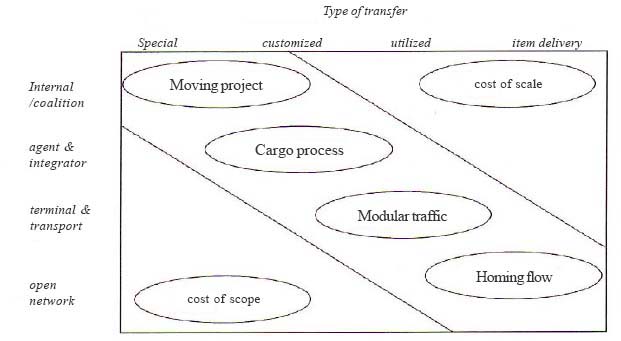
Laine et al. [11] developed a service matrix for examining the divergence in physical transfer services. This was made in order to position practices with respect to efficiency and future development needs. The basic structure is similar to the generic service matrix shown in Apte and Vepsäläinenen [1] and earlier versions have been shown in Bask and Laine [4], Bask and Vepsäläinen [5] and Laine et al. [10]. In the current model the y-axis describes the type of channel (internal and coalition, agents and integrators, terminal and transport operations, open network) and the x-axis describes the types of transfer (special, customized, unitized, item delivery). Within this framework four optimum levels of generic transfer solutions service are classified. These include:
- moving project (for special transfers in internal channels)
- cargo process (for customized transfer in agent/integrator channels)
- modular traffic (for unitized transfer in terminal and transport operations)
- homing flows (for item delivery in open networks)
On the other end of the spectrum of service solutions, item delivery has item shape uniform enough to allow simple transfer and handling in mass volumes. In this case it is just necessary to specify destination. The open network is open for any party to join, however requires adoption of standard protocol with a variety of technologies with high connectivity with wide geographical coverage. Allocation of resources is done via market mechanisms and delivery performance and times are based on probabilities. In the this framework low efficiency can be caused by, for example, item delivery being handled by internal/coalition or special transfers being handled by open networks.
According to Laine et al. the divergence of physical transfer services has been driven by two trends:
- the focus on satisfying (initially low volume) new customer needs
- increasing efficiency in established (high volume) mature markets by automation
To sum up, It is in the trend of focusing on customer needs that TPL has arisen. New technological developments combined with organizational innovations have made linking of enterprises easier. This has provided an opportunity to offer different services through networking that has accelerated the trend of service divergence.
METHODS
The service matrix is a useful tool applicable to a number of sectors. Applying this tool requires a thorough understanding of service types and complexity within each sector. In the case of the forest sector there are in theory three alternative origins for further service divergence: the wood supply group, the harvesting service provider and the transport service provider. In this study we focus on the service divergence potential for the transport service provider. This, however, requires a mapping of service goals, decisions and decision support processes from both service buyer and provider.
For several decades attitudes have been the dominating concept in explaining human decision behaviour. In this context attitudes may be defined as "a learned predisposition to respond in a consistently favourable or unfavourable manner with respect to a given object" [9]. This definition emphasizes that attitudes are learned and therefore the behaviour of both service buyers and providers can be explained by their attitudes and perceptions. These assumptions are the foundation for the methods used in this study.
The population sample for this study was taken from three different respondent groups: two groups of transport service buyers (forest companies and forest owner associations) transport service providers (transport associations coordinating independent truck owner/operators). In reality, all three respondent groups buy services from independent truck owner/operators. It is, however, only the transport organizations who are identified as external providers of logistics services.

Display large image of Figure 3
Figure 3. The physical transfer service matrix developed by Laine et al. [11].
Larger forest companies, forest owner associations and round wood transport organizations were contacted in both southern and northern Sweden. A small selection of transport administrators were first interviewed to establish the relevant dimensions of transport service goals, decisions and decision support processes in planning of operations. Interview responses were recorded for later review and registration of themes and formulations. A short questionnaire was developed based on these interviews, tested and then distributed to a larger sample. Questionnaire responses were collected via telephone interviews. For this reason the questionnaire response was quite high and the risk for non-response bias is minimized. The respondents were asked, in the questionnaire, to express their agreement or disagreement with key formulations taken from the interviews. The questionnaires had 4 main themes; goals, decisions, decision support and problems. Up to 10 formulations were included per theme. The respondent scores were given on a scale of 1 to 5 where 1 represents full disagreement and 5 full agreement. The questionnaires were therefore used to quantify the proportion of the population which represented the different points of view. The sample for the questionnaire included 20 transport administrators. Two-thirds of these were service buyers and one-third service providers. Because of the low number of major forest companies (only 5 with at least 1 million ha/company) and forest owners associations (5) in Sweden some companies and associations were represented by multiples respondents. Company identity, however, is anonymous in all cases. Respondent scores were registered in EXCEL spreadsheets for later analysis and presentation.
Most of the results are presented as descriptive statistics indicating the median score per formulation for each respondent group. Where variation in respondent scores was found, the scores for different formulations could also be tested for correlations between respondent goals, decisions and problems with the MINITAB statistical analysis program. In those cases with a significant correlation is shown, the strength of the correlation is quantified with the Pearson correlation coefficient.
Each respondent stated the number of trucks being used by the company. These were put into three classes:
Table 1. Distribution of respondents per class of organization size (no. of trucks administrated).
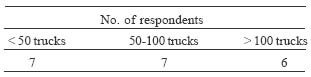
The respondents were evenly distributed between these classes. Most forest owners associations respondents, however, were in the classes 0-50 trucks while most forest company respondents were in the class 50-100 trucks. Transport organizations respondents were evenly distributed between the 50 to 100 and >100 truck class.
RESULTS
The results of the questionnaire are presented according to the main themes (Figure 4). First, the results for each theme are presented. Then the correlations between the different aspects of each theme are used to structure the relations between company goals, decisions and decision support routines.
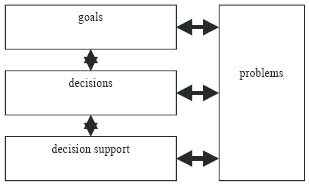
Figure 4. The four themes of the questionnaire issued to transport administrators.
Goals
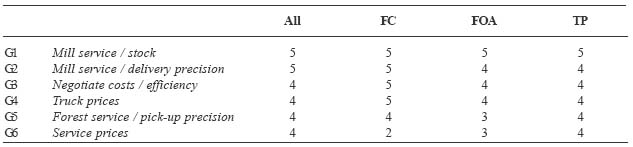
The questionnaire mapped 6 goals which were common for transport administrators of both service buyers and providers. When asked if these were included in their primary goals only 1 of these 6 received a median score of 5 (full agreement) for the whole population as well as for each of the three groups. This was:
G1 Mill Service stock:
"to supply the mills with suitable levels of safety stocks"
The goal with the second highest score (also a median of 5 for the whole population, but not for every group) was:
G2 MillService/delivery precision:
"to give a high service level in terms of delivery
precision"
In a follow-up question, the respondents were asked to specify their most important goal for transport planning. 67% of respondents specified goal 1. Twenty three percent of respondents using more than 50 trucks and 57% of respondents using less than 50 trucks specified goal 2, respectively.
Four other goals had a median score of 4 for the whole population. These were:
G3 costs/efficiency:
"to reduce costs by increasing transport efficiency" and
G4 Negotiate truck prices:
"to negotiate good prices with truck owner/operators"
G5 Forest Service /pick-up precision:
"to give a high service in terms of pick-up precision" and
G6 Negotiate service prices:
"to negotiate good prices for transport services"
Some variation in emphasis on the different could be observed for each group (Table 2). Transport organizations had a median score of at least 4 on all goals. Forest companies also had median scores of at least 4 for most goals except for a score of 2 on goal 6 (service prices). Forest owners associations laid least emphasis (median score of 3) on goals 5 (forest service / pick-up precision) and 6 (service prices).
Table 2. Median respondent scores for transport administrator goals (FC=forest company, FOA=forest owner association, TP= transport service provider).
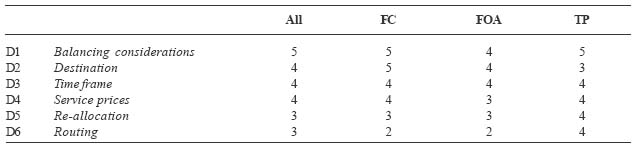
Decisions
The questionnaire mapped 6 decisions which were common for the transport administrators of service buyers and providers. When asked about the relative importance of individual decisions, the only decision which received a median score of 5 (full agreement) for the whole population was:
D1 Balancing considerations:
"planning, based on balancing consideration to
customer service and own resources"
The decision with the second highest score was:
D2 Destination:
"determining the destination of volumes and assortment"
The highest score for D2 was given by forest companies (5), followed by forest owners associations (4) and transport companies (3). The next most important decisions were:
D3 Time frame:
"determining the time frame for deliveries"
D4 Service prices:
"pricing of transport services"
for which all three groups gave a median score of 4. The next decision received a median score of 3:
D5 Re-allocation:
"re-allocation of resources when required"
The decision receiving the lowest median score (3) was:
D6 Routing:
"routing of available transport resources"
Some variation was found in emphasis that each group put on individual decisions (Table 3). Both groups of service buyers gave scores of 2 and 3 to decisions 5 (re-allocation) and 6 (routing), respectively. Service providers placed a score of 4 on both decisions 5 and 6 while placing their lowest scores (3) on decisions 2 (destination) and 6 (routing).
Table 3. Median respondent scores for transport administrator decisions (FC=forest company, FOA=forest owner association, TP= transport service provider).
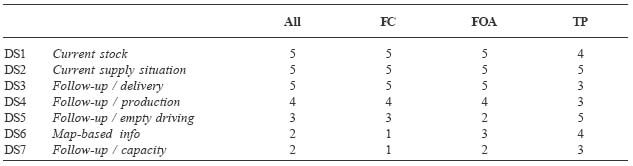
Decision Support Processes
The questionnaire mapped 6 decisions support processes which were common for the transport administrators of service buyers and providers. When asked if a particular decision process was the respondents' most important, there were three processes which received a median score of 5 (full agreement). These were:
DS1 Current stock
"current stock volumes at the forest and mill"
DS2 Current supply situation
"current supply situation during extreme periods"
DS3 Follow-up/delivery
"follow-up of the round wood delivery plan and
transported volumes"
The median response from transport organizations, however decreased from 5 for DS3 (delivery follow-up) to 4 for DS1 (current stock) to 3 for DS2 (current supply situation).The next process (DS4) was follow-up of mill production plans with a median score of 4.
DS4 Follow-up/production
"follow-up of the round wood consumption plan at
the mill"
The final three processes were primarily transport related with a median score of 3 or below.
DS5 Follow-up/empty driving
"follow-up of empty driving"
DS6 Map-based info
"map-based of pick-up and delivery locations"
DS7 Follow-up/capacity
"follow-up of trucks capacity utilization"
In contrast to service buyers, service providers placed lower scores (Table 4) on DS3 (follow-up / delivery) and DS4 (follow-up / production) and higher scores on DS5 (follow-up / empty driving), DS6 ( map-based info) and DS7 (follow-up capacity).
Table 4. Median respondent scores for transport administrator decision support processes (FC=forest company, FOA=forest owner association, TP= transport service provider).
Goal-Decision-Decision Support Correlations
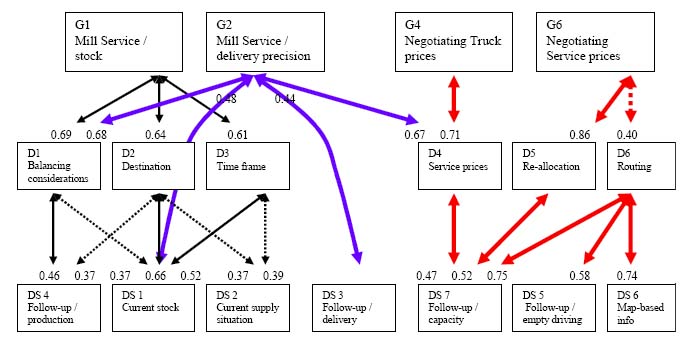
The scores of different goals, decisions, and decision support processes were analyzed for correlations between the three measures. The correlations were then used to develop a model of which structures of goals, decisions and processes were considered important by the respondents (Figure 5).

Display large image of Figure 5
Figure 5. The structure of correlated respondent scores between transport goals (G1-G6), decisions (D1-D6) and decision support (DSI-DS7). Significant correlations at the p<0.05 level are shown by solid lines. Significant correlations at the p<0.10 level are shown by the dashed lines. The numbers at the end of the arrows are the Pearson correlation coefficients.
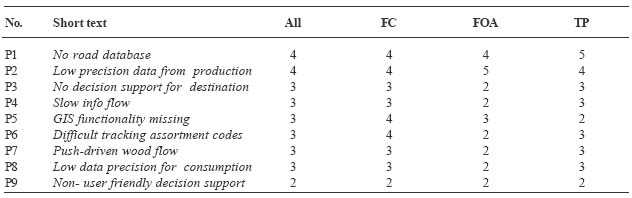
Current Planning and Control Problems
The questionnaire mapped eight common problems with transport planning and control, and the final part of the questionnaire focused on these. Only two problems received a median score of 4 or above:
P1 No road database:
"no road database with information on trafficiability etc"
P2 Low data precision / production:
"low quality data on forest and harvesting production"
The next two problems with slightly lower overall scores (3) were:
P3 No decision support / destination:
"no suitable decision support for optimization of
destination"
P4 Slow info flow:
"the flow of information for decision support is too slow"
After this came:
P5 GIS functionality missing:
"GIS functionality not included in our system"
P6 Difficult tracking assortment codes
"difficulty in tracking assortment codes from forest to
industry"
P7 Push-Driven flow:
"the sector has a push-driven flow from the forest"
P8 Low data precision / consumption prognosis
"the mills have low precision in the production
prognosis"
All four problems (P5-P8) had a median score of 3. A ninth problem was also identified during the interviews; however the median score for this was only 2.
P9 Decision support not user friendly
"our decision support system isn't user-friendly"
Within groups, a few deviations were noticed when comparing the scores given on different questions within individual groups (Table 5). Transport organizations placed their highest score (5) on problem 1 (no road database) and second highest score (4) on problem 2 (low precision data for production). Forest companies placed relatively high scores (4) on problem 5 (GIS functionality missing) and 6 (difficult tracking assortment codes along the supply chain). Forest owners associations placed their highest score (5) on problem 2 (low precision data for production) and low scores (2) on problems 3, 4, 6, 7 and 8.
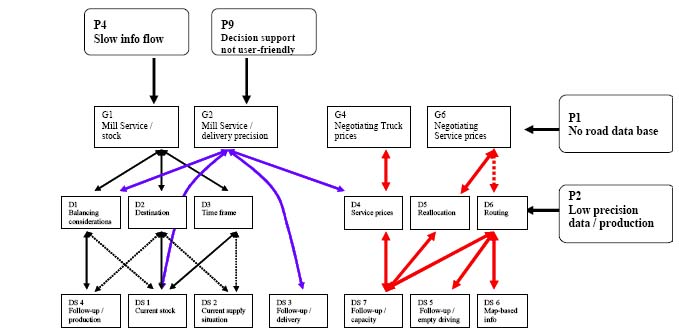
A correlation analysis was conducted between the importance of the different problems and the importance of the different goals and decisions. Four important correlations were found and are shown in Figure 6. Slow information flow (P4) was found to be an important problem for those respondents placing high importance on the goal of mill stock management (G1). Non-user friendly decision-support (P9) was found to be an important problem for those respondents placing high importance on goal of high delivery precision (G2). No road data base (P1) was found to be problem for those respondents aiming at negotiating service prices (G6). Low precision data for forest production (P2) was found to be a problem for those who considered routing decisions to be an important part of their work (D6).
Table 5. Median respondent scores for transport administrator planning and control problems (FC=forest company, FOA=forest owner association, TP= transport service provider).

Display large image of Figure 6
Figure 6. Some significant correlations between respondents' planning and control problems and their service goals and decisions.
DISCUSSION
The study shows that the dominant focus for suppliers and transporters is the service levels to receiving mills. Mill service is specified in two ways. The highest ranked service focus was defined in terms of maintaining a suitable stock level (G1). The second highest ranked focus was defined in terms of delivery precision (G2) (delivered volume in relation to the planned volume for the period). Service focus on delivery precision was most common for smaller organizations (< 50 trucks). This may be a result of their limited effect on wood flow. For transport providers, a dominant focus was negotiated for service prices (G6). This is logical goven the primary importance of service prices for their profitability. The primary decisions for transport planning in the studies population are based on balancing considerations to customer service and own resources (D1). After this the determination of round wood destination (D2) and the time frame for delivery (D3) were the foremost decisions for the population as a whole. The situation was slightly different for service providers where service pricing (D4) re-allocation of resources (D5) and routing (D6) all received high scores. These correspond well to the higher scores given by service providers to relevant decision support routines such as follow-up / capacity (DS7), map-based info (DS6), and follow-up / empty driving (DS5).
The overall ranking of the different goals, decisions and decision support processes may be explained by the relative proportions of service buyers vs. providers. However it is also a result of the selection of respondents within the firms representing buyers and providers. Respondents were transport administrators (aka forwarders) who considered only their personal position, not that of fleet managers with responsibility for operational decisions. The results must be interpreted in this in mind. The formulations may also be perceived slightly differently by the different groups. An example of this is the issue of service pricing, where service buyers and providers will have different goals for agreed prices (low costs vs. high revenues). The overall structure in Figure 5 gave the opportunity to better group the different decisions and supporting processes according to their respective goals. Both the rankings and correlations helped formulate this synthesis. A parallel ranking of goals and decisions (for buyers and providers) is apparent and the correlations further support the basic logic in the structure from left (buyers) to right (providers).
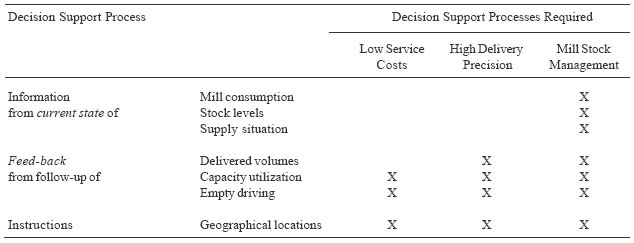
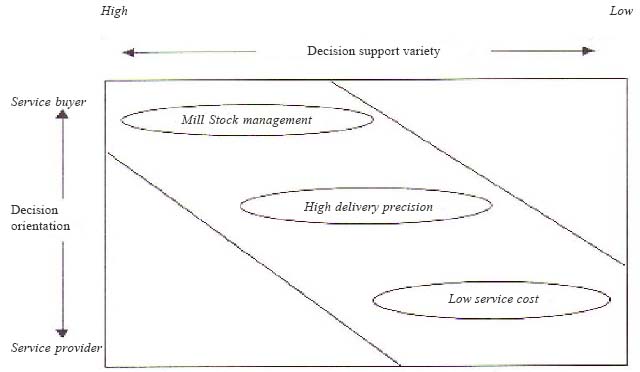
Based on the synthesis in figure 5, a service matrix for round wood transport is suggested below (Figure 7). It is structured according to the principles underlying the generic service matrix (Figure 2) developed by Apte and Vepsäläinen [1] and Mäkelin and Väpsäläinen [13]. An important assumption in the development of the generic matrix is the goal of ascertaining efficient service levels based on different levels of provider competence. The matrix presented for divergence of physical transfer services (Figure 3) developed by Laine et al. [11] could be interpreted as being even closer related to the suggested round wood matrix. The physical transfer matrix, however, was motivated by two specific trends: increasing efficiency in established, high volume markets and satisfying new customer needs of initially low volumes. In the case of round wood transport, low volume markets do not exist and accordingly neither do the demand for the highest levels of service in figure 3. The increasing service ambitions shown along the diagonal of figure 7 are therefore quite modest compared to the physical transfer matrixes, but the underlying principle is the same with the orientation of service decisions on the y-axis and the increasing variety of decision support functions to attain these decisions on the x-axis.
The suggested round wood matrix builds on existing demands to the service buyer and provider organizations that are dependent on the level of service expected by their high volume customers at the mill. The customized level is close to that of integrated forest companies that are more closely linked to the needs of their own mills and require greater control over their supply chain. The standard level is close to that of forest owner associations that in many cases are only expected to deliver an agreed monthly volume. In those cases where a transport organizations aims to increase service divergence they become subject to increasing requisite variety of decisions and decision support processes. Typical combinations are shown below (Table 6).
Table 6. An example of requisite variety of decision support processes for varying levels of service.
Impediments to Service Divergence
The problems associated with the different parts of the service hierarchy (Figure 6) are the same as those which will be met as transport providers attempt to advance their service to the specified levels (Figure 2). These include shortfalls in road data (P1 correlated to D1), low precision in production data (P2 correlated to D6), non-user friendly decision support (P9 correlated to G2) and slow information delivery (P4 correlated to G1).

Display large image of Figure 7
Figure 7. A suggested service matrix for round wood transport ranging from routine service (low service price) to standard service (high delivery precision) to customized service (mill stock management).
The correlation between no road data base (P1) and negotiating service prices (G6) is fundamental. Exact transport distances and road conditions are basic assumptions for all aspects of transport planning and payment. A national database for the Swedish road network (public and forest roads) is now under construction.
The correlation between problems with low precision in production data (P2) and basic operation decision of routing (D6) is also fundamental. Successful vehicle routing routines rely on accurate operational data such as the daily level of roadside inventories per supply node. This correlation indicates that this feed-back data is not yet good enough. Current routines for reporting of roadside inventories are based on reports of harvested volumes at roadside and transported volumes to the mill. Both of these reporting stages have varying frequency and current routines revise the remaining balance only once per day.
The correlation between slow information delivery (P4) and mill service in terms of stock level (G1) is important to observe. Reaching higher levels of service requires that all decision support processes for feed-back and current states from the whole supply chain are available. In reality, reaching this level of service divergence requires free and frequent delivery of all information as well as a control response to react to disturbances. Even the more moderate service ambition of high delivery precision (G2) with a modest information requirement (DS3) requires more user-friendly decision support for broad application.
These conclusions are based to a large degree on the use of correlations to diagnose impediments to divergence. However caution should be used when interpreting the presence or absence of significant correlations. A significant correlation indicates that respondents' rankings of certain goal and decision aspects, or decision to decision support routines coincide. This type of analysis requires variation in the scores of both questions in order to test for co-variation between them. If, for example, all respondents give an importance score of 5 on two questions, there is no variation on which to base a statistical test. For this reason it may be statistically feasible to show a correlation between aspects for which there were medium-high scores and infeasible where all respondents were in agreement that two aspects were of highest importance. However, given that the identification of the above impediments are correct, the actual service divergence is dependent on a successful removal of these and implementation of the requisite variety of decision support to attain the respective service goals.
CONCLUDING REMARKS
Bask [2] defines TPL as: "relationship between buyers and sellers and Third Party Logistics companies, where logistics services are offered from basic to customized ones with shorter or longer term relationship, with the aim of efficiency". An earlier TPL definition by Wood et al. [21], highlights an important aspect; The farming out of all a firm's logistics activities to another firm that then manages them, without taking an ownership position in the inventories." A later definition by Berglund [7] also highlights the non-ownership position in TPL; "Organisations' use of external providers, in intended continuous relationships bound by formal or informal agreements considered mutually beneficial, which render all or a considerable number of the activities required for the focal logistical need without taking title." These definitions emphasize efficient services without taking an ownership position. The current TPL concepts are still limited, when compared to the wood supply group concept where the trade function is central.
The main issue of service divergence in the suggested matrix for round wood transport is supply chain control. Overcoming the indicated problems for present service level as well as divergence to higher levels requires increased variety of planning, execution and control. These developments represent considerable investments by service providers. Efficient service requires an economically optimal trade-off between these increased costs for increased control. This leads us to a number of important questions:
1) How much control is enough control?
2) What are the factors influencing this trade-off?
3) What is an optimal trade-off between cost and control?
AUTHOR CONTACT
Caisa Hedlinger can be reached by e-mail at --
caisa.hedlinger@sca.com
REFERENCES
[1] Apte, U.M., and A.P.J. Vepsäläinen. 1993. High tech or high touch? Efficient channel strategies for delivering financial services. Journal of Strategic Information System, March, pp. 39 _ 54.
[2] Bask, A. 1999. Third Party Relationships in Logistics Services, Helsinki School of Economics and Business Administration, Licentiate Thesis, Helsinki.
[3] Bask, A. 2001. "Relationships among TPL providers and members of supply chains _ a strategic perspective", The Journal of Business and Industrial marketing, Vol. 16, No. 6 p 470-486.
[4] Bask, A. and J. Laine. 2000. Coordination of container transport chains. Ministry of transport and communications 46/2000, Finland (in Finnish).
[5] Bask, A. and A.P.J. Vepsäläinen. 2001. An analysis of transport services. Presentation in the Nordiska Forskarmötet I Materialadministration, NOFOMA 2001, Reykjavik, Iceland, June 11-12.
[6] Berglund, M. 1997. Third-Party Logistics Providers - Towards a Conceptual Model, Dissertation from the International Graduate School of Management and Industrial Engineering, No. 7, Licentiate Thesis, Linköping Studies in Science and Technology, Thesis No. 642, Linköping University, Sweden.
[7] Berglund, M. 2000. Strategic Positioning of the Emerging Third-Party Logistics Providers, Linköping Studies in Management and Economics, Dissertation No. 45, Linköping University, Sweden.
[8] Coyle, J.J., E.J. Bardi, and C.J. Langley. 1992. The Management of Business Logistics. West Publishing Company.
[9] Fishbein, M. and I. Ajzen. 1975. Belief, attitude, intention and behaviour. An introduction to theory and research. Addison-Wesley.
[10] Laine, J.T., A.P.J. Vepsäläinen, and A.H. Bask. 2002, An analysis of transfer services, Presentations in the Informs 2002, San Jose, CA, November 17-20.
[11] Laine, J.T., A.P.J. Vepsäläinen, and A.H. 2003, An analysis of physical transfer services. In: Juga, J. (ed.) NOFOMA 2003, Striving for leading edge logistics, Oulo, Finland, June 12-13.
[12] Murphy, P.R. and R.F. Poist. 2000. Third party logistics, some user vs. provider perspectives. Journal of Business Logistics, Vol. 21, Issue 1.
[13] Mäkelin, M. and A.P.J. Vepsäläinen. 1989. Service strategies _ developing organizations and information technology (in Finnish), HM and V Research Oy.
[14] Porter M. 1980. Competitive Strategy _ Techniques for Analyzing Industries and Competitors. New York: The Free Press.
[15] Porter M. 1985. Competitive Advantage _ Creating and Sustaining Superior Advantage. New York: The Free Press.
[16] Pruth, M. and P. Rosén. 2000 Effektiv samordning av varuflöden, KFB-rapport 2000:9, Stockholm (in Swedish).
[17] Razzaque, M.A. and C.C. Sheng. 1998. Outsourcing of logistics functions: a literature survey, International Journal of Physical Distribution and Logistics Management, Vol. 28, No. 2, pp. 89-107.
[18] Shapiro, R.D. and J.L. Heskett. 1985. Logistics Strategy: cases and concepts, West Publishing Co., Minnesota, 602 p.
[19] Sink, H.L. and C.J. Langley Jr. 1997. A managerial framework for the acquisition of third-party logistics services. Journal of Business Logistics, Vol. 18 Issue 2, pp. 163 _ 188.
[20] Sohal, A.S., R. Millen, and S. Moss. 2002., A Comparison of the use of third-party logistics services by Australian firms between 1995 and 1999. International Journal of Physical Distribution and Logistics Management, Vol. 32, No. 1, pp. 59 _ 68.
[21] Wood, D.F., A. Barone, P. Murphy and D.L. Wardlow. 1995. International Logistics, Chapman and Hall, USA.