Vol. 16, No. 2 July 2005
Matthew W. Veal
University of Kentucky
Lexington, Kentucky, USA
Steven E. Taylor
Auburn University
Auburn, Alabama, USA
Robert B. Rummer
USDA Forest Service
Auburn, Alabama, USA
Randy R. Raper
USDA Agricultural Research Service
Auburn, Alabama, USA
The authors are, respectively, Engineer Associate, Professor and Department Head, Biosystems Engineering, Project Leader, and Agricultural Engineer, University of Kentucky
ABSTRACT
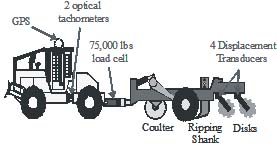
In this field study, data were collected to determine power requirements required by a trailing site preparation plow and the magnitudes of dynamic forces experienced by a plow during normal operation and during impact with stumps or other obstructions. Drawbar pull data were collected from five different tillage treatments on a recently harvested loblolly pine (Pinus taeda) site in central Alabama. The five treatments were: 1) a coulter, ripping shank, and four bedding disks; 2) a coulter, ripping shank, and two bedding disks; 3) a coulter and ripping shank; 4) a coulter alone; and 5) a ripping shank alone. A 330 kN [75 000 lb] capacity tension load cell was used to measure the drawbar load, a GPS receiver recorded tractor speed, four direct current displacement transducers (DCDT's) monitored the depth of the disks, and two optical tachometers measured the speed of the tractor's front and rear drive shafts. Each treatment produced significantly different drawbar loads (to alpha levels less than 0.001). The resulting mean loads were 46.0 kN [10 300 lb], 33.5 kN [7530 lb], 31.5 kN [7080 lb], 15.8 kN [3560 lb], and 43.4 kN [9760 lb] for treatments one through five, respectively. Maximum recorded drawbar load during a collision with a stump was 338.9 kN [76 188 lb].
Keywords: site preparation, drawbar force, forestry plow, tillage.
INTRODUCTION
Mechanical and chemical site preparation operations in the Southeastern United States have been scaled back in recent years in an effort to reduce the costs of forest regeneration. The greatest benefits of mechanical site preparation are increased tree seedling growth and survivability due to improved microsite conditions after tilling the soil. Other benefits include reduction of soil compaction, control of competing vegetation, and modification of site moisture conditions (e.g. raised beds for better seedling survival in wet sites) [9]. Many of the recent reductions in site preparation activities have focused on tillage operations as forest landowners struggle to determine how tillage fits into their silvicultural prescription.
Compaction of subsoils is a key factor in the reduced production of agricultural crops and wood fibre. This form of compaction is particularly troublesome as it is persistent and difficult to remedy. [10] Soils run the greatest risk of becoming excessively compacted while under heavy axle loads at times of high moisture content. The number of vehicle passes, the tire dimensions, and the existence of residual compacted layers (i.e. plow pans) will influence the degree of compaction that will occur on a forest soil. [5, 6]. A study in Canada found that yields associated with corn, soybeans, and wheat were significantly reduced for 10 years following the construction of a pipeline in the vicinity of the fields. [4].
While the results and cause of soil compaction have been well documented, there are still questions regarding the amount of tillage needed to alleviate this problem. The prevailing question revolves around the dimension and number of implements that are needed to return the soil to the desired state. Since the benefits of tillage are not always readily apparent, it has become increasingly difficult for some forest landowners to justify tillage expenditures near $250 per hectare on forestry sites. Tillage appears to benefit tree survivability and growth through the reduction of compacted soils on a site.
Revitalization of tillage operations could occur if tillage systems were developed that increased productivity, reduced costs, and produced favorable soil conditions that were beneficial to the production of wood fibre. In order to improve tillage systems, there are many questions that need to be answered from the field of engineering and from the standpoint of tree physiology. From the tree physiology standpoint, it is important to understand what soil conditions are needed to optimize the production of wood fibre and what role tillage has in producing these conditions. From the engineering position, a tillage tool is needed that will create the optimal soil conditions for tree growth and withstand the rigors of forestry site preparation. The first step in the engineering solution is focused on gathering numerical data, such as power requirements for existing tillage implements. The numerical data can be used to make decisions about proper tractor-plow combinations, to improve the design of existing plows, and to determine the feasibility of using multiple-row plows. Through reduction of application costs or increasing the capacity of the plow implement, the costs associated with mechanical site preparation can be significantly reduced. This paper focuses on the collection of drawbar pull data, so the forces experienced by the various tillage implements found on a forestry site preparation plow may be quantified.
As a site preparation tillage implement is pulled through uncompacted and compacted soil, stumps, rocks, and logging debris, forces are created that must be overcome by the site preparation prime mover or tractor. The drawbar force is the reaction force that the tractor generates in order to move the plow through a forest soil. Drawbar power is a function of tractor speed and the drawbar force. Previous studies that measured the drawbar force for towed mechanical site preparation equipment have suggested that a tractor or prime mover would need to generate 61 kW [93 hp] to pull a three-row Bräcke patch scarifier [2]. In a similar study, the average drawbar power of a 10 700 kg [23 500 lb] three-row scarifier, consisting of six barrels, was quantified as 80 kW [107 hp] [3]. Results from this study indicated that the weight of the implement appeared to affect the drawbar force more than the soil texture and amount of surface debris. Typically, a scarifier disturbs only the top of the soil surface, whereas a plow equipped with a subsoiling shank may be disturbing soil down to a depth of 610 mm [24 in]. Also, these studies [2, 3] only measured average drawbar loads on a single silvicultural treatment, and did not take into account how interaction between cultivation implements can affect drawbar load. Drawbar force data is available for disk harrows used in forestry site preparation as well [1].
It has been reported that the power consumption of a single subsoiling shank set at a depth of 410 mm [16 in] is in a range from 30 kW to 40 kW [40 to 50 hp] [7]. It should be noted that the composition of the soil and the depth of the ripping shank will greatly influence the drawbar force value. When compared to forestry implements, the tillage tools used in agriculture are smaller and generally work in environments with reduced amounts of debris. Therefore, it may be assumed that forestry tillage tools consume greater amounts of power than similar agricultural implements. In agricultural research on the power consumption of disks [7], researchers generally conclude that drawbar force is a function of implement weight. However, this assumption is probably not applicable to forestry plows since they typically use only two or four disks in combination with other tillage implements, whereas agricultural disk plows are often composed of long gangs of numerous disks. One agricultural tool (the levee plow) produces a soil condition similar to forestry bedding plows used in this study. These levee plows utilize a series of angled disks to build levees in rice fields, similar to the beds created by forestry plows. The drawbar power requirement for a levee plow ranges from 55 kW to 120 kW [80 to 160 hp] when working in rice fields [8].
OBJECTIVES
The goal of this research is to provide forestry site preparation plow designers with information that can be used to produce more efficient and cost effective forestry tillage systems. The particular objectives of this study were to:
1) Determine power requirements for pulling various tillage implements across recently harvested forest sites, and
2) Determine the magnitudes of dynamic forces experienced by a plow during normal operation and during impact with stumps or other obstructions.
EXPERIMENTAL METHODS
Equipment Description
The forestry site preparation plow used in this study was a Savannah Model 310 trailing subsoil plow. The layout of the Savannah Model 310 plow is as follows: a 1220-mm-diameter [48 in.] vertical coulter, a 76-mm-thick [3 in.] adjustable-depth vertical ripping shank, and four 910-mm-diameter [36 in.] "stump-jump" disks on the rear of the plow. The coulter is a sharp-edged disk that makes a narrow vertical cut in the soil prior to the cutting action of the ripping shank. The first set of disks behind the ripping shank mix the surface organic matter and soil together. The rear set of disks bed the soil to facilitate planting in wet areas. The "stump-jump" feature allows the disks to rise out of the ground when an obstacle is encountered and re-enter after the obstacle is cleared. Two hydraulic cylinders attached to the wheels allow the entire plow to be raised to facilitate transportation, avoid large obstacles, and establish plow depth. The plow used in this study weighed approximately 5400 kg [12 000 lb].
The prime mover used to pull the plow during this study was a SuperTrac SK-300 Forester rubber-tired site prep tractor. The SK-300 is equipped with a Caterpillar 3606 diesel engine. This engine provides the site prep tractor with 220 kW [300 hp] gross power and 200 kW [265 hp] flywheel power. The operating weight of the SK-300 is 18,000 kg [40 000 lb]. The site prep tractor was outfitted with 35.5 x 32 tires, giving the tractor a wheelbase of 3610 mm [142 in.] and a width of 3450 mm [136 in]. The tires were unballasted during testing. The tractor and plow combination are shown in Figure 1.
Figure 1 Supertrac SK-300 pulling a Savannah 310 trailing subsoil plow with coulter, ripping shank, and four disks in the ground.
Study Site
The study site selected for this experiment was located in southwestern Butler County, Alabama (Latitude 31o 36' 10" N, Longitude 86o 47' 24" W). The site was planted with loblolly pine (Pinus taeda) in the late 1960's and was clearcut in the summer of 2000. The harvesting operation was accomplished with a rubber-tired feller-buncher weighing 10,850 kg [24,000 lb] in conjunction with a rubber-tired skidder weighing 14,000 kg [31,000 lb]. The tillage tests were conducted along the edge of the study site in an area that was trafficked by each piece of harvesting equipment one or two times. There were no skid trails of significance or landing located in the area that draft force measurements were taken. An initial site preparation operation was completed in the fall of 2000. The site was sheared and raked using a Caterpillar D7 track-type tractor weighing 24,000 kg [53,000 lb] as the prime mover. This operation was completed in a single pass over the ground and left little logging debris on the site. The study was conducted on 1.4 ha [3.5 acres] located between windrows created during the raking operation and a recently planted loblolly pine plantation. The site was flat (less than 1% slope) and the average stump diameter was 500 mm [20 in].
The soil on the site was classified by the United States Department of Agriculture Natural Resource Conservation Service as a Luverne Sandy Loam, 1 to 5 percent slope. This soil consists of a brown sandy loam surface layer to a depth of 200 mm [8 in.], followed by a yellowish-red clay subsoil to a depth of 1500 mm [60 in.]. The soil had low organic matter, moderately slow permeability, and was well drained. The site index for this site was 90.
Experimental Setup
Five treatments were established in the testing program, each utilizing different combinations of implements on the Savannah 310 trailing subsoil plow. The first treatment, shown in Figure 1, had the coulter, ripping shank, and all four disks contacting the ground, (C+R+4D). The second treatment had the coulter, ripping shank, and two disks contacting the ground, (C+R+2D). The third treatment had the coulter and the ripping shank contacting the ground, (C+R). The fourth treatment had only the coulter contacting the ground, (C). Finally, the fifth treatment had only the ripping shank contacting the ground, (R).
A randomized completed block design was used to layout the experiment. The 1.4 ha [3.5 acre] site was divided into four blocks, 61 m [200 ft] long with a 38 m [125 ft] long buffer area between each block. Within each block, the treatments were randomly applied on rows spaced 3.6 m [12 ft] apart. Figure 2 provides a graphical representation of the experiment layout. Each of the five treatments was randomly assigned to a row within each block. The tractor operated in second gear for all the treatments. This gear selection corresponded to an average ground speed of 8.3 km/h [5.15 mph]. The ripping shank was set to a depth of 380 mm [15 in.] for all treatments involving the use of the ripping shank.
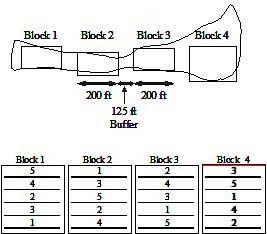
Figure 2. Placement of sampling blocks on the study site and assignment of the tillage treatments to these blocks.
A 330 kN [75,000 lb] capacity tension load cell was placed in a linkage between the site prep tractor drawbar and the hitch on the Savannah plow. The linkage was fabricated to prevent shear loading and torsion on the load cell during operation. The voltage output from the load cell was proportional to the drawbar pull exerted by the site prep tractor. An example plot of drawbar force versus time for the coulter, ripping shank, and four disks treatment used in Row 5 of Block 2 can be seen in Figure 3.
Direct-current displacement transducers (DCDT's) were attached to the four jump arms controlling the depth of the disks at the rear of the plow. The DCDT's monitored the position of the disks and indicated when the jump arms allowed the disks to withdraw from the ground during a collision with an obstacle. Two optical tachometers were used to monitor the revolutions of the drive shafts leading to the front and rear axles. A GPS unit was placed on the roof of the site prep tractor cab to measure the ground speed of the machine. Instances of wheel slip were identified by noting increases in driveshaft speed (as indicated by the optical tachometer data) coincident with reductions in ground speed. Due to inconsistencies with the readings from the optical tachometer associated with excessive vibration, the wheel slip results will not be discussed in this paper. A Somat 2100 field computer was used to run a sampling routine and store data collected by the external sensors. The Somat field computer was set to sample at a rate of 25 Hz.
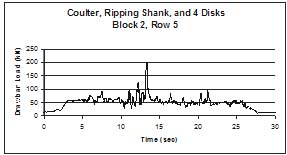
Figure 3. Drawbar Force versus Time for the Coulter, Ripping Shank, Four Disks Treatment Operating in Block 2.
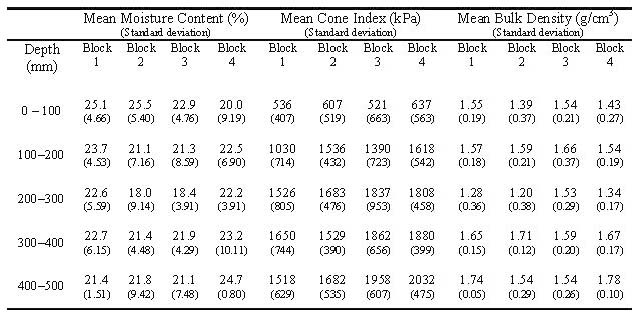
In addition to mechanical variables, the following tract variables were quantified: stump species and diameter, soil properties, and surface residue concentrations. The soil properties of interest were cone index, moisture content, and bulk density. Prior to the application of the treatments, 500-mm-long [20 in.] by 63-mm-diameter [2.5 in.] soil core samples were taken at six locations in each test block. The samples were taken at the mid point between two treatments rows and 20 m [67 ft] in from the edge of each test block. Samples that were damaged due to contact with subsurface debris such as roots and rocks were replaced by additional samples taken in the proximity of the damaged sample. The core samples were divided into 100 mm [4 in.] increments and later processed to determine moisture content and bulk density. A Rimik cone penetrometer (http://www.agridry.com.au) was used to take cone index readings at 15 points in each block. A 13mm [0.5 in], 30o cone was used on the penetrometer and readings were made in 25 mm [1 in] increments through the soil to a depth of 500 mm [20 in] below the soil surface. A summary of the soil conditions found on the test site are described in Table 1. These soil conditions are similar to those of agricultural soils, typically in agriculture subsoiling is not recommended unless the cone index exceeds 2000 kPa.
The mean values for moisture content and bulk density were calculated from six soil core samples taken within each block. The mean value for cone index was calculated from 100 readings taken within each block. Statistical analysis of the soils data found that test blocks were not significantly different from each other.
Table 1. Summary of study site soil conditions.
Data Analysis
To determine the drawbar load on the tractor, the data produced by the load cell were filtered to remove values that did not accurately reflect the treatment being tested. The types of values filtered out include extreme load spikes, negative values, values at the beginning and end of the data set, and values associated with raised disks. The filtering was completed using a macro written in Microsoft Excel spreadsheet and following this process removed 12% of the original data collected in the field. Load spikes were associated with stump-plow collisions. Because there were not a consistent number of stump collisions for each treatment, these values were filtered out of the data set when quantifying power requirements.
Negative values were removed because the load cell was not in tension, thus the plow was not being towed through the soil. Values at the beginning and end of each run were removed because the plow was not being towed in a manner consistent with normal operation (i.e. the tractor was not up to operating speed or the plow was not fully in the ground). Finally, the values recorded from the DCDT's were used to filter out data logged when a disk was raised. During a treatment that tested the drawbar pull with four disks in the ground, a raised disk would not correctly reflect the test treatment.
RESULTS AND DISCUSSION
Drawbar Force
A summary of the filtered drawbar forces recorded by the load cell are given in Table 2. As the combination of tillage implements was changed, there were corresponding changes in drawbar forces. A maximum average drawbar force of 50 kN [11 200 lb] was achieved by the coulter, ripping shank and four disk implement combination. At the test velocity of 8.29 km/h [5.15 mph], this loading corresponds to a power requirement of 115 kW [154 hp].
Table 2. Summary of drawbar force data.
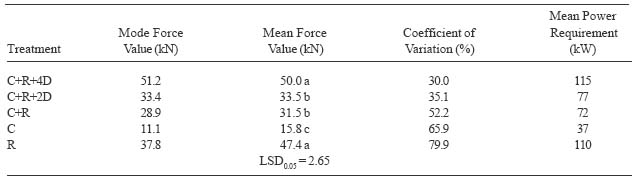
Table 2 also illustrates the importance of a coulter. There is a 34% reduction in drawbar force when a coulter is used in conjunction with a ripping shank [31.5 kN] versus the use of a ripping shank alone [47.4 kN]. Also, this data appears to show that the first set of disks behind the ripping shank were not significant in generating drawbar force. There was only a 6% drop in drawbar force when coulter and ripping shank were used without the first set of disks [31.5 kN] versus when these disks were utilized [33.5 kN]. The increase in coefficient of variation seen as one progresses down the treatment rows may be attributed to the destabilization of the plow as implements were removed from the ground.
An analysis of variance conducted on the data showed significant differences in the drawbar forces generated by the various treatments. The effect of treatment on drawbar force was significant to alpha levels less that 0.0001.
The test blocks did not significantly affect the drawbar forces measured. In conjunction with the ANOVA, Fischer's least significant difference (LSD) test was conducted on the drawbar force data to determine significant differences between the five treatments. Similar letters next to the mean force values indicate that the values are not significantly different.
From the ANOVA results, the effect of the treatments on the drawbar force value was highly significant. Also, the effect of the test blocks and the interaction between test blocks and drawbar force was not significant. Therefore, it appears that the difference in drawbar forces was a function of the tillage implement combination used during site preparation activities. This statement is strengthened by the results of the multiple-comparison tests, which show there were only two treatment pairings that were similar. The treatments that do not appear to be significantly different were C+R+4D and R, and C+R+2D and C+R.
The reason for the similarity between the C+R+4D and R treatments was most likely due to the use of the ripping shank without a coulter in the R treatment. Without a coulter to cut through surface debris and the upper layers of soil, the force generated by the ripping shank dramatically increased. There was nearly a 51% increase in force between the coulter and ripping shank treatment and the correspondtreatment involving only the ripping shank. As the plow traveled through the ground, debris would accumulate around the ripping shank and engulf the frame of the plow. This debris would become entangled around the ripping shank and reduce the efficiency of the implement to cut through soil. Because the plow was pulling the ripping shank through the soil along with the weight of a substantial amount of debris, the force generated by the ripping-shank-only treatment was similar to the force generated by the treatment that utilized the coulter, ripping shank, and four disks.
The C+R+2D and C+R treatments also appeared to be similar in their forces. The only difference between these two treatments was that the C+R+2D treatment used a set of disks that mix the soil and surface organic matter. The C+R+4D treatment utilized an additional set of bedding disks located at the rear of the plow. The bedding disks created considerable soil disturbance as a bed 1.5 m [5 ft] wide and 0.5 m [18 in] high was produced. It appears that the force produced by the two mixing disks was relatively low when compared with the force generated by the rear set of bedding disks. When the bedding disks were raised so that they did not contact the soil, there was a 27% decrease in force compared with a 6% decrease in force when the mixing disks were raised. This result seems reasonable because visual appraisal of the tests noted that the soil disturbance was dramatically increased when the bedding disks were utilized.
Drawbar Power
Drawbar power is the rate energy is consumed by pulling a tillage implement through the soil over a given time interval. Therefore, it is important for a site preparation practitioner to use a prime mover that is capable of generating the power required to pull a forestry tillage system. The tillage treatments studied were conducted at a ground speed of 8.3 km/h [5.15 mph]. Contractors in the Southeastern United States regularly use this approximate speed when applying a subsoiling treatment. The force data used to determine drawbar power were filtered so only force values corresponding to machine speeds within +0.1 km/h of the mean were used for analysis. A subsequent analysis of variance found the block layout and treatment application were no significant factors influencing the speed of the machine in this study. It is possible to determine the drawbar power requirement for each treatment using Equation 1.
 (1)
(1)
P = Drawbar Power (kW)
F = Drawbar Force (kN)
v = Machine Velocity (km/h)
The first treatment that utilized the coulter, ripping shank, and four disks produced the greatest mean drawbar power, 115 kW [154 hp]. Treatments two through five produced the following drawbar power results, respectively: 77 kW [103 hp], 72 kW [96.5 hp], 37 kW [49.6 hp], and 109 kW [147 hp]. The values for drawbar power are summarized in Table 2.
Stump Collision
As stated earlier, an objective to this study was to investigate the magnitudes of the dynamic forces generated by a collision between a tree stump and the plow. A survey of the site showed there were 107 stumps within the test blocks laid out for this experiment. Due to thinning operations and weather-related factors, there was no longer an easily observed pattern to the stumps and they were randomly located throughout the test blocks. Also, it is difficult to control the site prep tractor and plow in such a manner that allowed each stump to be struck in the same manner (i.e. direct hit in the center versus skirting the edge).
Returning to the original, unfiltered data set, drawbar force values in excess of 110 kN [25 000 lb] were selected for further examination. In general, values of this magnitude occurred over a short period of time, were associated with a sudden decrease in velocity, and were followed by a sharp drop in drawbar force (this indicated the plow was removed from the ground to clear an obstacle). The GPS coordinates associated with drawbar force values exceeding 110 kN [25 000 lb] were compared to the GPS coordinates for stump locations to determine if the event was actually a stump collision. Out of 21 minutes of data recorded, drawbar forces in excess of 110 kN [25 000 lb] occurred in 36 seconds of the data. This represents 2.85% of the data collected and 17 individual stump collisions. The highest load recorded was 340 kN [76 000 lb] for a duration of 0.16 seconds. It should also be noted that during field tests the load cell linkage suffered a failure as two welds separated and rendered the linkage inoperable. This failure occurred with the ripping shank caught in a 521 mm [21.5 in] loblolly pine stump. The drawbar force measured by the load cell at the time of failure was 205 kN [46 000 lb].
CONCLUSIONS
Many mechanical site preparation operations in the Southeastern United States have been curtailed due to the high costs associated with these operations. Increasing the productivity or lowering the cost of tillage equipment through more efficient designs, the use of smaller prime movers, or the development of multiple row plows could revitalize mechanical site preparation. This research quantified the drawbar forces required by five different combinations of tillage implements on a trailing site preparation plow. Based on the results of this study, the following specific conclusions can be made:
1. There were clear trends in the drawbar power required for each of the five treatments. These trends are supported by analysis of variance tests and multiple-comparison tests.
2. The use of a coulter appears to dramatically reduce the power consumption of the ripping shank. Field tests indicate there is a 34% decrease in power consumption when using a coulter along with a ripping shank compared to using a ripping shank alone.
3. The front set of mixing disks appears to consume a relatively low amount of power when compared to the ripping shank, bedding disks, and coulter.
4. The maximum average drawbar power recorded for a block was 124 kW [166 hp]. This drawbar power occurred while applying the coulter, ripping shank, four disk treatment at a speed of 8.30 km/h [5.15 mph].
5. Stump events (forces over 111 kN [25 000 lb] appeared in 2.85% of the load data collected. The highest drawbar load recorded was 388 kN [76 188 lb]. Direct collisions with stumps appear to be a rare event, but these loads are critical for determining prime mover size and designing equipment.
The drawbar forces reported in this research indicated that seemingly small changes in the configuration of a site preparation plow could greatly influence the power consumption of the plow. However, this research is only an initial step toward the development of more efficient, cost-effective site preparation plows. The drawbar force required by other tillage implement configurations not tested
in this study need to be quantified. Also, the effects on drawbar force requirements of soil conditions, rigidly mounting plows on prime movers, and tillage implement spacing are yet to be determined. Also, there appears to be little agreement on which of the treatments tested in this study would produce the optimal level of wood fiber production. In order to produce a site preparation plow capable of competing in the today's economic environment, solutions to these problems must be found.
ACKNOWLEDGMENTS
The authors wish to express their appreciation to Frank Corley and other personnel at Woodland Specialists, Inc. and to International Paper for their assistance in providing equipment and the location for field tests. The authors would also like to thank the USDA Forest Service Southern Research Station for providing funding assistance for the research.
AUTHOR CONTACT
Dr. Veal can be reached by e-mail at --
mveal@bae.uky.edu
REFERENCES
[1] Cormier, D. 1990. Evaluation of the Le Crabe forestry disk harrow. Forest Engineering Research Institute of Canada. Technical Note TN-150. 6 p
[2] Cormier, D. 1993. Drawbar pull requirements for Bräke patch scarifiers and the TTS-35 Disc Trencher. Pointe Claire, Quebec: Forest Engineering Research Institute of Canada. Technical Note TN-204. 8pp.
[3] Cormier, D. 1993. Drawbar pull requirements of four drag scarifiers. Pointe Claire, Quebec: Forest Engineering Research Institute of Canada. Field Note Silviculture-75. 2pp.
[4] Culley, J.L.B., and B.K. Dow. 1988. Long-term effects of an oil pipeline installation on soil productivity. Canadian J. Soil Sci. 62, 267-279.
[5] Hadas, A. 1994. Soil compaction caused by high axle loads _ review of concepts and experimental data. Soil Till. Res. 29, 253-276.
[6] Håkansson, I., and R.C. Reeder. 1994. Subsoil compaction by vehicles with high axle load _ extent, persistence, and crop response. Soil Till.Res. 29, 277-304
[7] Jones, A.J., L.L. Bashford, R.D. Grisso. 1996. Subsoiling in Nebraska. Cooperative Extension University of Nebraska-Lincoln. NebFacts NF 96-258. 4pp.
[8] Rester, D. 2000. Tillage equipment horsepower requirements. Louisiana State University AgCenter. 9pp.
[9] Smith, D.M., B.C. Larson, M.J. Kelty, P.M.S. Ashton. 1997. The Practice of Silviculture: Applied Forest Ecology. John Wiley & Sons, New York. 537pp.
[10] Soane, B.D. and C. Van Ouwerkerk. 1995. Implications of soil compaction in crop production for the quality of the environment. Soil Till. Res. 35, 5-32.