 (1)
(1)
Vol. 16, No. 2 July 2005
Jingxin Wang
West Virginia University
Morgantown, WV, USA
Chris B. LeDoux
USDA Forest ServiceM
Morgantown, WV, USA
Yaoxiang Li
West Virginia University
Morgantown, WV , USA
The authors are, respectively, Assistant Professor, Division of Forestry, West Virginia University, Project Leader, Northeastern Research Station, USDA Forest Service, and Graduate Research Assistant, Division of Forestry, West Virginia University.
ABSTRACT
Cut-to-length (CTL) harvesting systems involving small and large harvesters and a forwarder were simulated using a modular computer simulation model. The two harvesters simulated were a modified John Deere 988 tracked excavator with a single grip sawhead and a Timbco T425 based excavator with a single grip sawhead. The forwarder used in the simulations was a Valmet 524 machine with 2.4-meter log bunks. Production rates and costs were examined for a wide range of even-age oak forest stand conditions. The simulation results suggest that when the tree's DBH is less than 26 cm, harvesting using the Timbco T425 is about 30% more expensive than using the John Deere 988. However, if the tree is larger than 26 cm of DBH, the unit cost of the Timbco T425 was about 8% less than that of the John Deere 988. The balanced John Deere 988 CTL system was 31% more productive and 8% more expensive than the balanced Timbco T425 CTL system in the 20 to 36 cm DBH range. General regression equations were developed for estimating the productivity and cost for the range of conditions simulated. The results should be valuable to managers, planners, and loggers considering the use of CTL systems in this region.
Keywords: Cut-to-length, production analysis, computer simulation, system modeling, timber harvesting, Appalachian hardwoods.
INTRODUCTION
A fully mechanized cut-to-length (CTL) harvesting system consists of a harvester that performs cutting, delimbing, bucking, and piling and a forwarder that transports the logs to the landing. Compared to conventional ground-based harvesting systems, cut-to-length systems are more environmentally friendly and less labor intensive. The CTL can also significantly reduce the soil disturbance, compaction, and erosion by leaving the wood residues on the travel path, which acts as a cushion for machine travel [24]. In addition, the number of trips of the forwarder across the site also decreased because of its higher payload [28]. The CTL system also results in less residual stand damage by transporting the logs instead of dragging the whole tree and is less sensitive to inclement weather [13, 15].
CTL systems have been used for years in Scandinavian countries. Almost 100% of today's logging in Sweden and Finland is carried out by CTL systems [6]. Several studies were conducted in these and other countries including productivity and cost analysis [22], assessing harvester in the wood supply chain [3], and the utility and productivity of a new integrated or combined harvester-forwarder [23, 31]. In North America, CTL systems are used about 20 to 30% of the time [4]. CTL applications are used even less in the southeastern USA with not more than 1% reported [7]. A survey by Milauskas and Wang [19] found that CTL has not been used in West Virginia.
Due to its higher initial cost, the production and unit cost of CTL systems have always been a concern when selecting harvesting systems for logging jobs. Tufts and Brinker [25] and Tufts [26] reported harvesting southern pine plantations using CTL systems and provided detailed information about elemental time functions of individual harvesters and forwarders. Lanford and Stokes [13, 14] compared a CTL system with a feller-buncher and grapple skidder system in terms of the residual tree damage, soil disturbance and compaction, and harvesting productivity and costs in southern pine plantations. They concluded that at almost the same cost as the skidder system, the CTL system performed better from a silvicultural and environmental standpoint.
McNeel and Rutherford [18] studied the performance of CTL in a selection cut of Pacific Northwestern species. They modeled the elemental times of a harvester and forwarder and their results suggested that system productivity is balanced when operating in stands averaging 15 to 25 cm DBH. Hartsough and Cooper [8] tested a CTL and chipper system in a clearcut of 7-year-old Eucalyptus and found that a balanced system including three harvesters, two forwarders, and one chipper might be cost competitive with whole-tree systems. The performance of CTL systems was also investigated in eastern hardwoods [10, 11, 12, 15, 16] where time studies were conducted to compare the system's production and cost and to conduct a profitability assessment.
Due to the availability of CTL systems and the great variation of the working conditions, computer simulation has been used to simulate and analyze production and cost [5, 27, 29]. Wang et al. [27] modeled the CTL system and compared it to chainsaw/grapple skidder and feller-buncher/grapple skidder systems. They found that the CTL productivity was lower than that of feller-buncher/grapple skidder system but was higher than the productivity of chainsaw/grapple skidder. However, the CTL system resulted in the lowest traffic intensity across the site when compared to the other two systems. A harvester-forwarder system was evaluated by using discrete-event simulation [1]. The input was the statistical distribution derived from field-study data. Average extraction distance and unloading time were used for sensitivity analysis. A linear regression equation of production of the system was developed from the simulation results. Hartsough et al. [9] modeled and simulated the costs of CTL and five other systems for harvesting small trees in natural stands in the interior Northwest and found that computer simulation is an efficient way to explore logging cost analysis under different stand and machine combinations.
Most of the previous studies reported are either for specific regions or for specific stand conditions. Production and cost information of CTL systems is not available for Appalachian even-aged oak hardwood forests. Accordingly, in order to examine the potential applications of CTL systems and compare them with other commonly used harvesting systems in the region, we modeled two CTL harvesters and simulated their production and cost. The objectives of this study were specifically to (1) model two CTL systems with small and large harvesters, respectively, (2) generate five central Appalachian even-aged oak hardwood stands of different ages and stand densities, (3) perform felling and forwarding simulations on these stands for clearcut, diameter limit, and shelterwood treatments, and (4) statistically analyze the production, cost, and traffic intensity of these two CTL systems and develop general regression models for estimating productivity and cost.
CTL SYSTEM MODELING
Functions and Elemental Times
Six functions were modeled for each harvester: move, boom extend/retreat, cut, swing boom, processing and dumping. More than one tree within the boom reach could be cut and processed at one machine stop. The felled tree was processed into logs that were piled on either side of the harvester trail for later forwarding. The harvester usually operates in straight trails and the trail width is usually set to 5 meters. All trees on the trail must be removed for the machine movement and trees on either side of the trail could be cut based on the silvicultural prescription for the stand.
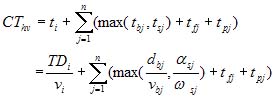
The cycle time of harvester can be expressed as:
(1)
Where
CThv = harvester cycle time (minutes);
ti = time of machine travel from (i-1)th stop to ith stop (minutes);
n = total number of trees harvested at a stop by the harvester;
TDi = distance traveled by the harvester from (i-1)th stop to ith stop (m);
vi = moving speed of harvester (m/min.);
tbj = time of linear boom extending between two consecutive felled trees (minutes);
dbj = relative linear distance changed of boom reach between two consecutive felled trees;
vbj = speed of boom extending or retreating for jth tree (m/min.);
tsj = time of boom swing between two consecutive felled trees (minutes);
asj = angular changes of boom between two consecutive felled trees (degrees);
wsj = velocity of boom swing (degrees/min.);
tfj = felling time of jth tree at ith stop;
tpj = processing time of jth tree at ith stop;
Boom movement time tbj and tsj are functions of the linear distance of the boom extended and the angular distance of the boom swing and their corresponding velocities, respectively. Felling and processing elemental times were denoted as functions of DBH and the number of logs being processed from the tree-length [10, 11, 12, 17, 25].
Move to load, load, travel during loading, travel loaded, and unload were modeled for the forwarder. Cycle time for the forwarder is calculated as follows:
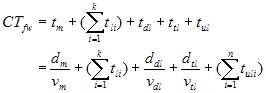 (2)
(2)
Where
CTfw = cycle time of forwarder (minutes);
tm = time of machine travel empty (minutes);
dm = distance of machine travel empty (m);
vm = speed of machine travel empty (m/min.);
k = total number of log piles loaded;
tli = time of loading a log pile;
tuli = time to unload a grapple of logs from the forwarder;
n = the number of unloading log cycles from the forwarder;
ttl = time of machine travel loaded (minutes);
dtl = distance of machine travel loaded per turn;
vtl = speed of machine travel loaded;
tdl = time among loading locations;
ddl = the sum of distances among loading locations;
vdl = speed of machine traveled during loading.
Loading and unloading times for a forwarder were formulated as functions of log size, product type, the number of logs being processed from a tree, and the number of grapple loads required to unload the forwarder [10, 11, 12, 17, 25].
Machine and Boom Movements
The harvester always tries to find the nearest tree to be cut. An "obstacle tree checking" procedure is performed before the machine physically starts to cut each tree so as to avoid residual tree damage. Trees are assumed to be circles with diameter equal to individual DBH. Each standing tree is also presumed as a potential obstacle to the tree to be cut and its position is checked (Figure 1 (a)). If the maximum boom reach is Lboom, and the boom reach ratio (the rate of the effect boom reach over the maximum boom reach) is rboom, then the effective boom reach (Le) could be expressed as Le = Lboom * rboom.
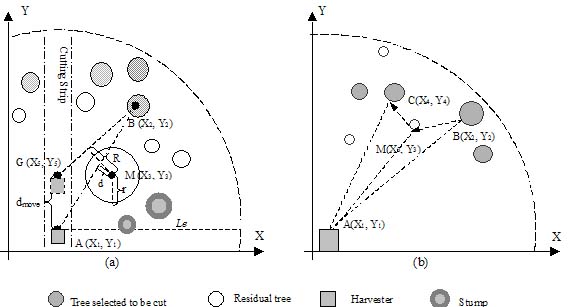
Figure 1. Diagrams of algorithms used for checking obstacle trees.
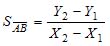
Let A (X1, Y1) be the current position of the machine, B (X2, Y2) be the coordinate of the nearest tree selected to be cut, and M (X3, Y3) be the coordinate of the tree being checked as an obstacle. The effective cutting area could be expressed as a circle centered at point A with radius equal to the effective boom reach Le. If any portion of the tree being checked crosses line AB (line AB is tangent to or intersects the circle) or the distance from the tree to the boom-moving route is less than 0.5 m (minimum allowance), then this tree will be considered as an obstacle tree. In Figure 1, d in meters represents the perpendicular distance from point M to line AB; r is half the DBH of the tree examined in centimeters; and R in meters stands for the perpendicular distance from the center of the tree to boom.
The linear function of line segment AB can be expressed as:
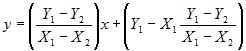 (3)
(3)
The distance (d) from the center of the tree at (X3, Y3) to line AB can be expressed as:
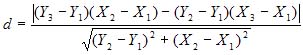 (4)
(4)
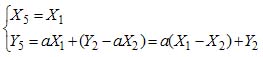
If d < 0.01r + 0.5, then there is some portion of a tree across line AB or the tree is within the protection distance, this tree is an obstacle. Therefore, the machine has to move to point G (X5,Y5) to cut the tree being checked. To avoid tree damage, the following condition has to be met: R ³ 0.5 + 0.01r. If assuming the machine moves on the straight line, X5 = X1 will be true. Then the next machine position G (X5, Y5) can be derived. Line BG in Figure 1(a) can be expressed as:
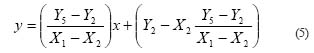
Let
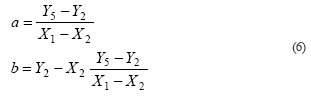
Then 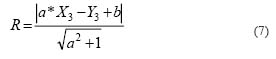
From equation (6), we can have,
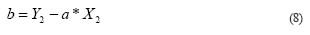
Substitute b in equation (7) with equation (8) and square both sides of equation (7), then the following equation could be derived.
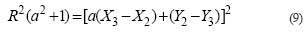
Let 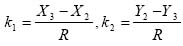 , divide R2 on
both sides of equation (9), then equation (9) could be
rewritten as:
, divide R2 on
both sides of equation (9), then equation (9) could be
rewritten as:
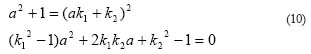
Solve this quadratic equation (10) for a, we can have,
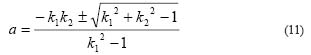
Two solutions could be obtained from equation (11). However, the smaller absolute solution should be used in order to make the harvester move as short a distance as possible. The next machine position could be computed as:
 (12)
(12)
In order to avoid residual tree damage, the machine
move distance should be 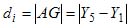
. If there are n obstacle trees checked at the current machine
location, then the machine should move to next stop,
dmove = min
{d1} (Figure 2).
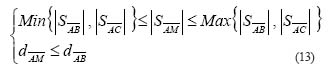
If the boom is already extended (Figure 1 (b)), the machine is at point A (X1, Y1), the boom is as point B (X2, Y2), and the next tree selected to be cut is at point C (X3,Y3). Before swinging the boom directly from B to A, we have to check for any trees between line AB and line AC [5]. Mathematically, the following conditions have to be met to avoid the residual tree:
Where,  ,
,  ,
,  is the slope of line
  ,
,  , and
, and  , respectively;
 ,
,  is the distance from point A to point M
and point B, respectively,
is the distance from point A to point M
and point B, respectively,
 ;
;
 ;
;

If the above two conditions are met, the tree being checked is an obstacle. To cut the tree at C from B, the boom has to retrieve from B to M first, and then extend from M to C if no other trees exist between line AM and line AC. Otherwise, the boom needs to be retreat from M and then swings to C (Figure 2).
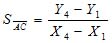
The forwarder moves along the harvester trail, grips the logs from each pile and places them in the bunk at the back of the machine. When the payload is reached, the forwarder will go back to the landing and unload the logs (Figure 2).
Figure 2. Flowchart of cut-to-length simulation system.
Field data from detailed time and motion studies by Huyler and LeDoux [10,11,12] and Long [17] for the John Deere 988 and the Timbco T425 harvesters and the Valmet 524 forwarder were used as input to the simulator. The field studies were conducted over a wide range of operating conditions in hardwood and mixed hardwood/pine stands. The range of tree sizes as well as operating conditions were very similar to the conditions simulated. The field conditions closely reflect the conditions of the computer-generated scenarios used for the simulations. Since the field and simulated conditions were similar, the results from this study provide information applicable to current practice.
SIMULATION APPLICATION
Material and Methods
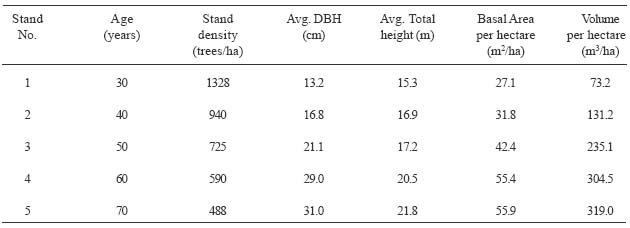
Felling was performed on five even-aged oak hardwood stands that were generated with a 3D stand generator (Table 1) [30]. The input data to the stand generator came from Schnur [21]. Major species included northern red oak (Quercus rubra), red maple (Acer rubrum), sugar maple (Acer saccharum), yellow poplar (Liriodendron tulipifera), black cherry (Prunus serotina). Stand age was between 30 and 70 years while its density varied from 1328 to 488 trees/ha. The number of trees per hectare by species was computed by multiplying stand density and species composition percent in the stand. While randomly generating a tree, its species is randomly assigned along with tree size and location. The plot size is 0.4 ha, which was replicated 36 times and gave a total of 14.4 ha of each stand for the forwarding simulations. Each replication involved the generation of a new stand with different tree locations thus adding stochasticity to the simulations.
Two cut-to-length systems were simulated. CTL system 1 is composed of a modified John Deere 988 tracked excavator with a model RP 1600 single grip sawhead (small machine) and a Valmet 524 forwarder with 2.4-meter log bunks. CTL harvesting system 2 has an excavator based Timbco T425 with an ultimate 5600 single grip sawhead (large machine) and the same forwarder as used in System 1. The maximum cutting diameter for the above two harvesters is 36 cm and 56 cm, while delimbing diameter ranges from 1.3 to 23 cm and 5 to 25 cm, respectively.
Table 1. Summary of attributes for the hardwood stands generated.
The harvesting simulator was implemented under Windows platforms. The graphical user interface makes it easier for the user to perform the harvesting simulations. Numerical models with predefined paths of machines or forwarding patterns reduce the simulation time and allow the user to examine a variety of stand conditions, harvesting prescriptions, and system configurations. The modeling/simulation procedures introduced in this paper may help us to evaluate alternative stands, travel routes, traffic intensities, and machine configurations. Without these models/simulations such comparisons would simply not be possible.
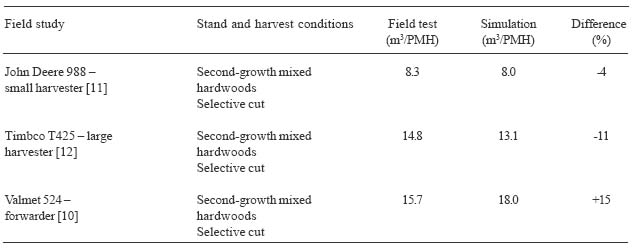
The productivity of each machine simulated was point validated against published results by Huyler and LeDoux [10,11,12]. The field study conditions were used as input to the simulator and then the simulated productivity by machine was compared to the observed results in the field (Table 2). Hourly productivity differences never exceeded 15%, suggesting that the simulation model could be used to accurately simulate the productivity of the machines. The 15% difference for the forwarder validation test is likely explained because the simulator loads wood (weight) until the maximum payload is reached without regard to the way logs might lay in the bunks. In the field, logs with crook and sweep will take up more bunk space reducing the actual payload.
Table 2. Validation test comparisons of point estimates of average hourly production between field and simulation results.
A three-factor, full factorial design (3x2x3) was implemented for the simulation experiment (Table 3). The three factors include stands of three different ages, harvesting systems (2 systems), and harvest (3 methods). There are a total of 18 treatment combinations. Each combination was replicated two times for a total of 54 felling experiments. Another 54 forwarding simulations were conducted based on felling results.
Table 3. Variables included in the simulation experiment.
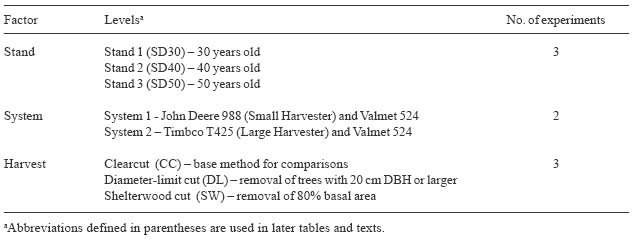
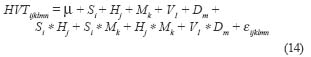
One of the advantages of the factorial design is that it permits the study of two-way interactions as well as three-way interactions in addition to examining the main effect of each individual factor. Analysis of variance (ANOVA) was used to analyze if there was significant difference of elemental time, and production/cost between the two CTL systems and among other operational factors for the range of 20 to 36 cm DBH only (30, 40, 50 year old stands only). The general linear model (GLM) used for harvester analysis is expressed as:
i = set of stands {1,2,3}
j = set of harvesting methods {1,2,3}
k = set of harvesters {1,2}
l = set of tree sizes {1,2,3,4,5}
m = set of distances traveled per cycle {1,2,3,4,5}
n = 1, 2,…, p
Where HVTijklmn represents the nth response variable of the elemental times, hourly production, and unit cost; m is the overall mean of the response variable; Si is the effect of the ith stand factor; Hj is the effect of the jth harvester; Mk is the effect of the kth harvesting method; Vl is the effect of lth tree size class; Dm is the effect of mth ground travel distance per cycle; and eijklmn is an error component that represents all uncontrolled variability. Interactions among stand, harvest, machine were also considered in the model.
The generic GLM model for analyzing forwarding can be stated as follows:
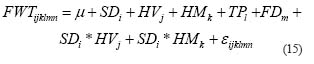
Where FWTijklmn represents the nth observation of the forwarding elemental times, cycle time, or hourly production; m is the overall mean of the response variable; SDi is the effect of ith stand; HVj is the effect of jth harvester; HMk is the effect of kth harvest method; TPl is the effect of lth level of turn payload; FDm is the effect of mth category of forwarding distance; eijklmn is an error component that represents all uncontrolled variability. Regression techniques were employed to produce prediction equations for elemental times and hourly production.
RESULTS
Felling Operations
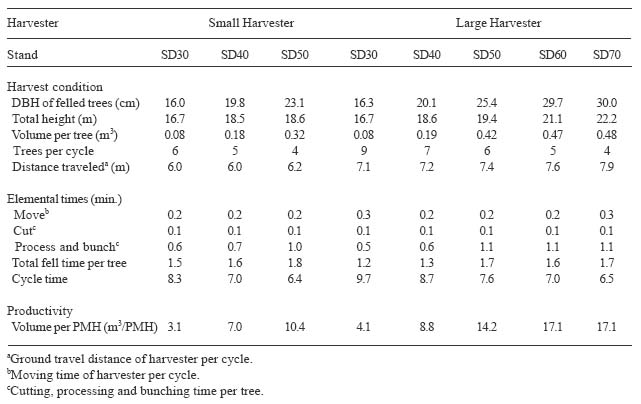
The average DBH of felled trees varied from 16 cm in 30-year-old stands to 30 cm in 70-year-old stands and total height ranged from 16 to 23 m as the stand age increased from 30 to 70 years (Table 4). Volume per felled tree by the large harvester was between 0.08 m3 and 0.48 m3. Since the small harvester could only handle trees of 36 cm DBH or less, the volume per felled tree increased from 0.08 m3 in 30-year-old stands to 0.32 m3 in 50-year-old stands. Trees felled per cycle were between 4 and 9. The minimum process diameter/topping diameter used was 20.3 cm. The ground travel distance for each harvester per cycle increased as the stand stem density decreased. It was about 6.0 m for the small harvester and varied from 7.1 to 7.9 m for the large harvester.
Table 4. Harvest condition, elemental times, and productivity averages for operational variables by harvester and stand.

Display large image of Table 4
Moving time per cycle is affected by the harvester, stand stem density, harvest method, and corresponding ground travel distance. It was about 0.2 minutes per cycle (Table 4). The moving time was significantly different between harvesters (F=972.26; df=1,53; P=0.0001), among harvest methods (F=1991.80; df=2,53; P=0.0001), and among ground travel distance categories (F=38.94; df=1,53; P=0.0001) (Table 5). However, it was not significantly different among stands (F=1.56; df=2,53; P=0.2199). All the interactions among stand, machine, and harvest significantly affected the moving time of the harvester.
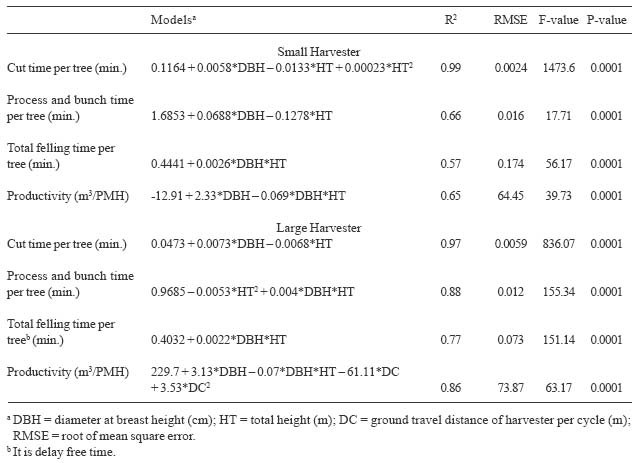
Cut time per tree was about 0.1 minutes (Table 4). It differed significantly between harvesters (F=56.33; df=1,53; P=0.0001), among stands (F=570.65; df=2,53; P=0.0001), harvests methods (F=180.26; df=2,53; P=0.0001), and average tree sizes (F=48.62; df=2,53; P=0.0001) (Table 5). The cut time per tree in minutes was regressed as a function of DBH and total height (Table 6).
Process and bunch time per tree varied from 0.5 to 1.1 minutes depending on the size of tree being felled (Table 4). The process and bunch time was significantly different between harvesters (F=15.51; df=1,53; P=0.0002) and among stands (F=242.26; df=2,53; P=0.0001), harvest methods (F=569.64; df=2,53; P=0.0001), and average tree sizes (F=40.77; df=2,53; P=0.0001) (Table 5). The interactions among harvester, stand, harvest method, and tree size all significantly affected the process and bunch time per tree. Process and bunch time per tree was modeled as a function of DBH and total height using regression techniques (Table 6).
Total felling time per tree includes moving time, cut, process and bunch time for each felled tree, in which moving time per tree was obtained by averaging the moving time per cycle. Total felling time per tree ranged from 1.2 to 1.8 minutes (Table 4). There was significant difference in total felling time per tree between harvesters (F=26.31; df=1,53; P=0.0001) and among stands (F=386.81; df=2,53; P=0.0001), harvest methods (F=5145.95; df=2,53; P=0.0001), average tree sizes (F=25.88; df=2,53; P=0.0001), and ground travel distances per cycle (F=43.84; df=1,53; P=0.0001) (Table 5). Total felling time per tree was estimated by DBH and total height (Table 6).
Cycle time decreased as the stand stem density decreased from a 30 year old stand to a 50 year old stand or to a 70 year old stand (Table 4). This result is largely due to the fact that less and larger trees are processed in any one cycle as the stand age increases compared to the younger denser stand with smaller trees. The cycle time ranged between 6 and 10 minutes. All the factors in equation (14) significantly affected the cycle time at the 95% confidence level (Table 5).
Table 5. Elemental time averages and statistical significant levels for harvester felling by harvester, stand, harvest method, tree size and travel distance.*
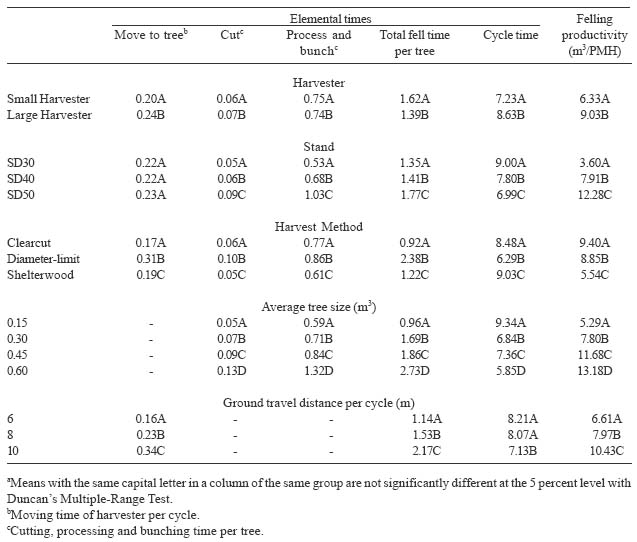
The average hourly production for the small harvester was between 3.1 and 10.4 m3 per productive machine hour (PMH) while the productivity of the large harvester ranged from 4.1 to 17.1 m3/PMH as the sizes of felled trees increased (Table 4). Felling productivity was significantly different between harvesters (F=80.36; df=1,53; P=0.0001) and among stands (F=2342.09; df=2,53, P=0.0001), harvests methods (F=704.95; df=2,53; P=0.0001), average tree sizes (F=51.36; df=2,53; P=0.0001), and ground travel distances (F=559.10; df=2,53; P=0.0350) (Table 5). The hourly felling production was modeled as a function of DBH, total height, and ground travel distance (Table 6).
Forwarding Operations
Average payload of the forwarder ranged from 11.9 to 14.6 m3 while the average forwarding distance varied from 305.3 to 325.1 m (Table 7). Volume per hectare extracted was between 62.8 and 284.0 m3 for the stands simulated.
Travel empty time averaged about 4.5 minutes (Table 7). It was significantly different between the sites harvested by these two harvesters (F=8.57; df=1,89; P=0.0047) and among stands, harvest methods, and average forwarding distances (Table 8). Travel empty time could be expressed as a function of average forwarding distance (Table 9).
Loading time decreased as the number of logs in a pile increased and was between 8.7 and 21.4 minutes (Table 7). There was no significant difference in loading time between harvesters (F=0.32; df=1,89; P=0.5757) (Table 8). However, stand stem density, harvest method, and pay load did significantly affect the loading time. Move time during loading varied from 1.0 to 6.2 minutes with the stand stem density or harvest method (Table 7). Similarly, the harvester (F=0.26; df=1,89; P=0.6091) did not significantly affect the moving time of forwarder during loading (Table 8). However, it was significantly different among stands, harvest methods, and payload sizes (Table 8).
Table 6. Regression models for estimating component times and productivity for the harvesters.
Travel loaded time averaged about 4.7 minutes (Table 7). It was significantly different among harvests (F=59.64; df=1,89; P=0.0001), average forwarding distances (F=37.74; df=1,89; P=0.0001), and payload sizes (F=12.78; df=3,89; P=0.0001) (Table 8). The interactions among stands, machines, and harvests also significantly affected the travel loaded time. However, there was no significant difference in travel loaded time between harvesters (F=0.65; df=1,89; P=0.4213) and among stands (F=0.90; df=4,89; P=0.4719) (Table 8). Travel loaded time was regressed as a function of payload and average forwarding distance (Table 9).
Unloading time averaged about 5 minutes (Table 7). It was solely affected by the payload and was significantly different among payload sizes (F=66.24; df=3,89; P=0.0001) (Table 8).
Forwarding cycle time ranged between 23 and 41 minutes (Table 7). All the factors in equation (15) significantly affected the cycle time (Table 8). The cycle time could be estimated by payload and average forwarding distance (Table 9).
The traffic intensities of the forwarder within each smaller grid, e.g., 5 by 5 meters were recorded and examined while the forwarding simulation was being performed. Four travel intensity categories for the forwarder were defined [2]:
TI1 - Trees on the plot have been felled.
TI2 - Trees that stood on the plot have been removed and no other traffic has passed through the plot.
TI3 - Trees that stood on the plot have been removed and trees outside the plot have been skidded through the plot. There have been 3 to 10 passes with a loaded machine.
TI4 - There have been more than 10 passes with a loaded machine through the plot.
TI3 and TI4 are the main concern since they cause the most soil compaction. Percentages of TI3 and TI4 increased as the volume per hectare extracted increased and were from 9 to 12% for TI3 and from 1 to 10% for TI4 (Table 7). This result is because as the volume per acre increases, more large trees are cut and thus the forwarder has to make more trips to extract the wood. TI3 and TI4 can be added to illustrate the total area that was impacted with three or more passes by a loaded machine. TI3 and TI4 were significantly different between sites harvested by the small and large harvesters (F=98.39; df=1,89; P=0.0001), among stands (F=848.33; df=4,89; P=0.0001), among harvests (F=99.65; df=1,89; P=0.0001), and among payload sizes (F=5.40; df=3,89; P=0.0022) (Table 8). The average forwarding distance (F=0.00; df=1,89; P=0.9964) did not significantly affect the TI3 and TI4.
Table 7. Averages of forwarding conditions, elemental times, traffic intensity, and production for forwarding by stand.
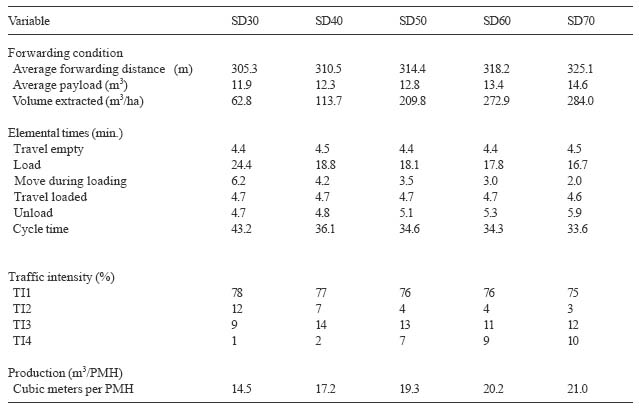
Hourly forwarding production ranged from 20.0 to 29.0 m3/PMH (Table 7). The factors in equation (15) all significantly affected the hourly production (Table 8). The forwarding productivity was modeled as a function of turn payload and average forwarding distance (Table 9).
Cost and Harvesting System Analysis
Hourly costs for the harvesters and the forwarder were estimated using the machine rate method [20]. Labor was $10 per hour plus additional 35% labor-related fringe benefits. Interest, insurance, and tax were assumed as 15%. Salvage value of the machine was 20% of its purchase price. Fuel and lubricants were $0.44 and $2.67/liter. Other cost assumptions varied by machine (Table 10). Non-productive time was accounted for each system by expressing the simulated productivity and cost in terms of a productive machine hour (PMH).
The hourly costs of the small and large harvesters were $115.00 and $146.70, respectively. When combined with their average hourly productivity rates of 7.6 m3/PMH and 11.9 m3/PMH, the unit costs would be $15.13/m3 and $12.33/m3 for the small and large harvesters respectively. Felling unit costs of the harvesters generally decreased with an increase in DBH (Figure 3). The simulation results suggest that when the tree's DBH is less than 26 cm, harvesting using the Timbco T425 is about 30% more expensive than using the John Deere 988. However, if the tree is larger than 26 cm of DBH, the unit cost of the Timbco T425 was about 8% less than that of the John Deere 988.
The hourly cost of the forwarder was estimated as $110.00. A unit cost of $5.9/m3 was obtained by combining an hourly production of 18.64 m3/PMH. The unit cost of forwarding decreased from $8.76/m3 to $3.91/m3 as the turn payload size increased from 10 m3 to 18 m3 (Figure 4) while it increased from $5.81/m3 to $8.20/m3 as the average forwarding distance increased from 260 to 460 meters (Figure 5).

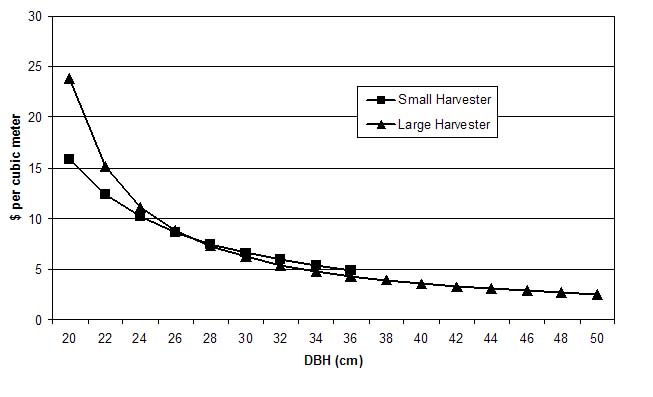
Figure 3. Cost per cubic meter for the small and large harvesters by average tree DBH.
Table 9. Regression models for estimating component times and productivity for the forwarder.
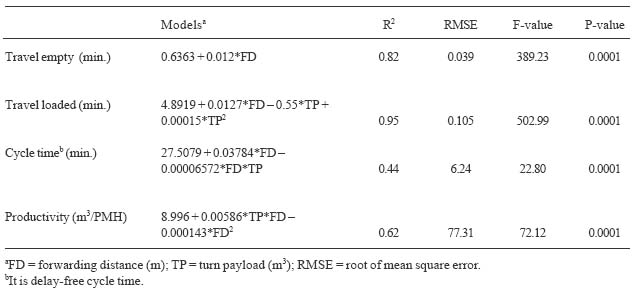
Table 10. Cost assumptions for the machines used in the simulation studya.
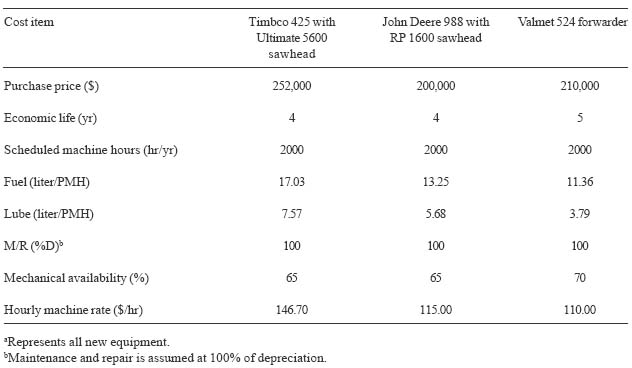
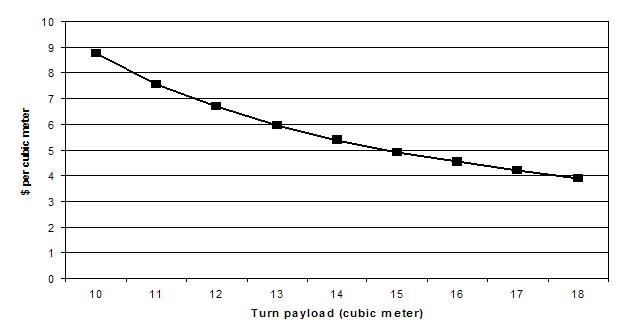
Figure 4. Cost per cubic meter by turn payload for the forwarder.
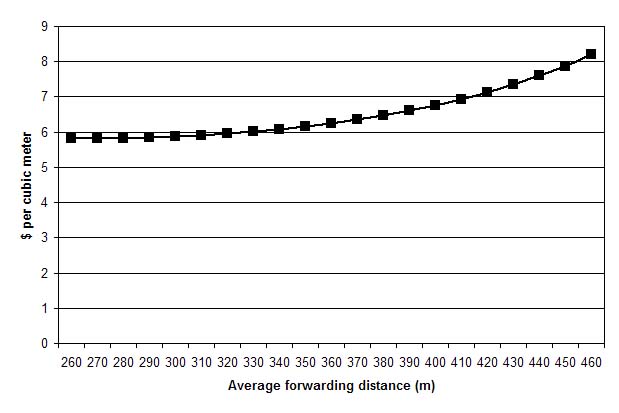
Figure 5. Cost per cubic meter for the forwarder by average forwarding distance.
The two harvesting systems were balanced to examine their production per week and cost per unit on-board truck. Two small harvesters and one forwarder were used in the balanced system 1 while one large harvester and a forwarder were used in the balanced system 2. CTL harvesting system 1 could produce 391.0 m3 per week with a unit cost of $23.34/m3 and the weekly production of CTL system 2 was 299.3 m3 at the unit cost of $21.58/m3.
DISCUSSION
Simulation results suggest that cut time, process and bunch time, and total felling time per tree for the harvester were primarily affected by DBH and total height of the tree harvested. Ground travel distance per cycle was not sensitive to these elemental times because several trees were usually felled and processed by the harvester in each cycle. Felling productivity of the large harvester was also affected by the ground travel distance per cycle in addition to DBH and total height of harvested tree. This was because the large harvester generally traveled 25% longer than the small harvester per cycle. The larger harvester was more expensive than the smaller harvester when harvesting smaller trees. However, when tree size was between 28 and 36 cm, the smaller harvester was more expensive and its unit cost was about 8% higher than the $5.57/m3 of the larger harvester.
Travel empty time of the forwarder was solely affected by the average forwarding distance. However, travel loaded time, cycle time, and forwarding productivity were sensitive to both average forwarding distance and payload size. TI 3 and TI4 increased from 10% in a 30-year-old stand to 22% in a 70-year-old stand. The result was due to the increase in volume per hectare extracted from 30-year-old stands compared to 70-year-old stands. The forwarding unit costs varied decreasingly with increasing turn payload and increasingly with the increasing average forwarding distance.
When the system was balanced, CTL system 1 with two small harvesters was about 31% more productive but 8% more expensive than the CTL system 2 with a large harvester. CTL system 1, however, is about 50% more productive and 4% less expensive than the CTL system 2 for harvesting stands with trees smaller than 26 cm DBH.
The resulting regression equations developed from these simulations can be used to estimate productivity and cost for the range of stand conditions examined by component. Loggers considering the use of these types of machines in hardwoods can use our estimators to gauge what the productivity and cost would be for a range of operating conditions.
Although we only evaluated two harvesters, five stands, and three harvest methods, the results and regression equations presented should be valuable to planners, managers, and loggers considering the use of CTL systems in Appalachian hardwoods.
AUTHOR CONTACT
Prof. Wang can be reached by e-mail at --
jx wang @wvu.edu
REFERENCES
[1] Aedo-Ortiz, D.M., E.D. Olsen, and L.D. Kellogg. 1997. Simulating a harvester-forwarder softwood thinning: A software evaluation. For. Prod. J. 47(5):36-41.
[2] Carruth, J.S. and J.C. Brown. 1996. Predicting the operability of South Carolina coastal plain soils for alternative harvesting systems. USDA For. Serv. Gen. Tech. Rep. NC-186. 8 p.
[3] Chiorescu, S. and A. Gronlund. 2001. Assessing the role of the harvester within the forestry-wood chain. For. Prod. J. 51(2): 77-84.
[4] Conradie, I.P., W.D. Greene, and G.E. Murphy. 2003. Value recovery with harvesters in southeastern USA pine stands. In: Proceedings of 26th Annual COFE Meeting, Bar Harbor, Maine. Sept. 7-10, 2003.
[5] Eliasson L. 1998. Simulation of thinning with a single-grip harvester. For. Sci. 45 (1): 26-34.
[6] Gellerstedt, S. and B. Dahlin. 1999. Cut-to-length: The next decade. J. For. Eng. 10(2): 17-25.
[7] Greene, W.D., B.D. Jackson, and J.D. Culpepper. 2001. Georgia's logging businesses, 1987 to 1997. For. Prod. J. 51(1): 25-28.
[8] Hartsough, B.R. and D.J. Cooper. 1999. Cut-to-length harvesting of short-rotation Eucalyptus. For. Prod. J. 49(10): 69-75.
[9] Hartsough, B.R., X. Zhang, and R.D. Fight. 2001. Harvesting cost model for small trees in natural stands in the interior northwest. For. Prod. J. 51(4):54-60.
[10] Huyler, N. K. and C. B. LeDoux. 1996. Cut-to-length harvesting on a small woodlot in New England: A Case Study. Gen. Tech. Rep. NC-186. St. Paul, MN: USDA Forest Service, North Central Experiment Station. pp. 102-108.
[11] Huyler, N.K. and C. B. LeDoux. 1998. Application of cut-to-length harvesting in a small suburban woodlot in Vermont. The Northern Logger and Timber Processor. 5 pp.
[12] Huyler, N.K. and C.B. LeDoux. 1999. Performance of a cut-to-length harvester in a single tree and group selection cut. Research Paper NE-711, USDA Forest Service, Northeastern Research Station, Radnor, PA. 6pp.
[13] Lanford, B. and B.J. Stokes. 1995. Comparison of two thinning systems. Part 1. Stand and site impacts. For. Prod. J. 45 (5): 74-79.
[14] Lanford, B. and B.J. Stokes. 1996. Comparison of two thinning systems. Part 2. Productivity and costs. For. Prod. J. 46 (11/12): 47-53.
[15] LeDoux, C.B. and N.K. Huyler. 2001. Comparison of two cut-to-length harvesting systems operating in eastern hardwoods. J. For. Eng. 12(1): 53-59.
[16] LeDoux, C.B. 2002. Assessing the feasibility and profitability of cut-to-length harvests in Eastern hardwoods. In: Proceedings of the Eastern CANUSA Forest Science Conference. October 19-20, 2002. Orono, Maine.
[17] Long, C. 2003. Production and cost analysis of two harvesting systems in central Appalachia. M.S. Thesis. Division of Forestry, West Virginia University, Morgantown, West Virginia, USA. 80pp.
[18] McNeel, J. and D. Rutherford. 1994. Modeling harvester-forwarder system performance in a selection harvest. J. For. Eng. 6(1): 7-14.
[19] Milauskas, S. and J. Wang. 2003. A survey of West Virginia logger characteristics. In: Proceedings of 26th Annual COFE Meeting, Bar Harbor, Maine. Sept. 7-10, 2003.
[20] Miyata, E.S. 1980. Determining fixed and operating costs of logging equipment. USDA For. Serv. Gen. Tech. Rep. NC-55. 16 pp.
[21] Schnur, L.G. 1937. Yield, stand, and volume tables for even-aged upland oak forests. Tech. Bull. No. 560. U.S. Department of Agriculture, Washington, D.C . 87 pp.
[22] Spinelli, R., P. Owende, and S.M. Ward. 2002. Productivity and cost of CTL harvesting of Eucalyptus globulus stands using excavator-based harvesters. For. Prod. J. 52(1): 67-77.
[23] Talbot, B., T. Nordfjell, and K. Suadicani. 2003. Assessing the utility of two integrated harvester-forwarder machine concepts through stand-level simulation. Int. J. For. Eng. 14(2): 31-43.
[24] Tufts, R.A. and R.W. Brinker. 1993a. Valmet's Woodstar series harvesting system: A case study. South. J. Appl. For. 17(2): 69-74.
[25] Tufts, R.A. and R.W. Brinker. 1993b. Productivity of a Scandinavian cut-to-length system while second thinning pine plantations. For. Prod. J. 43(11/12): 24-32.
[26] Tufts, R.A. 1997. Productivity and cost of the Ponsse 15-series, cut-to-length harvesting system in southern pine plantations. For. Prod. J. 47(10): 39-46.
[27] Wang, J., W.D. Greene, and B. Stokes. 1998. Stand, harvest, and equipment interactions in simulated harvesting prescriptions. For. Prod. J. 48(9): 81-86.
[28] Wang, J. and W.D. Greene. 1999. An interactive simulation system for modeling stands, harvests, and machines. J. For. Eng. 10(1): 81-89.
[29] Wang, J. and C.B. LeDoux. 2003. Estimating and validating ground-based timber harvesting production through computer simulation. For. Sci. 49(1): 64-76.
[30] Wang, J., Y. Li, and G. Miller. 2002. A 3D stand generator for central Appalachian hardwood forests. In: Proceedings the IUFRO S4.11 Conference on Symposium on Statistics and Information Technology in Forestry, Blacksburg, Virginia, Sep. 8-13, 2002.
[31] Wester, F. and L. Eliasson. 2003. Productivity in final felling and thinning for a combined harvester-forwarder (Harwarder). Int. J. For. Eng. 14(2): 45-50.