Vol. 15 No. 1 January 2004
M. J. Wood
R.A. Douglas
R. Sands
University of Canterbury
Christchurch, New Zealand
The authors are, respectively, Post-doctoral Research Fellow, Senior Lecturer, and Head of School, The New Zealand School of Forestry.
ABSTRACT
Three methods for measuring the density of a forest soil were compared: sampling with a traditional hand-held soil sampler and thin-wall (Shelby) tubes, and testing with a single-probe nuclear moisture-density gauge. An incremental approach was used when sampling with the nuclear gauge. Values of wet density for the soil layer between the source and the sensor were then recast for individual soil layers and converted to dry densities using the water contents provided by either the hand-held soil sampler or Shelby tubes. Shelby tube and nuclear gauge derived values of dry density were strongly related (R2 = 0.80), values derived from the hand-held soil sampler and nuclear gauge less so (R2 = 0.66). The nuclear gauge proved the most economical in use by a factor of about two, and data collection with the Shelby tube sampler and nuclear gauge was quicker when compared to the traditional hand-held soil sampler by a factor of about two. Sample compression associated with the Shelby tubes was corrected for when calculating the final density values. However, the degree of sample disturbance associated with the hand-held soil sampler was uncertain. The advantages and disadvantages of each method are discussed.
Keywords: hand-held soil sampler, soil coring, nuclear moisture-density gauge, thin-wall sampler, Shelby tubes.
INTRODUCTION
The scope of forest soil compaction studies is often limited by constraints such as time, money and labour, and those imposed when working under `normal' operational conditions, especially on harvesting sites where sufficient experimental control might be lacking. Furthermore, the collection of data relating to the physical characteristics of the soil is often difficult and laborious, especially where physical sampling is carried out, and the resulting data are subject to a range of potential errors particular to the sampling methodology. Despite a spectrum of established techniques, previous studies have generally relied upon a single approach, trusting that the results are, at the very least, indicative of the real situation in the field. This is particularly true when measuring soil bulk density, values of which are important in studies of soil compaction, site traffickability and the construction of roading and drainage networks.
Traditionally, physical sampling has been used to determine the density of soils [1], In general, values of dry density are preferred, which in addition to remaining constant irrespective of changes in weather and soil water content, allow the simultaneous calculation of water content and porosity. Core extraction, where a metal cylinder of known volume is pushed, turned or hammered into the ground to the depth of interest, is considered the standard approach [8]. On removal, the sample is retained inside the cylinder, the edges trimmed and the sample sealed, and both density and water content determined in the laboratory upon drying at 105 oC to a constant mass. The key factor limiting the success of this method is the accurate determination of sample volume due to compression of the sample during collection [6, 1], whilst coarse fragments, organic matter and the loss of water from the sample during storage add further uncertainty. Raper and Ebrach [10] concluded that "...it is disturbing that a method with this many inherent errors is referred to as standard".
A different approach to soil sampling, common to larger scale geotechnical studies, is to use a thin-wall sampler, or Shelby tube, the latter being the trade name for the seamless steel tubing from which the sampler is made. Steel tubes, typically of around 76 mm outside diameter and 2 mm wall thickness, are pushed hydraulically into the ground at a constant speed [3]. The sampler is then removed and sealed with the soil retained inside before transport to the laboratory where the soil is removed from the sampler using a hydraulic or geared piston extractor prior to analysis.
In recent years, the development of nuclear gauges which measure the attenuation or backscatter of radiation by soil, have provided a potentially superior, and non-destructive, means of measuring soil density or water content. The effectiveness of early models was limited principally by questions relating to safety, the size and weight of the instruments, and inconsistencies in the measurement of attenuation or backscatter [1]. Over the years, improvements in design have meant that data collection is now much quicker and more reliable than before, and with limited soil disturbance, these gauges allow repeat testing of the same soil over time [12].
In a discussion with the authors, a colleague once stated with no justification that they "would trust a small soil core [sample], collected by hand, over any other method of determining the bulk density of a forest soil". A large scale investigation of the effects of forest harvesting traffic [13, 14] afforded an opportunity to test the validity of this statement. This paper presents a comparison of three different methods for determining soil bulk density: (1) sampling with a traditional hand-held soil sampler, (2) sampling with thin-wall (Shelby) tubes, and (3) testing with a single-probe nuclear moisture-density gauge. The overall costs of each method, both financial and in terms of labour input, were considered along with the key practicalities during use in studies of forest soil compaction. The results provided by each method were compared, and the extent to which the nuclear gauge could be relied upon to give accurate density information for the broader site area using the factory supplied calibration was demonstrated.
METHODS
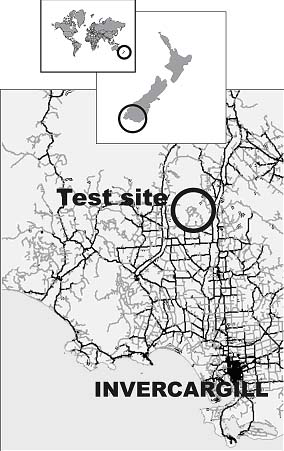
The area chosen for the study was located within Taringatura Forest (3000 ha), 50 km north of Invercargill, New Zealand (Figure 1). The site (Block 308), at an elevation of 460 m and with a southerly aspect, contained mature, even-aged Radiata pine (Pinus radiata D. Don) planted in 1972 at approximately 3 x 3 m spacing. The soil, a stony silt-loam over greywacke and loess [9], was typical of the broader forest area. The site was harvested during October 2001 using a steel tracked excavator with a mechanised felling head mounted on the boom, and a Timberjack 1270B forwarder.
Figure 1. Location of experimental site.
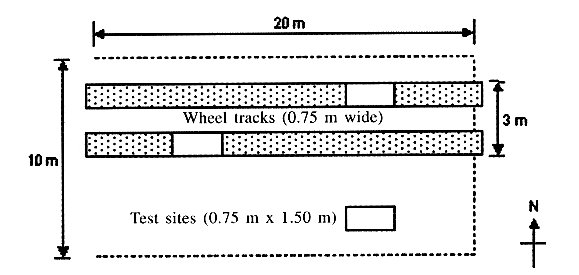
The broader study [13, 14], comprised observations of the effects on soil properties of three machines at four trafficking intensities (1, 3, 10 and 30 passes), each applied to a separate plot of previously untrafficked ground (20 m x 10 m), and replicated twice under dry (Trial 1 - November 2001) and wet (Trial 2 - June 2002) conditions. In addition, an area of untrafficked ground was retained within each plot to provide control (0 machine pass) data. In total, 48 experimental plots were required. These were identified prior to harvesting, and were cleared in such a way as to minimise ground disturbance: trees were felled motor-manually and whole trees lifted from each plot mechanically without trafficking the ground. Two plots were abandoned during Trial 1 and three plots were rejected during Trial 2 due to either water logged ground conditions or inadvertent trafficking when the site was originally cleared. The layout of each plot is illustrated in Figure 2. Test sites of 0.75 m x 1.50 m within each plot were located so as to avoid obvious rocks and large roots, and the ground prepared by removing any loose litter with a garden rake and logging debris to expose the upper soil surface.
Figure 2. Plot layout (not to scale).
During Trial 1, bulk soil samples were collected from the 0-5 cm, 5-10 cm, 10-15 cm and 15-20 cm depths from the untrafficked area of a single randomly chosen plot. These were used to determine organic matter content (OM gg-1), specific gravity (Gs) and particle size distribution (% sand, silt and clay) using standard laboratory techniques: loss on ignition at 550 oC over 24 hrs, and pycnometer and hydrometer methods respectively. The three methods used to measure soil density are described below.
Hand-Held Soil Sampling
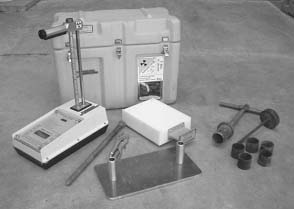
The hand-held soil sampler used in this study is shown in Figure 3. The outer cylinder of the main unit (61 mm outside diameter) had a bevelled cutting edge of 30o, and housed a smaller brass coring ring of 50 mm length, 54 mm inside diameter and 1.75 mm wall thickness. In use, the sampler was hammered into the soil at the depth of interest. The surrounding soil was cleared with a spade so that each subsequent depth increment could be sampled in the same way. On collection, each sample was retained in the brass cylinder, wrapped in aluminium foil and weighed within 8 hours of collection (± 0.01 g) to account for any water loss during subsequent transit and storage, prior to laboratory determination of water content and dry bulk density. In the laboratory, the foil wrapping for each sample was included during weighing and drying to account for any condensed moisture.
Figure 3. The nuclear moisture-density gauge and hand-held soil sampler.
During Trial 1, soil samples were collected from the untrafficked test sites of eight designated plots at 0-5 cm, 5-10 cm, 10-15 cm and 15-20 cm (n = 1 sample per depth increment per plot, total samples = 32). Laboratory determination of wet (ρ) and dry (ρd) density, and gravimetric water content (Θ) was based upon weighing and drying at 105 oC for 48 hours using;
 [Eqn. 1]
 [Eqn. 2]
 [Eqn. 3]
where M was the mass of wet soil (g), V the volume of the soil (cm3), Ms the mass of dry soil (g) and Mw the mass of water (g).
Nuclear Moisture-Density Gauge
The nuclear gauge used in this study, a Humbolt HS-5001EZ nuclear moisture-density gauge, is shown in Figure 3. At each test site, and in addition to the preparation described above, the soil surface where the gauge was to be positioned was levelled using a spade. A steel rod (50 cm length, 22 mm diameter) was then driven vertically through a guide plate into the ground to a depth of 35 cm. The rod was then removed using a vice grip wrench, and the gauge positioned so that the radioactive source rod (cesium-137), could be lowered into the access hole to a maximum operable depth of 30 cm. After a standard period of 1 minute the gauge returned values of wet density based upon the attenuation of gamma radiation across the soil layer between the source and the sensor, the latter housed in the base of the gauge (Figure 4). The gauge was compatible with automated data logging equipment although this was not available to the authors. Data were recorded manually and later entered into a spreadsheet.

During Trial 1, wet density data were collected from the untrafficked test site of each of the eight designated plots at 0-5 cm, 0-10 cm, 0-15 cm and 0-20 cm depths (n = 2 samples per depth increment per plot, total samples = 64). During Trial 2, and to match the broader coverage of the experimental site afforded by the Shelby tube sampler, wet density data were collected from all 21 plots at 0-10 cm and 0-20 cm depths from the untrafficked test sites (n = 1 sample per depth increment per plot, total samples = 42) and trafficked test sites (n = 2 samples per depth increment per plot, total samples = 84). The depth increment was increased from 5 cm to 10 cm to improve sampling speed. The wet densities for each individual depth increment, 5 cm increments during Trial 1 and 10 cm increments during Trial 2, were then determined by disaggregation of the original data using;
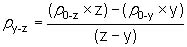 [Eqn. 4]
where ρy-z was the wet density for the depth increment y-z (see Figure 4). Values of dry bulk density for the nuclear gauge were then calculated using;
 [Eqn. 5]
where the gravimetric water content for that depth increment was that determined by either the hand-held soil sampler (described above) or Shelby tube sampler (described below).
In addition to wet density, the gauge measured water content (%) based on the backscatter of neutron radiation (americium-241) at each test site. This was used by the gauge when automatically calculating values of dry density. Both the neutron source and the sensor were housed within the base of the gauge (Figure 4) and there was no way of accurately determining the depth, or neutron sphere of influence, within which the water content data related. As a result, values of water content and dry density were not recorded given the desire to record the soil layer densities incrementally. The design limitations of this are considered in the discussion.
Shelby Tube Sampling
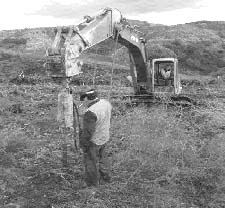
During Trial 2, Shelby tubes were used to collect soil samples (Figure 5). Each tube, with an inside diameter of 72 mm and 2 mm wall thickness, and with a bevelled cutting edge of 30o, was attached to the boom of a tracked-excavator and pushed vertically into the ground at a constant rate of approximately 0.5 m min-1 to a maximum depth of 30 cm. This limit was based upon pre-trial testing where, at depths of around 50 cm, the tube occasionally encountered large rocks leading to deformation of the cutting edge and scoring of the soil sample within the tube. A small number of Shelby tube samples from depths of 50 cm depth were successfully collected, and included in subsequent analyses. The boom connection had been modified to allow the tube to be rotated a full 360o once the final depth (Dfinal) had been reached (Figure 6a). This action sheared the base of soil sample, ensuring the sample was retained in the tube as it was withdrawn. The length of the soil sample within the tube (Lcore, Figure 6a) was recorded and the tube ends sealed for transportation.
Figure 5. Shelby tube sampling.
At each of the 21 plots, Shelby tube samples were collected from the untrafficked test sites (n = 1 tube per plot, total tubes = 21) and trafficked test sites (n = 2 tubes per plot, total tubes = 42). In the laboratory, the soil sample from each tube was removed using a hand-operated hydraulic extractor. In some cases, a thin layer of `duff' comprising loose litter and partially decomposed humic material was removed from the top of the sample, Lduff, this was subtracted from both Dfinal and Lcore. The soil sample from each tube was then divided into samples of 5 cm length and the total length of the soil sample recovered from the tube recorded (Ctotal, Figure 6b). Samples of less than 5 cm length were omitted from subsequent analyses. Determination of wet and dry soil bulk density, and gravimetric soil water content, was then completed for each 5 cm sample using Eqns. 1-3. Where a large stone spanned the boundary between two 5 cm samples (e.g., at 10 cm between the 5-10 cm and 10-15 cm samples), the proportion of the stone occupying each sample was estimated and recorded as a ratio (e.g., 1:2, where one-third of the stone occupied the 5-10 cm sample and two-thirds of the stone occupied the 10-15 cm sample). The stone was weighed and dried, and the wet and dry weights of the original two samples corrected accordingly.
Figure 6. Schematic for Shelby tube sampling and sample recording
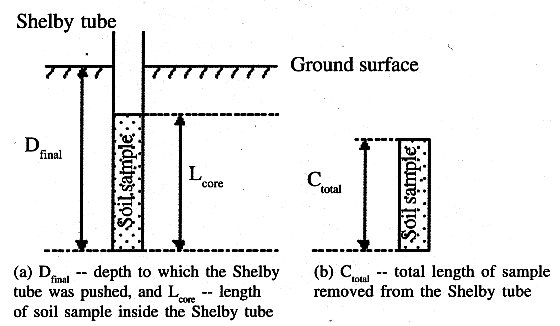
To account for differences between Dfinal and Ctotal, a result of compression of the soil sample during collection and removal, a correction factor (f) was applied when calculating the final values of ρ and ρd where;
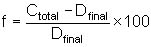 [Eqn.6]
and
ρ or
ρd 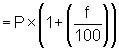 [Eqn.7]
where P was the uncorrected value. The 5 cm raw data were then combined to provide samples of 10 cm increments for comparison with the nuclear gauge.
Assessing Disturbance To The Soil Sample During Collection
When a cylinder is used to collect a soil sample, the degree of sample compression may be characterised by calculating the area ratio (Ca) using;
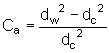 [Eqn. 8]
where dw is the external diameter of the cylinder and dc is the internal diameter of the cylinder [2]. Expressed as a percentage, this technique was used to compare disturbance levels for both the hand-held soil sampler and the Shelby tube samples. Additionally for the Shelby tubes, the level of compression in relation to the depth to which the tube was pushed, was also assessed by comparing Dfinal, Lcore and Ctotal.
RESULTS
Overall Cost and Time Requirement of Each Method
The overall costs and time requirements of each method used in this study are summarised in Table 1. Given the assumptions regarding capital costs, and on a per sample basis, the nuclear gauge proved the most economical in this study. In terms of man-hours, and again on a per sample basis, the nuclear gauge and Shelby tube methods were approximately twice as quick as the hand-held soil sampling method. For the Shelby tubes, preparation of the samples in the laboratory was labour intensive as the soil sample had to be carefully removed from the steel tube with a hydraulic extractor before division into 5 cm long sections.
Table 1: Cost (US $) and time requirement of each sampling method.
Hand-held sampler | Nuclear gauge | Shelby tubes |
|||||
| Cost($) | Time(hrs) | Cost($) | Time(hrs) | Cost($) | Time(hrs) | ||
| Capital/project1 | 15 | - | 146 | - | - | - | |
| Disposables2 | 6 | - | - | - | 366 | - | |
| Machine hire3 | - | - | - | - | 671 | - | |
| Technician4: | field | 244 | 8 | 732 | 24 | 488 | 16 |
| laboratory | 61 | 2 | - | - | 1068 | 35 | |
| data entry | 61 | 2 | 244 | 8 | 244 | 8 | |
| TOTALS | 387 | 12 | 1122 | 32 | 2837 | 59 | |
| Total samples | 32 | 190 | 265 | ||||
| Cost and time/sample5 | 12.09 | 00:23 | 5.91 | 00:10 | 10.70 | 00:13 | |
All costs calculated originally in NZ $ and coverted to US $ for presentation (based on exchange rate of 0.61 at the time of going to press), 1assumes respective pieces of equipment and/or instruments are used for 5 projects/year over 10 years, 2hand-held sampler: foil for sealing samples, Shelby tubes: tubes and tape for sealing samples, 3includes machine mobilisation and demobilisation, machine rental, operator and labourer, 4assumes hourly rate of US$30.5 (based on hourly rate of NZ$50 at the time the study was carried out), 5assumes that the nuclear gauge is used independently.
Assessing Disturbance For Each Sampling Method
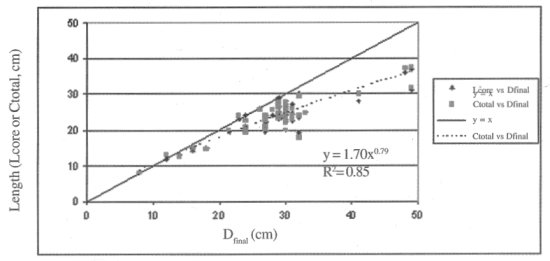
The area ratios for the hand-held soil sampler and Shelby tubes were 28% and 11% respectively [Eqn. 8], suggesting a much higher level of sample disturbance for the hand-held sampler. For the Shelby tubes, the relationships between Dfinal, Lcore and Ctotal are illustrated in Figure 7. The majority of sample compression took place during collection (Lcore vs Dfinal), and the difference between Lcore vs Dfinal increased with depth. Removal of the soil sample from the Shelby tube using the extractor did little to further compress the soil sample (Ctotal vs Dfinal). In a small number of cases, soil cores were observed to expand during removal from the Shelby tube. This was attributed to either elastic rebound or slight inaccuracies in the measurement of Dfinal and Lcore in the field.
Figure 7. The relationship between sample depth and sample compression for the Shelby tube sampler.
Soil Physical Properties
Soil physical properties for the site are summarised in Table 2. Gravimetric water contents for each trial decreased with depth, and were considerably higher throughout Trial 2, particularly for the 0-5 cm layer. Organic matter content decreased with depth, particle size distribution was consistent throughout the 0-20 cm depth.
Table 2: Soil physical properties.
| Trial 1 | Trial 2 | |||||||||
| 0-5 cm | 5-10 cm | 10-15 cm | 15-20 cm | 0-5 cm | 5-10 cm | 10-15 cm | 15-20 cm | |||
| *Θ gg-1 | Mean | 0.55 | 0.46 | 0.42 | 0.42 | 0.67 | 0.49 | 0.44 | 0.41 | |
| Std (n) | 0.09 (8) | 0.04 (8) | 0.05 (8) | 0.04 (8) | 0.12 (21) | 0.10 (21) | 0.08 (20) | 0.09 (20) | ||
| OM gg-1 | Mean | 0.22 | 0.18 | 0.16 | 0.15 | - | - | - | - | |
| Std (n) | 0.00 (4) | 0.00 (4) | 0.00 (4) | 0.00 (4) | - | - | - | - | ||
| Gs | Mean | 2.71 | 2.67 | 2.73 | 2.70 | - | - | - | - | |
| Std (n) | 0.02 (4) | 0.02 (4) | 0.01 (4) | 0.02 (4) | - | - | - | - | ||
| % Sand | Mean | 27 | 28 | 30 | 28 | - | - | - | - | |
| Std (n) | 0.82 (4) | 1.83 (4) | 0.50 (4) | 3.77 (4) | - | - | - | - | ||
| % Silt | Mean | 30 | 32 | 30 | 30 | - | - | - | - | |
| Std (n) | 1.50 (4) | 1.83 (4) | 0.50 (4) | 2.52 (4) | - | - | - | - | ||
| % Clay | Mean | 43 | 40 | 40 | 43 | - | - | - | - | |
| Std (n) | 1.26 (4) | 0.00 (4) | 0.00 (4) | 2.87 (4) | - | - | - | - | ||
*from the untrafficked areas using samples collected with the hand-held soil sampler and Shelby tube samplers.
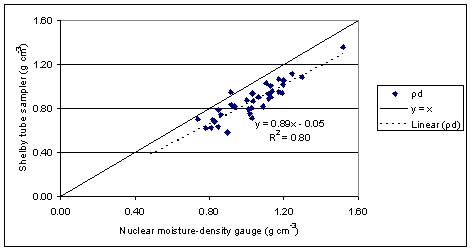
The relationship between the nuclear gauge and hand-held soil sampler derived ρd, and nuclear gauge and Shelby tube derived ρd, are illustrated in Figures 8a and 8b respectively. Agreement between the Shelby tube and nuclear gauge (R2 = 0.80) was stronger than that between the hand-held soil sampler and nuclear gauge (R2 = 0.66). In addition, the relationship between the nuclear gauge and Shelby tube derived ρd (Trial 2) lay much closer to the expected (y = x) than did that between the nuclear gauge and hand-held soil sampler (Trial 1). The nuclear gauge appeared to overestimate ρd, though this may have been due to underestimation of ρd by the hand-held soil sampler or Shelby tubes, or indeed, a combination of both.
Figure 8a. Hand-held soil sampler vs nuclear gauge at Trial 1 (n - 32).
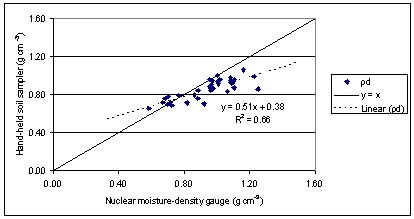
Figure 8b. Shelby tube sampler vs nuclear gauge at Trial 2 (n - 36).
DISCUSSION
Overall Cost and Time Requirement of Each Method
Given the assumptions of this study regarding overall capital costs, the investment in the nuclear gauge and/or hand-held soil core sampler were readily justified and should be well within the budget of major projects. It is worth noting that additional costs not encountered in this study may include licensing and staff training, provision of storage for the gauge and transport costs, all of which vary internationally and from one study to the next. These assumptions are somewhat conservative and in reality, both the hand-held soil sampler and nuclear gauge would probably be used more than 5 times each year, with regular servicing and maintenance extending their useful lives beyond 10 years, thereby reducing the capital cost per project further still. Furthermore, each Shelby tube may be used several times before replacement, again reducing the overall cost of this approach.
Practicalities In Use
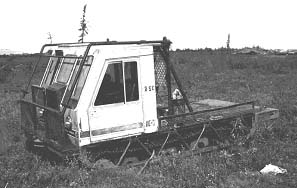
Sampling with the Shelby tubes was the most practical. Empty tubes were loaded onto the excavator at the start of the day, samples from each plot were readily extracted, and each sealed tube containing the soil sample was then returned to the excavator and carried off the site. In this study, mounting the hydraulic rig on the end of the boom allowed the excavator to reach into the plot without further disturbing the ground. Unfortunately, the rigid steel tracks of the excavator were not wholly suited to the terrain. The soft ground made it difficult for the excavator to maintain traction, and on one occasion, a track was pulled off by a tree stump. This required a second machine to be brought on to the site to mobilise the excavator (at the cost of the supplier, time and labour requirements therefore not included in Table 1). More appropriate to this type of terrain are the rubber tracked `Nodwell' or `Bombardier' carriers. Used in many geotechnical studies, both vehicles employ flexible rubber tracks with steel grousers, running over independent axles (Figure 9). Alternatively, mounting the hydraulic rig on a skidder would prove just as effective.
Figure 9. A Bombardier used to carry geotechnical sampling equipment.
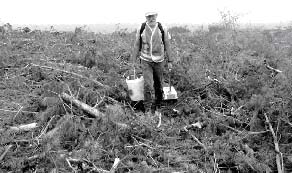
Sample collection with the hand-held soil sampler was straight forward though laborious, as was preparation of each test site. Furthermore, transporting the sampler, the materials for preparing each test site, and a growing collection of samples, proved onerous due to the uneven ground and presence of slash. The same was true for the nuclear gauge (Figure 10), though the process of data collection and recording was simple and quick. It is worth noting that in addition to soil density and water content, both the hand-held soil sampler and Shelby tubes yielded a physical sample, allowing the determination of additional soil properties such as organic matter content, particle density and soil texture.
Figure 10. The nuclear moisture-density gauge in use.
The single-probe nuclear gauge used in this study measures the attenuation of gamma radiation between the source and the sensor. This alone provides a measure of wet density, averaged over the soil layer between the source and the ground surface. In addition, the gauge provides a simultaneous measure of water content based upon the thermalisation (slowing down) and subsequent backscatter of neutron radiation. This is used in the calculation of dry density. Both the neutron source and sensor are fixed relative to, and shielded from, each other in the base of the gauge, creating a sphere of influence. Typically, this decreases in size with increasing water content [8], with a radius ranging between 7.5 cm to 50 cm [4, 5 respectively]. Despite this uncertainty, a single-probe nuclear gauge of this design is well suited to geotechnical applications such as road building where soil properties are relatively uniform both throughout, and beyond, the sphere of influence.
In a review of nuclear gauge technology, [1] stated that the single-probe gauge could not be used to examine individual soil layers, and required calibration for each soil type and soil layer measured. Furthermore, uncertainty regarding the neutron sphere of influence meant that values of water content could not be considered of sufficient accuracy in a study such as this where soil water content varied significantly with depth, and where the investigators were interested in the properties of individual soil layers.
However, the incremental sampling approach used in this study meant that the nuclear gauge derived wet density data were easily recast for each individual depth increment, or soil layer. Moreover, simultaneous sampling with both the hand-held soil sampler and Shelby tubes meant that values of dry density could calculated for the nuclear gauge, and comparison with the hand-held soil sampler and Shelby tube derived dry densities proved the factory supplied calibration (for values of wet density) to be sufficient.
Nuclear gauges, in combination with destructive soil sampling to provide a measure of water content, have been used successfully in forest soil studies [11, 7]. However, to the authors' knowledge there is no device available as yet that gives a non-destructive and simultaneous in situ measure of density and water content for the surface soil layers at a range of spatially precise depth increments. Given that potential benefits of the single-probe nuclear gauge including the speed of data collection, the ability to recast the data for individual soil layers, and overall accuracy of the collected data, the incorporation of current technologies such as Time Domain Reflectrometry, which can give an instantaneous and spatially precise measure of water content, would be of great benefit.
Sample Disturbance and Values of Soil Density
In geotechnical engineering, an area ratio of = 10% is considered acceptable for a sample of first class quality, for classification, water content, density, shear strength, deformation and consolidation tests [2]. Based on this alone, sample disturbance associated with the Shelby tube samplers (area ratio 11%) was considered acceptable, whilst that associated with the hand-held soil sampler (area ratio of 28%) was unacceptable. The stronger agreement between the nuclear gauge and Shelby tube samples was indicative of the reduced levels of sample disturbance associated with the Shelby tube approach compared to the hand-held soil sampler.
Sample compression was a feature of the Shelby tube samples in this study. This was accounted for when calculating the final density values, though the correction factor described in Equations 6 and 7 involved a number of assumptions, first that stony material underwent compression in the same way as the soil and second, that the compression was uniform along the length of each sample. However, this was considered adequate for the purpose of this study, and was preferable to leaving the data uncorrected.
In theory, the pattern of compression observed in the Shelby tubes, and illustrated in Figure 6, should apply to the samples collected with the hand-held soil sampler. However, the sampler was hammered into the ground until it was full, removing the option of applying the correction factor. To overcome sample compression, the inside diameter of the cutting edge may be reduced by around 1% compared to that of the main body of the sampler, thus reducing friction between that soil sampler and cylinder wall [2]. This was not a feature of either the commercially available hand-held soil sampler or of the Shelby tubes used in this study. Furthermore, and in addition to compression of the sample, hammering the cylinder into the ground can result in shaking or shattering of the soil sample, adding further uncertainty when considering the final values of density derived from the hand-held soil sampler.
This problem is overcome when the sampler is inserted slowly under a constant pressure, as was the case with the Shelby tube samplers used in this study.
Numerous texts suggest that the hand-held soil sampler allows the operator to assess the ease with which the brass ring is inserted into the ground providing, albeit subjectively, some measure of disturbance. If the level of disturbance is considered too great, for example where increased force is necessary to bypass small stones or roots, the investigator may reject the sample in favour of a further less disturbed sample at a nearby location. However, this approach removes objectivity from the sampling procedure, and the operator labours under the misconception that the soil samples are both `undisturbed' and `representative'.
CONCLUSION
The dry densities returned by the nuclear gauge and Shelby tube samplers used in this study were in agreement, whilst the accuracy of the hand-held soil sampler, traditionally the soil scientists tool of choice, was called into question given the high levels of sample disturbance and poor agreement with the nuclear gauge.
Ultimately, no single method of determining soil density can be considered absolute, and the authors recommend that wherever possible, cross-checking the data collected by one method with another should be considered when carrying out large scale studies, particularly where soil properties are highly variable.
The single-probe nuclear gauge performed well in this study, and compared to both the hand-held and Shelby tube samplers, was the least expensive by a factor of about two. The wet density data were quickly obtained and easily disaggregated for each soil layer, and in combination with simultaneous physical soil sampling, dry densities were readily determined for the near-surface layers. Incorporation of an instantaneous and spatially precise measure of water content such as Time Domain Reflectrometry would greatly extend the value of this type of gauge.
The Shelby tube sampling technique, borrowed from the broader discipline of geotechnical engineering, provided a less disturbed and more cost effective sample than the hand-held soil sampler, though attention to the terrain and ground conditions should be given when choosing the carrier of the Shelby tube sampling equipment.
ACKNOWLEDGEMENTS
The authors would like to thank the staff at Rayonier (New Zealand) for their assistance in providing the site used in this study, and their help throughout the trials.
AUTHOR CONTACT
Matthew Wood can be reached by e-mail at --
matthew.wood@forestrytas.com.au
REFERENCES
[1] Campbell, D.J. and J.K. Henshall. 1991. Bulk density. In: K.A. Smith and C.E. Mullins [Eds.]. Soil analysis physical methods. Marcel Decker Inc. New York. Pp. 329-366.
[2] Craig, R.F. 1997. Soil mechanics. 6th Edn. E and F. N. Spon.
[3] Coduto, D.P. 1999. Geotechnical engineering - principles and practices. Prentice Hall, USA.
[4] Erbach, D.C. 1987. Measurement of soil bulk density and moisture. Transactions of the ASAE. 30 (4): 922-931.
[5] Gardener, C.M.K., J.P. Bell,, J.D. Cooper, T.J. Dean, T.J. M.G. Hodnett, and N. Gardener. 1991. Soil water content. In: K.A. Smith and C.E. Mullins (Eds.). Soil analysis physical methods. Marcel Decker Inc. New York. pp 1-73.
[6] Hakansson, I. 1990. A method for characterising the state of compactness of the plough layer. Soil and Tillage Research. 16:105-120.
[7] Jakobsen, B.F. and E.L. Greacen. 1985. Compaction of sandy soils by forwarder operations. Soil and Tillage Research. 5:55-70.
[8] Jansson, K.J. 1999. Comparison of density and water content determinations using soil cores and a dual probe density gauge. International Journal of Forest Engineering. 10(2):83-90.
[9] Milne, J.D.G., B. Clayden, P.L. Singleton,and A.D. Wilson. 1995. Soil description handbook. Manaaki Whenua Press. Lincoln, Canterbury, New Zealand.
[10] Raper, R.L. and D.C. Ebrach. 1985. Accurate bulk density measurement using a core sampler. American Society of Agricultural Engineers Paper No 85-1542.
[11] Sidle, R.C. and D.M. Drlica. 1981. Soil compaction from logging with a low-ground pressure skidder in the Oregon Coast Ranges. Soil Science Society of America Journal. 45:1219-1224.
[12] Steel, J.G., J.L. Koger, A.C. Trouse, and D. Sirois. 1983. Core verses nuclear gauge methods of determining soil bulk density and moisture content. USDA Forest Service, Southern Forest Experiment Station Research Note No. SO-295.
[13] Wood, M.J., R. Sands, and R.A. Douglas. 2001. Forest soil compaction and long-term site productivity - further trials in New Zealand. WISPAS (Water in the Plant-Soil-Atmosphere System). 80 (Nov): p. 5.
[14] Wood, M.J., R. Sands, and R.A. Douglas. 2002. Forest soil compaction and long-term site productivity trials in New Zealand - an update. WISPAS (Water in the Plant-Soil-Atmosphere System). 83 (Nov): pp. 6-7.