 (1)
(1)Vol. 15 No. 1 January 2004
Jingxin Wang
West Virginia University
West Virginia, USA
Chris B. LeDoux
USDA Forest Service
West Virginia, USA
Mike Vanderberg
Joe McNeel
West Virginia University
West Virginia, USA
The authors are respectively, Assistant Professor, Division of Forestry, West Virginia University; Project Leader, Northeastern Research Station, USDA Forest Service; Former Graduate Research Assistant, and Director, Division of Forestry, West Virginia University.
ABSTRACT
Log damage was examined in terms of volume and value losses by harvesting system, function, tree species, and log size in four central Appalachian hardwood sites. Observations were made of all grade logs during the felling, skidding, decking/sorting, and loading operations. Sawlogs sustaining damage to the bark or cambium were recorded with additional information obtained for the location, dimensions, and type of damage. The data were analyzed statistically to determine significant differences of damage and to estimate the potential damage probability of a log given select operational variables. The results suggest that motor-manual harvesting systems caused more damage to logs than mechanized harvesting systems. Felling resulted in significantly more log damage when compared to skidding, decking, and loading operations. Results also suggest that the process of skidding, decking, and loading of logs has very little impact on damage levels. Volume and value losses of damaged logs were not sensitive to tree species and log size.
Keywords: Log damage, timber harvesting, forest operations, Appalachian hardwoods, feller-buncher, cable, grapple, skidder, chain saw, Quercus rubra, Quercus alba, Quercus prinus, Prunus serotina, Acer sacharrum, Liriodendron tulipifera.
INTRODUCTION
The value of forest products from the Appalachian hardwood region continues to grow as the demand for quality hardwood lumber increases. In addition, there have been substantial increases in demand for veneer type products - specifically laminated veneer lumber (LVL), structured composite lumber (SCL), and Parallama®1 from hardwood species such as yellow poplar (Liriodendron tulipifera) and soft maple (Acer rubrum). Where raw material and final product values are high, as is the case with many hardwood logs, the companies that require these logs as raw material for mill production have an expectation of quality in the raw material. The quality could be defined in part as accurate product dimensions for secondary manufacturing needs. Thus, the dimensions of a log delivered to a lumber manufacturing facility should meet the minimum specifications of top and bottom end diameters and total length. Additionally, the log should be free of any production-caused defects that would reduce its value in the lumber manufacturing process.
Previous studies indicate that some log damage can be controlled and significant gains in potential value can be achieved through a log quality control system. Williston [24] found that breakage and skidding/yarding damage associated with harvesting operations destroyed almost 6% of the total value of harvested logs. Craig [2] estimated that implementing a quality control program could increase returns by as much as 50% of the harvest value. Murphy and Twaddle [17] reported that nearly 40% of the standing value of a tree could be lost through degradation during the harvesting process.
There is no definitive set of criteria for what species are most affected during harvesting operations. Nor are there any studies in Appalachian hardwood forests that address the question of which harvesting process produces damage in harvested logs. Most of the previous studies have considered harvesting operations where only one or two tree species of timber were harvested. McNeel and Copithorne [14] stated that species is a factor in defining the amount of breakage expected during harvest. They reported that the more brittle species such as western red cedar (Thuja plicata) exhibited significantly more damage than the less brittle species. In central Appalachia, there are dozens of tree species being harvested from individual sites and each species has different manufacturing criteria.
Damage to harvested trees or logs can occur during the felling, bucking, skidding, decking, loading, and hauling functions of the timber harvesting process. Shear damage to butt logs has been studied extensively. Gallagher et al. [7] compared shear cuts with chainsaw felling and found that shears cut lower stumps and were more productive than chainsaws but often caused more damage to butt logs. Chainsaw fallers many times damaged the upper logs of the fallen tree stems and the residual trees in central Appalachian hardwood stands as well [12]. McMorland and Guimier [16] found that shears cause very many but shallow splits, while sawchains cause less frequent but deeper splits.
Greene and McNeel [8, 9] and Faust and Greene [6] reported log damage by feller-bunchers with both shear and saw heads and found that the damage usually occurred in the first twelve inches of the butt log. They noticed that shear felling heads left lower stumps in the woods, but the average stump height for a shear head was only an inch lower that the average stump height for a feller-buncher equipped with a saw head. They also indicated that lumber sawn out of a butt log with shatter could lose up to 42% of its tensile strength near the butt end, and that small feller-bunchers with saw heads could be up to 35% more productive than feller-bunchers with shears. Damage to logs harvested with feller-bunchers equipped with shears was also costly. Volume losses of up to 4.5% were typical when using shears, while losses of only 0.25% were found when operating with a saw head [9].
Compared to the other types of damage caused by shears such as splits and stump-pull, shatter in southern yellow pine is the most detrimental to butt log quality [13]. In the subsequent sawmilling operations, shatter could in most instances be removed with the allowance of approximately six inches of trim [22]. They also found that shear damage became worse after the log was sawn into lumber and dried. The total value loss from shear-damaged logs could be up to 13% [15]. The use of saw heads can be justified by the loss of value experienced when using feller-buncher equipped with shears. Also, feller-bunchers equipped with bar saws might have an advantage over chainsaw felling in Appalachian hardwood forests where the majority of the harvests are partial removals [11], because these machines have the ability to lay the fallen tree stems on the ground without damaging the upper logs of surrounding trees.
Improper bucking might not damage the log in a physical sense, but it could damage the potential value gained from bucking correctly [19, 21, 25]. Although little or no physical damage occurs to the harvested logs during bucking, potential value can be lost in a single bucking cut. In the Appalachian hardwood forest region, the concept of an optimal bucking process is logical, especially when many of the logs harvested in the region will be sawn into hardwood lumber. The implementation of correct log bucking procedures can potentially increase the yield from each tree harvested, which correspondingly can improve profits for the logger and the sawmill.
Ground-based extraction by rubber-tired skidders or tracked carriers is the most commonly used method in central Appalachian hardwood forest region [4]. Dragging the logs over the ground could present some type of potential damage to the harvested logs. Skidding full-length trees during partial harvests can also contribute to log breakage in certain situations, such as when skidding through switchbacks. Contamination of the logs with dirt is also a skidding problem that causes some extra wear on sawmilling equipment. The amount of damage due to skidding also depends on the amount of undergrowth and debris in the skid trails, the skid trail layout, density of the residual stand, and other site conditions.
Skidders, dozers or a loader can be used to deck logs. Potentially, logs might be damaged during the decking process. Logs may be pushed into each other by a skidder and damaged in different ways. Logs might sustain damage from the grapple of a knuckle-boom loader by pinching or puncturing the logs rather than grabbing them whole. In most cases logs are loaded onto trucks at the landing. In central Appalachia, a knuckle-boom loader with a grapple attachment usually loads logs. Potential damage might include grapple pinches, gouges, and breakage caused by lifting logs incorrectly. The potential for damage during the hauling process is limited, yet some does occur. Logs could be potentially damaged during hauling by pinches and any breakage caused by binding down the logs to the truck.
Damage can be considered anything that detracts value from the harvested log or tree. This can include physical wounds to the logs caused by any of the harvesting functions, as well as excessive or insufficient trim or any other improper decision made during the log bucking process. Damage may not affect the value of logs that are going to be sold to a paper mill, oriented strand board (OSB) plant, or to other wood composite facilities. Damage, however, will affect the potential value of logs that are going to be sold as sawlogs and veneer logs to a sawmill, or peeler logs going to a wood composite facility. This is especially true when dealing with manufacturing grade hardwood lumber.
Log damage to hardwood logs is especially important in the central Appalachian hardwood forest region, where much of the hardwood timber harvested is sawn into grade lumber or turned into veneer or veneer-based composites. The length of each log, as well as the superficial condition of the log is important to its potential grade and, thus, to the value recovered from it in the form of lumber or veneer.
The objectives of this study were to:
MATERIAL AND METHODS
Log damage was studied with two harvesting systems on four different central Appalachian hardwood forest sites. Harvesting functions investigated included felling, skidding, decking, and loading. The chainsaw felling and cable skidder operation is referred to as the motor-manual harvesting system that operated on two sites while the mechanized system using the feller-buncher and grapple skidder operated on the other two sites (Table 1). Bucking was done with chainsaws at the stump for the two harvesting systems. However, the volume and value losses associated with sub-optimal bucking were not examined in this study. The operator's experience for using chainsaws or driving feller-bunchers varied from 3 to 12 years. Their years of experience ranged from 5 to 39 for skidder operators and from 1 to 25 for loader operators, respectively (Table 1).
Table 1: Harvesting machines and operators' experience by site.
| Site 1 | Site 2 | Site 3 | Site 4 | |
Felling |
||||
| Machine | Timbco 425-D Hydro-Buncher w/bar saw | Husqvarna 385XP | Husqvarna 372XP | Timbco 455-C Hydro buncher w/bar saw |
| Experience (years) | 4 | 12 | 7 | 3 |
| Skidding | ||||
| Machine | Timberjack 660C Cable Skidder | Timberjack 380C Cable Skidder | John Deere 540B Grapple Skidder | Timberjack 460 Grapple Skidder |
| Experience (years) | 23 | 39 | 25 | 5 |
| Loading/decking | ||||
| Machine | Prentice 310E | Timberjack 330 | Husky Brute XL-175 | Timberjack 330 |
| Experience (years) | 25 | 1 | 4 | 20 |
The harvest sites were located in north-central West Virginia and had similar species composition, average slope, and stand conditions (Table 2). The tract size ranged from 30 to 50 ha (75 to 125 acres) with average slopes of 10 - 15%. Average initial stand density for the four tracts was approximately 288 trees/ha (115 trees per acre) with an average DBH range of 39.6 to 44.4 cm (15.6 to 17.5 inches) and average merchantable height range of 8.8 to 10.3 m (29.3 to 34.2 feet), respectively. Partial cuts were conducted on all sites and about 88 to 188 trees per hectare (35 to 75 trees per acre) were removed. The major species sampled were red oak (Quercus rubra), white oak (Quercus alba), chestnut oak (Quercus prinus), black cherry (Prunus serotina), sugar maple (Acer sacharrum), and yellow-poplar (Liriodendron tulipifera) (Table 2).
Table 2: Conditions for sites, harvests, and machines in the field study.
| Site 1 | Site 2 | Site 3 | Site 4 | |
| Harvest system | Mechanized | Motor-manual | Motor-manual | Mechanized |
| Harvest method | Partial cut | Partial cut | Partial cut | Partial cut |
| Harvest season | Fall | Fall | Spring | Spring |
| Slope (%) | 5-10 | 5-15 | 20-25 | 15-25 |
| Aspect | N-NW | N-NE | NE | NW |
| Total logs sampled | 1000 | 1000 | 1000 | 1000 |
| Tract Size (ha) | 40 | 30 | 32 | 50 |
| Stand density (trees/ha) | 288 | 263 | 313 | 293 |
| Residual density (trees/ha) | 100 | 163 | 225 | 113 |
| Species composition | Mixed hardwoods | Mixed hardwoods | Mixed hardwoods | Mixed hardwoods |
| Average merchantable height (m) | 8.8 | 10.3 | 9.8 | 9.2 |
| Average DBH (cm) | 39.6 | 44.5 | 41.4 | 40.9 |
In addition to site and stand conditions, variables measured in the field included large end diameter, small end diameter, length, tree species, damage type, damage location, damage dimensions, log grades, and comments for each individual log. Large end and small end diameters were measured in centimeters and the length of each sawlog was recorded in meters.
A total of 1000 hardwood logs from each of the four harvesting sites were sampled for measurable damage sustained during the harvesting operations (Table 3). Of the 1000 observations per harvesting site, 250 observations were made for each of the four harvesting functions: felling, skidding, decking, and loading. Sampling was done one function at a time. Damage was evaluated before and after each function to eliminate double counting of any damage caused by previous function. Large end diameters of observed logs were between 40.1 (15.8) and 46.7 cm (18.4 inches) while small end diameter varied from 35.1 cm (13.8 inches) to 40.4 cm (15.9 inches). The length of observed logs ranged from 3.7 to 4.1 m (12.4 to 13.8 feet) and the log size ranged from 0.43 to 0.64 m3 (93.2 to 138.5 BF in Doyle scale). There were 231 logs that had wood damage and 667 logs that had bark damage, which accounted for 5.8% and 16.7% of the total 4000 observed logs, respectively.
Table 3: Damage distribution of observed logs and log attributes by species.
| Species | Number of observed logs | Average size of observed logs | |||||||
| Name | %1 | No damage | Bark damage | Wood damage | Damage (%) | Large end diameter (cm) | Small end diameter (cm) | Length (m) | Volume (m3) |
| Black cherry | 11 | 372 | 68 | 15 | 3.3 | 41.9 | 38.1 | 3.5 | 0.4 |
| Chestnut oak | 9 | 224 | 111 | 12 | 3.5 | 40.1 | 35.1 | 4.1 | 0.43 |
| Red oak | 24 | 726 | 170 | 52 | 5.5 | 46.7 | 41.4 | 4.0 | 0.64 |
| Sugar maple | 13 | 394 | 89 | 40 | 7.6 | 41.9 | 37.6 | 4.0 | 0.47 |
| White ash | 4 | 110 | 26 | 8 | 5.6 | 43.9 | 39.1 | 3.7 | 0.51 |
| White oak | 4 | 112 | 32 | 18 | 11.1 | 46.5 | 40.4 | 4.0 | 0.58 |
| Yellow poplar | 35 | 1164 | 171 | 86 | 6.1 | 44.7 | 40.4 | 4.0 | 0.58 |
1 Percent proportion is based on the number of logs sampled.
The damage location was defined as the general area where the damage occurred, whether at the bottom (large end), middle, or the top (small end) of the log. All damage including bark removal was recorded. However, for bark removal, there was no volume deduction. Damage volume was a volumetric measurement of the damage area and was calculated based on the length, width, and depth of the damaged area at the greatest point. The grade of each log was determined based on the log's dimensions and the visual defects of the log [1, 10].
Sawlog damage was analyzed in terms of volume and value losses. Volume loss was computed based on the damage dimensions. Pre- and post-damage log grades were given to all logs based on their dimensions, superficial condition, and damage severity. Damage volume was deducted from a log with slight damage while both volume deduction and degradation were considered for a severely damaged log. A log pricing system was developed based on current sawlog market prices from the local hardwood lumber industry and West Virginia and Pennsylvania timber market reports [5, 18, 23]. A monetary value was assigned to the log based on its volume, species, grade, and current hardwood sawlog market prices. This system then assigned a post-damage volume loss and monetary value to each log based on the amount of damage the log had sustained. Each log then had a pre-damage and a post-damage monetary value associated with it. Monetary value loss was determined by calculating the difference between the pre-damage value and the post-damage value. Log size was computed based on its volume and grouped into five different categories of 0.23 (50 BF for volume between 0 and 50), 0.46 (100 BF), 0.69 (150 BF), 0.92 (200 BF), and 1.15 m3 (250 BF). In order to compare the log damage, percentage of volume loss, value loss per cubic meter, and percentage of value loss were defined and computed based on the ratios of damage volume over log volume, value loss over log volume, and value loss over log value, respectively.
ANALYSIS AND RESULTS
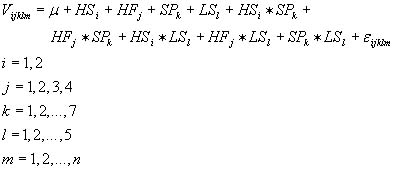
The data was analyzed by using Statistical Analysis Systems (SAS). The general linear model (GLM) procedure, which is a type of analysis of variance (ANOVA), was used to determine if significant differences existed among harvesting systems, harvesting functions, tree species, and log sizes. The GLM can be expressed as follows:
(1)
Where Vijklm represents the mth observation of the volume or value loss for a log; μ is the mean of response variable; HSi is the effect of ith harvesting system; HFj is the jth effect of harvesting function; SPk is the kth effect of species, LSl is the lth effect of log size; εijklm is an error component for all uncontrolled variability; and n is the number of observations within each treatment. The interactions among harvesting systems, functions, tree species, and log sizes were also considered in the model.
The response variables were tested with Duncan's New Multiple Range Test (DNMRT) at the 5-percent level to determine if there were any significant differences of damage volume and value loss among harvesting systems, functions, tree species, and log sizes. DNMRT was chosen over Fisher's Least Significant Difference (FLSD) procedure for two reasons. FLSD requires that the null hypothesis be rejected in the ANOVA procedure, and DNMRT is slightly more conservative than FLSD [3].
Gouge was the most common damage type found in the field study. However, splits and slabbing caused the most volume and value losses to logs. Splits caused losses of $7.9/m3 ($36.1/MBF) for the damaged logs and resulted in 6.8% of volume and value losses while slabbing resulted in 6.0% volume loss and 5.9% or $4.9/m3 ($22.4/MBF) in value loss (Table 4). Most damage, about 47%, occurred at the bottom parts of logs. This is mainly because the bottom section of the log is usually the location where the grapple holds and the cable chokes. Damage at the bottom of the logs resulted in losing 2.6% in volume and 2.6% of the log's value or $3.6/m3 ($16.3/MBF). It was followed by damage at the middle of the log with 2.1% value loss or $3.3/m3 ($15.1/MBF) value loss and 2.1% of volume loss. Harvesting in site 4 presented relatively higher damage rates to logs (9.7%) in comparison with the damage rates of 3.8% in site 1, 2.3% in site 2, and 7.3% in site 3. This higher damage might be because of the difficult terrain and less experienced operators of the felling and skidding machines on site 4. However, motor-manual logging caused more volume and value losses in sites 2 and 3.
Table 4: Volume and value losses per log by damage type, location, and site.
| Volume loss | Value loss | ||||||
| Number of logs | Per log (m3/1000) | % of log's volume | $/log | $/m3 | % of log's value | ||
| Damage type | Gouge | 90 | 2.3 | 0.4 | 0.3 | 0.5 | 0.4 |
| Slab | 39 | 19.3 | 6.0 | 2.1 | 4.9 | 5.9 | |
| Split | 67 | 35.8 | 6.8 | 4.4 | 7.9 | 6.8 | |
| Scrape | 30 | 1.8 | 0.4 | 0.2 | 0.3 | 0.4 | |
| Choker | 5 | 2.3 | 0.3 | 0.3 | 0.4 | 0.3 | |
| Damage location | Bottom | 108 | 15.2 | 2.6 | 2.2 | 3.6 | 2.6 |
| Middle | 84 | 16.1 | 2.1 | 1.5 | 3.3 | 2.1 | |
| Top | 39 | 10.1 | 2.8 | 1.3 | 3.0 | 2.8 | |
| Site | 1 | 38 | 3.7 | 0.9 | 0.4 | 0.8 | 0.9 |
| 2 | 23 | 56.9 | 11.1 | 6.1 | 11.7 | 11.2 | |
| 3 | 73 | 18.8 | 4.7 | 2.1 | 4.2 | 4.7 | |
| 4 | 97 | 6.4 | 1.1 | 1.1 | 1.7 | 1.1 | |
The percentage of volume loss (df = 1,230; F = 37.32; P =0.0001) and the percentage of value loss (df = 1, 230; F = 38.03; P = 0.0001), or value loss per cubic meter (df = 1,230; F = 22.14; P = 0.0001) were significantly different between the two harvesting systems studied. Motor-manual systems lost 6.1% of a log's volume and 6.3% of value loss or $6.0/m3 ($27.6/MBF) while mechanized systems lost 1.1% of volume and 1.0% of value or $1.5/m3 ($6.7/MBF) (Table 5). Felling damage caused 6.2% volume loss of the logs (df = 3,230; F = 14.37; P = 0.0001) and 6.1% of value loss (df = 3,230; F = 14.65; P = 0.0001) or $6.4/m3 ($29.6/MBF) (df = 3,230; F = 10.33; P = 0.0001), which differed significantly from the damage caused during skidding, decking, and loading operations. However, log damage was not significantly different among skidding, decking, and loading operations.
The percentage of damaged logs by species ranged from 3.3% for black cherry to 11.1% for white oak (Table 3). Damage to white ash resulted in 17.8% loss of the volume and $15.2/m3 ($69.6 per MBF) value loss (17.8% of log's value), which was followed by damage to black cherry with 4.1% volume loss and $9.0/m3 ($41.1 per MBF) value loss (4.1% of log's value) (Table 5). Volume loss of damaged logs was not significantly different among black cherry, chestnut oak, red oak, sugar maple, white oak, and yellow poplar while the values loss did not differ significantly among chestnut oak, red oak, sugar maple, white oak, and yellow poplar.
Table 5. Means and significance levels of operational variables associated with damaged logs1.
| Volume loss | Value loss | |||||
| Per log (m3/1000) | % of log's volume | $/log | $/m3 | % of log's value | ||
| Harvest system | Motor-manual | 28.0a | 6.1a | 3.0a | 6.0a | 6.3a |
| Mechanized | 5.5b | 1.1b | 0.9b | 1.5b | 1.0b | |
| Harvest functions | Felling | 28.9c | 6.2c | 3.4c | 6.4c | 6.1c |
| Skidding | 1.8d | 0.4d | 0.2d | 0.4d | 0.4d | |
| Decking | 3.2d | 0.8d | 0.4d | 0.9d | 0.8d | |
| Loading | 1.8d | 0.4d | 0.2d | 0.4d | 0.4d | |
| Species | Black cherry | 16.9e | 4.1e | 4.1e | 9.0e | 4.1e |
| Chestnut oak | 4.1e | 1.0e | 0.2f | 0.5f | 1.0e | |
| Red oak | 9.2e | 1.5e | 1.6f | 2.5f | 1.5e | |
| Sugar maple | 8.7e | 1.6e | 2.1f | 3.4f | 1.6e | |
| White ash | 101.4f | 17.8f | 9.2g | 15.2g | 17.8f | |
| White oak | 15.2e | 2.9e | 1.4f | 2.6f | 2.9e | |
| Yellow poplar | 13.8e | 3.8e | 1.0f | 2.3f | 3.8e | |
| Log size (m3) | 0.23 | 12.9h | 6.7h | 0.7h | 3.3h | 6.7h |
| 0.46 | 15.6h | 3.9hi | 1.7hi | 4.1h | 3.9hi | |
| 0.69 | 17.9h | 2.9i | 2.5i | 4.0h | 2.9i | |
| 0.92 | 7.3h | 1.0i | 1.3hi | 1.4h | 1.0i | |
| 1.15 | 13.3h | 0.8i | 1.8hi | 1.2h | 0.8i | |
1Means with the same letter in a column are not significantly different at the 5 percent level with Duncan's Multiple Range Test.
The percentage of volume and value losses varied increasingly as the log size decreased from 0.8% of 1.15 m3 (250 BF) logs to 6.7% of 0.23 m3 (50 BF) logs (Table 5). Value loss was between $1.2/m3 ($5.5 per MBF) of 1.15 m3 (250 BF) logs and $4.1/m3 ($18.8 per MBF) of 0.46 m3 (100 BF) logs and generally decreases with the log size. The log size did affect percentages of volume loss (df = 4,230; F = 5.60; P = 0.0003) and value loss (df = 4,230; F=5.61; P = 0.0003) significantly. However, the volume loss per damaged log (df = 4, 230; F = 1.68; P = 0.1566) and the value loss per per cubic meter (df = 4, 230; F = 2.36; P = 0.0561) were not sensitive to log size.
The percentage of volume loss and value loss was significantly affected by the interactions of harvesting system and tree species (df = 6,230; F = 2.40; P = 0.0303) and harvesting system and log size (df = 4,230; F = 4.01; P = 0.0040). The volume loss per log was significantly different for the interaction of harvesting system and species (df = 6, 230; F = 3.66; P = 0.0020). However, all the interactions did not significantly affect the value loss per cubic meter for the damaged logs.
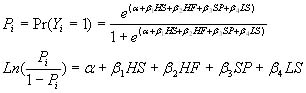
A logistic regression model was employed to predict the damage probability for a log during harvesting operations. The response variable in this model represents the damage status of a log, which is scored 0 for no damage and 1 for wood damage. Bark damage was excluded in the model. Let Pi denote the probability that a log will have wood damage (Yi = 1), then:
 (2)
(2)
Where
HS = harvesting systems (1 for mechanized,
0 for motor-manual);
HF = harvesting functions (1 = felling, 0
=skidding, decking, and loading);
SP = species (1 for white ash, 0 for other
species);
LS = log size
(m3);
α, β1,
β2, …,
β4 = partial regression
parameters fitted;
Ln = natural logarithm.
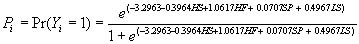
The model was fitted by using the observed damaged log data set. All four parameters and intercept are significant at 0.05 level in the model. The Hosmer and Lemeshow test was conducted to test the adequacy of fit of the model [20]. A p-value of 0.6589 from the test result suggests that the fitted model of Equation (3) is an adequate model.
 (3)
(3)
By using this model, we can predict the probability of a log being damaged based on the harvesting system, the harvesting function, tree species, and log size. For example, if we felled a black cherry tree of 0.69 m3 (150 BF) mechanically (HS = 1, HF = 1, SP = 0, LS = 0.69), the predicted damage probability is 0.094 while the probability increases to 0.134 if that tree is felled manually (HS = 0, HF = 1, SP = 0, LS = 0.69). Accordingly, the predicted damage probabilities for skidding, decking, and loading the same log are lower than felling and are 0.05 for the motor-manual system (HS = 0, HF = 0, SP = 0, LS = 0.69) and 0.034 for the mechanized system (HS = 1, HF = 0, SP = 0, LS = 0.69), respectively.
DISCUSSION AND CONCLUSIONS
About 6% of all observed logs were damaged to some extent in the field study, which could result in losses of up to 6.7% in volume and value. The majority of the value loss was caused during the felling function when using a motor-manual harvesting system on difficult terrain. The damage caused by motor-manual felling operations overshadows damage from all other parts of the timber harvesting process. Results suggest that the process of skidding, decking, and loading of logs has very little impact on damage levels. Even though the damage from motor-manual felling by far exceeds any other damage looked at in this study, the value loss associated with the motor-manual felling process is minimal.
Except for white ash, all other major hardwood species in this region consisting of red oak, white oak, chestnut oak, red maple, yellow poplar, black cherry, and sugar maple showed similar volume and value loss. White ash presented a significant difference in volume and value loss compared to the other six species observed. One reason for this could be the mechanical properties of ash. It has been suggested in past studies that more brittle species have a greater susceptibility to damage than other species having more robust characteristics. Another reason for differences among species could be the time of harvest. Although, in this study all observations were made during leaf on conditions in the fall and spring, a different outcome might have been observed if this study had been conducted in the winter during leaf off conditions.
Another species-specific point to consider is the hardwood market. As demand for certain species rises and falls, more or less of that species may be harvested. Also, a high demand may generate greater care in harvesting certain species, whereas a low demand may be have the opposite effect.
The amount of damage caused to hardwood logs in this study may not seem important based on the value loss per unit volume. This is especially true when looking at the difference between mechanized and motor-manual harvesting systems. Is the amount of damage to hardwood sawlogs enough to justify an upgrade from chainsaw felling to a mechanized method? With the initial investment cost of several hundred thousand dollars for making the switch to mechanized felling, an average savings value of $4.6/m3 ($20.9 per MBF) from the damaged logs does not seem high enough to justify the switch for a short term. However, if the per unit cost is considered, the switch from a motor-manual system to a mechanized system might be worth it in the long run. However, additional analysis is needed before we can recommend one system over the other.
Damage to sawlogs is occurring during harvesting operations, but to a lesser degree than might be perceived by the wood products industry. Certainly, there is room for improvement of motor-manual felling operations. This could be accomplished by formal chainsaw felling instruction, and by paying more attention to value and grade, rather than volume alone. Damage to logs is likely to vary from site to site, and maybe even within a single site. These variations may be driven by geographic factors not considered in this study, which focused on north central West Virginia.
Further research is needed to determine the effects that other harvesting systems may have on sawlog damage and value loss, as well as a more in-depth analysis of the veneer log degrade. Volume and value losses associated with sub-optimal bucking should be studied in the central Appalachia region since a greater potential value gain can be achieved through optimal bucking [19].
The information gained from the field study is important in creating new guidelines or training to help minimize hardwood log damage occurring during the timber harvesting process. It would be beneficial to determine how log damage relates to skid trail density, road capacity, multiple landings and their locations, and length of skid. Along with these factors, terrain slope could be analyzed more closely, especially its correlation with the occurrence of switchbacks that may damage logs.
Implementing new and better guidelines or training requirements for fallers could create monetary gains for loggers while better utilizing the forest resources by not damaging valuable hardwood logs.
ACKNOWLEDGEMENTS
The authors would like to thank Allegheny Wood Products and TrusJoist MacMillan in West Virginia for allowing field data collection on their operations.
AUTHOR CONTACT
Dr. Wang can be contacted by e-mail at -
jxwang@wvu.edu
REFERENCES
[1] Carpenter, R.D., D.L. Sonderman, E.D. Rast, and M.J. Jones. 1989. Defects in hardwood timber. Agricultural Handbook No. 678. USDA Forest Service, Northeastern Forest Experiment Station, Delaware, OH. 88 pp.
[2] Craig, R. 1982. Raw material quality control. IN: Proceedings of Quality Control in Lumber Manufacturing. San Francisco. Brown, Terence D., Ed. Miller Freeman Publications. San Francisco, CA. pp. 50-60.
[3] Dowdy, S. and S. Wearden. 1991. Statistics for Research. John Wiley & Sons Inc. New York, NY. 621 pp.
[4] Egan, A.F. 1999. Residual stand damage after shovel logging and conventional ground skidding in an Appalachian hardwood stand. Forest Products Journal. 49(6): 88-92.
[5] Emanuel, D. and C. Rhodes. 2002. Bulletin of hardwood market statistics: 1989 - 2000. Research Note NE-375, USDA Forest Service, Northeastern Research Station, Princeton, WV. 22 pp.
[6] Faust, T.D. and W.D. Greene. 1989. Effects of felling head type on tensile strength of southern pine dimension lumber. Forest Products Journal. 39 (11/12): 82-84.
[7] Gallagher, T.V., R.M. Shaffer, and W.B. Stuart. 1985. An assessment of shear damage to southern pine sawlogs. Forest Products Journal. 35 (11/12): 87-91.
[8] Greene, W.D. and J.F. McNeel. 1987. Productivity, costs, and levels of butt damage with a Bell Model T feller-buncher. Forest Products Journal 37(11/12): 70-74.
[9] Greene, W.D. and J.F. McNeel. 1989. Potential costs of shear damage in a southern pine chip-n-saw mill. Forest Products Journal. 39 (5): 12-18.
[10] Hanks, L.F., G.L. Gammon, R.L. Brisbin, and E.D. Rast. 1980. Hardwood log grades and lumber grade yields for factory lumber logs. Research Paper NE-468. USDA Forest Service, Northeastern Forest Experiment Station, Broomall, PA. 31 pp.
[11] Hassler, C.C., S.T. Grushecky, and M.A. Fajvan. 1999. An assessment of stand damage following timber harvests in West Virginia. Northern Journal of Applied Forestry. 16(4): 191-196.
[12] Lamson, N.I., H.C. Smith, and G.W. Miller. 1985. Logging damage using an individual-tree selection practice in Appalachian hardwood stands. Northern Journal of Applied Forestry. (2): 117-120.
[13] McNeel, J.F. and F. Czerepinski. 1987. Effect of felling head design on shear-related damage in southern yellow pine. Southern Journal of Applied Forestry. 11(1): 3-6.
[14] McNeel, J.F. and R. Copithorne. 1996. Yarding systems and their effect on log quality and recovery levels in coastal timber of British Columbia. IN: Proceedings of Forest Products Society, Portland, OR.
[15] Middleton, G.R. and B.D. Munro. 1987. Evaluating two methods of coping with tree shear damage at the sawmill. Forest Products Journal. 37 (7/8): 17-22.
[16] McMorland, B. and D.Y. Guimier. 1984. Analysis of felling butt-damage in Interior British Columbia. FERIC Technical Note TN-76. Pointe Claire, Quebec, Canada. 25pp.
[17] Murphy, G. and A.A. Twaddle. 1985. Techniques for the assessment and control of log value recovery in the New Zealand forest harvesting industry. IN: Proceedings of the 9th Annual Meeting of Council on Forest Engineering. September 29 - October 2, 1985. Mobile, AL.
[18] Pennsylvania State University. 2002. The Pennsylvania Woodlands' Timber Market Report (http://www.cas.psu.edu/docs/CASDEPT/FOREST/TMR/TMR1.htm). State College, PA, USA.
[19] Pickens, J.B., A. Lee, and G.W. Lyon. 1992. Optimal bucking of Northern hardwoods. Northern Journal of Applied Forestry. 9(4): 149-152.
[20] SAS Institute Inc. 1999. SAS/STAT User's Guide, Version 8. SAS Institute Inc., Cary, NC, USA.
[21] Sessions, J. 1988. Making better tree-bucking decisions in the woods. Journal of Forestry. (10): 43-45.
[22] Swiatlo, J.A, R.M, Shaffer, W.B. Stuart, and E.M. Wengert. 1990. An analysis of shear damage at two southern pine sawmills. Forest Products Journal. 40(6): 33-36.
[23] West Virginia University. 2002. West Virginia Timber Market Report (www.ahc.caf.wvu.edu). Morgantown, WV, USA.
[24] Williston, E. 1979. Opportunity areas and leverage points. IN: Proceedings of the electronics workshop. Sawmill and plywood clinic. Portland, Oregon. March, 1979. pp. 14-18.
[25] Zavala, D.Z. 1995. The effect of log length and lumber thickness over-allowance on lumber recovery. Forest Products Journal. 45(2): 41-45.